The social media metrics to track in 2026 (and why)

Written by Carly Hill
Published on June 26, 2025
Reading time 23 minutes

Table of Contents
Social media involves the ultimate balancing act between creativity and analytics. If creativity is the icing on the cake, social media metrics are the essential ingredients.
Metrics show whether your content is doing more than just looking good—they reveal if it’s helping your business grow. But there’s no single “magic” metric to measure. You must rely on a healthy mix of data points that reflect your brand, goals and strategy.
As social networks evolve, so do the metrics that matter most. This article highlights key metrics social teams are focusing on today and details how sharper social media analytics and reporting strategies can prove social is working.
What are social media metrics?
Social media metrics are data points that track the performance and impact of your social channels, content and strategy. They translate raw user behavior (likes, clicks, views) into actionable business intelligence.
For instance, tracking engagement metrics reveals exactly how well your content resonates with your target audience. By uncovering what truly works, you can refine your strategy and strengthen connections with followers. Without this visibility, it’s easy to overlook low-performing areas and miss vital opportunities to improve content, meet customer needs, or reach entirely new market segments.
Ready to simplify your reporting and uncover these insights for your own brand in minutes?
Social media metrics are the vital data points that track the performance and impact of your social channels, content, and strategy. These insights transform raw data into a clear roadmap for growth, revealing exactly how well your content resonates with your target audience. By uncovering which metrics truly work, you can refine your strategy and strengthen connections with followers without missing vital opportunities for improvement.
Here is a full list of social media metrics sorted by each stage of the marketing funnel, download our social media KPI template.
Why is measuring social media engagement metrics important?
The importance of measuring social media metrics goes far beyond social. Social media data is business intelligence that informs brand health, competitive standing and performance benchmarks.
Understanding typical social media benchmarks by industry gives you valuable context for interpreting your performance and deciding which metrics are most relevant to your goals.
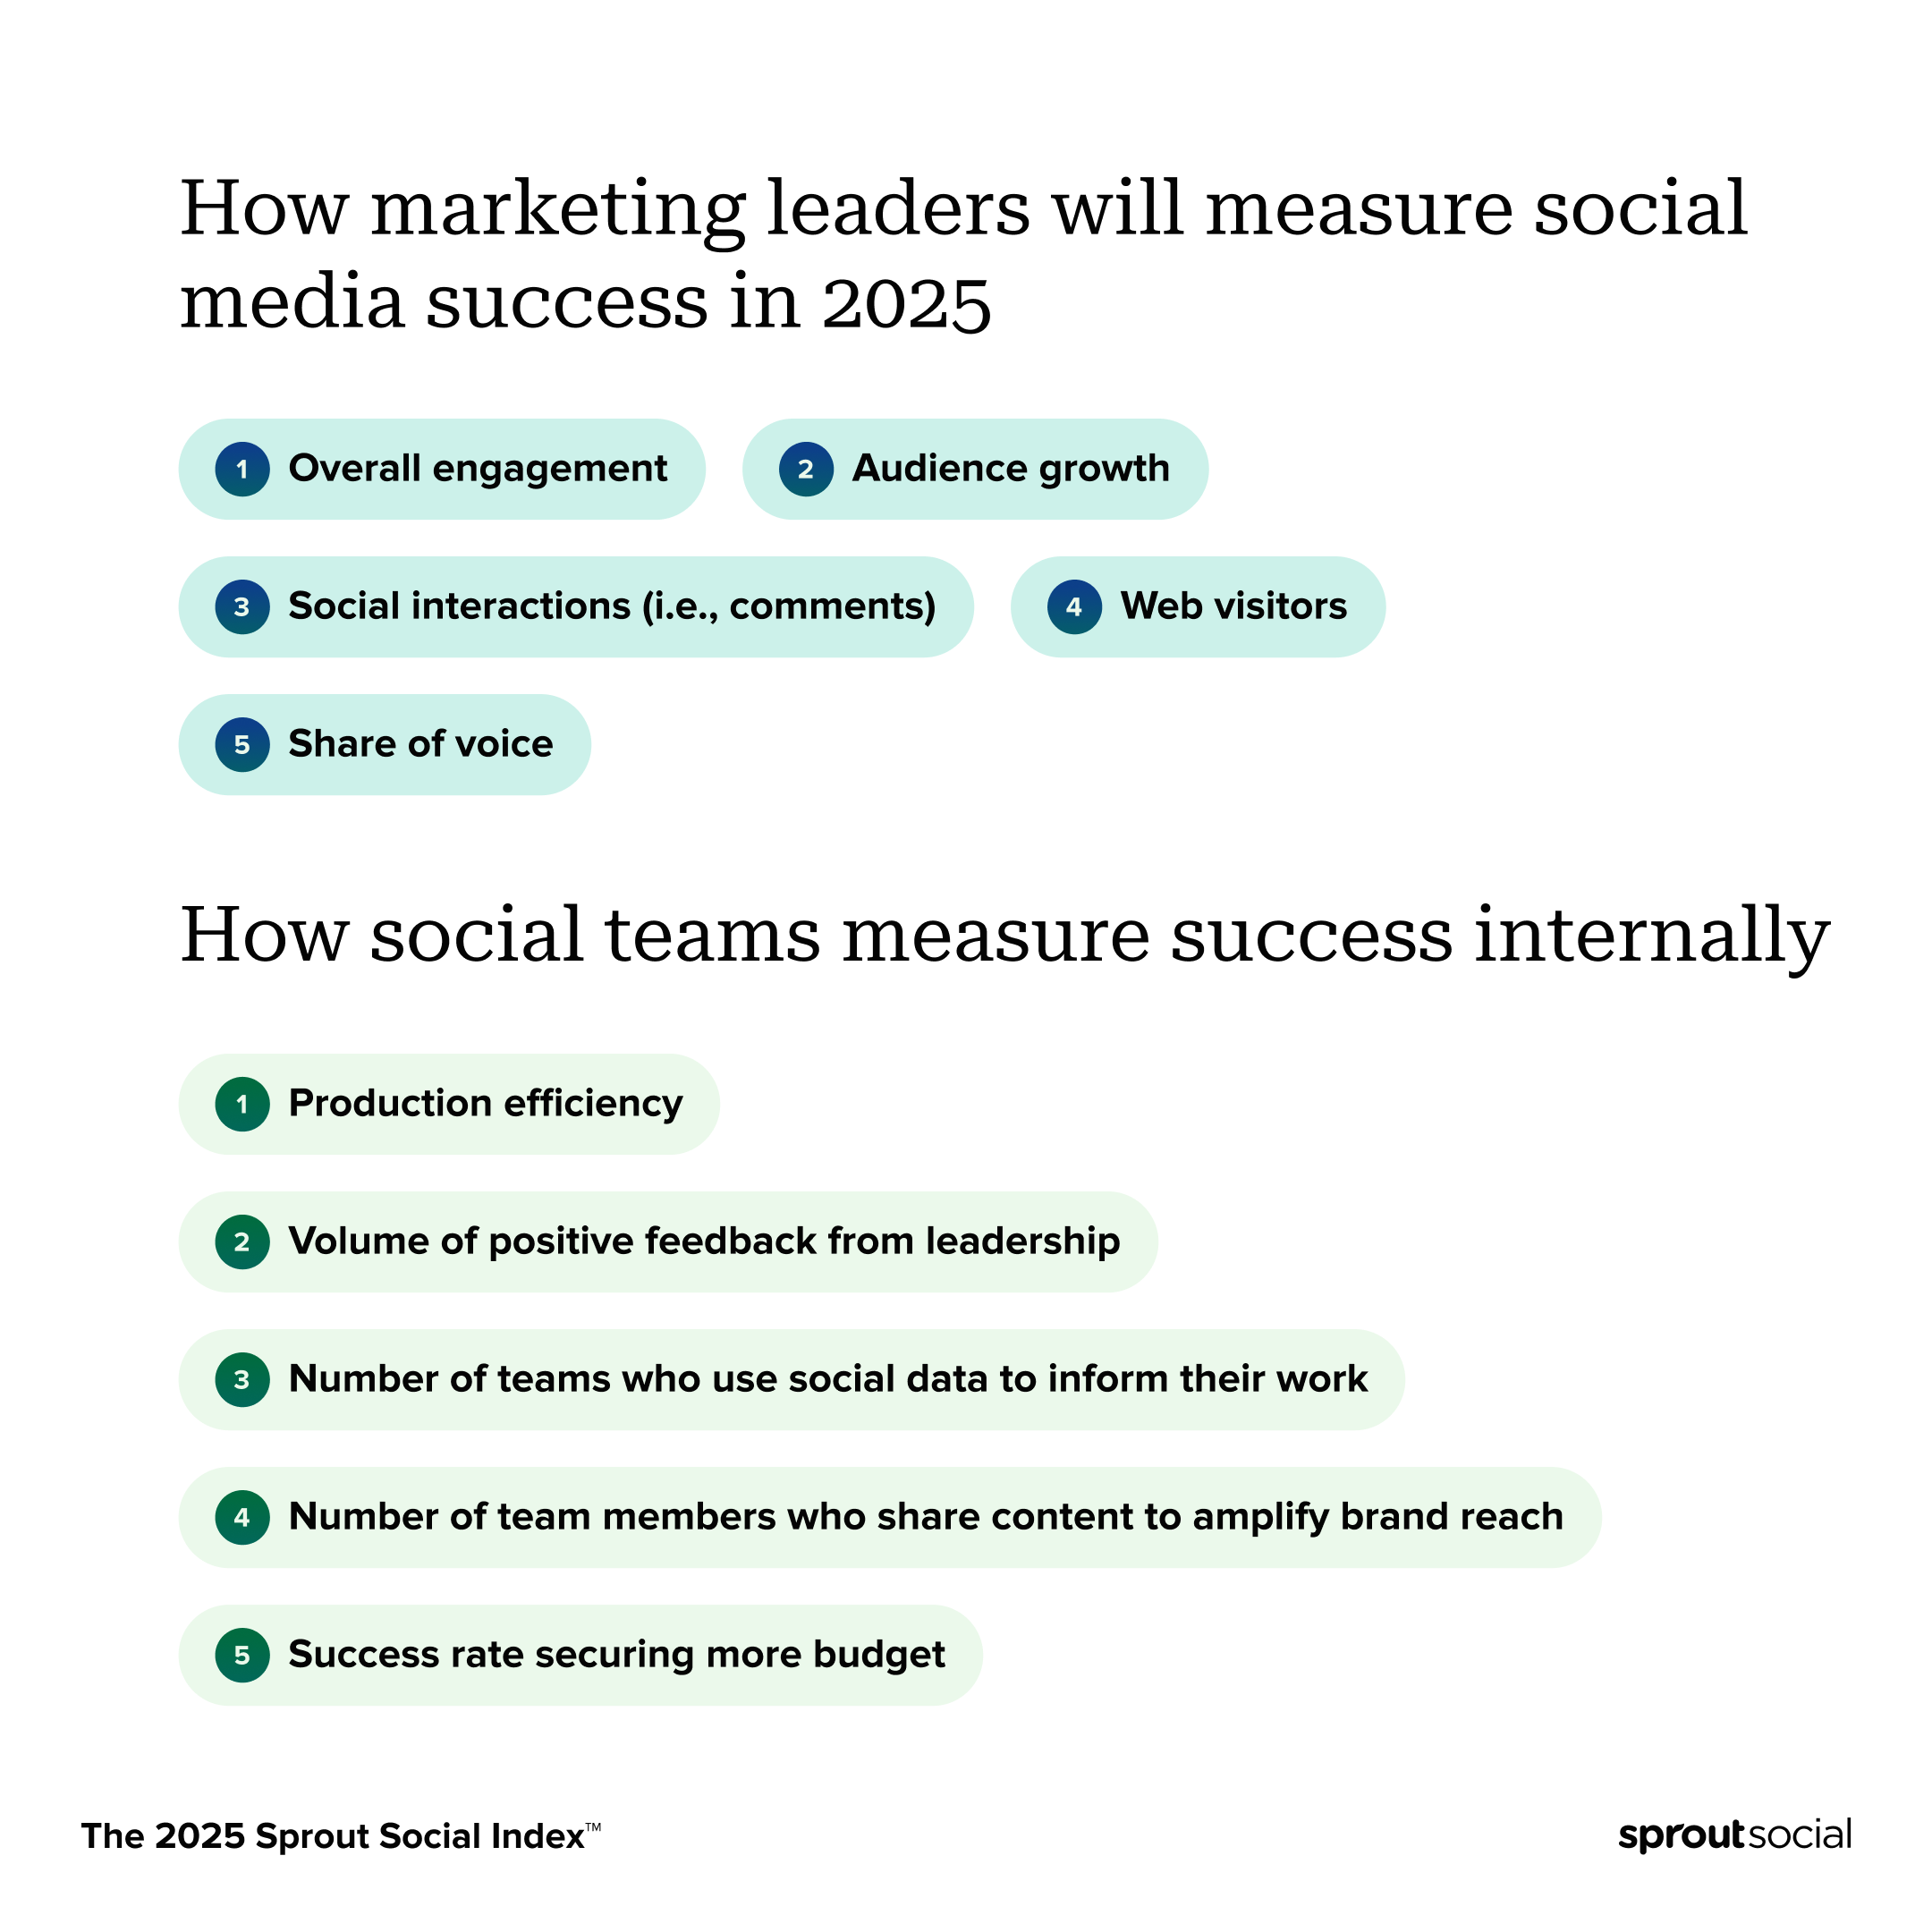
According to the 2025 Sprout Social Index™, 65% of marketing leaders say they need to prove how social media supports business goals to get leadership buy-in. Tying social efforts to real outcomes makes it easier to illustrate the value of social and your return on investment—crucial for securing support for your social strategy.

8 types of social media metrics marketers are prioritizing more
The metrics you track should align with your social media goals, but knowing where other social pros are focusing can help you decide what to measure.
In the Index, Sprout asked marketers which metrics they consider the most critical social media KPIs. These are the metrics they reported weighing more heavily this year:
- Audience growth metrics
- Metrics to monitor customer satisfaction
- Awareness metrics
- Metrics for customer retention
- Metrics for social media ROI
- Brand health metrics
- Social media engagement metrics
- Paid social media metrics
Audience growth metrics
Follower count is often dismissed as a vanity metric. But when evaluated over time as follower growth, it tells a more complete story about your channel’s health, the awareness you’re building and whether you’re outpacing competitors—or falling behind.
Here are a few audience growth metrics to track:
Follower growth
Follower growth measures the net new followers you’ve gained over a specific amount of time. It’s a powerful way to measure the resonance of your content, campaigns and social media experiments.
To calculate this metric, subtract the number of followers you had at the start of the period from how many you have now. Or, use an analytics automation tool to focus on insights instead of math. For example, Sprout Social’s Instagram Profile Report automatically calculates net growth and helps you visualize how much your count has increased.

Follower growth rate
While follower growth measures your change in followers, follower growth rate shows the speed at which you’re gaining or losing them. It’s expressed as a percentage so you can quickly understand how much your audience is expanding or contracting.
To calculate your growth rate, divide the number of followers you gained during the period by how many you had at the start, then multiply by 100.
For example, if you had 10,000 followers at the beginning of June and 10,200 at the end, your growth rate would be: (200 / 10,000) x 100 = 2%.
Audience size
Audience size is sometimes seen as superficial. But when viewed in context, it’s a valuable indicator of channel health and long-term performance.
Tracking changes in your follower count monthly, quarterly and yearly provides important data that fuels the higher-level metrics mentioned above.
Metrics to monitor customer satisfaction
Conversations on social media reveal valuable information about what is and isn’t working with your content, customer care, brand and products. Here are a few customer satisfaction metrics to monitor:
Reply time
Being responsive on social is key to building community and serving your customers. According to the Index, consumers say personalized customer service should be brands’ top priority on social media. That’s why reply time (how long it takes for your team to respond on social) is one of the most important customer service metrics to measure.

The best way to quantify reply time is with a tool like Sprout’s Inbox Team Report, which automatically calculates team performance metrics like Average Reply Time for you.

Total response volume
This customer service metric counts the number of responses your team sends to customers. Since unanswered messages on social create frustrating experiences, increasing your total response volume can help you improve your customer care strategy.
Customer satisfaction score (CSAT)
Your CSAT score reflects how satisfied customers are with your products, services or brand as a whole. You typically source this number from surveys, but you can also measure it on social through messaging.
With Sprout, you can DM customers for feedback via X and Facebook to gauge their CSAT score or Net Promoter Score—how likely they are to recommend your company to a friend. Then, you can use Sprout’s Customer Feedback Report to synthesize your findings.

Comments
While this is also an engagement metric, what people say in the comments provides valuable information about how they perceive your business. The comments section is a great place to uncover opportunities to improve the customer experience.
Awareness metrics
Awareness metrics, as the name suggests, are integral to connecting the dots between your social media strategy and the brand awareness it creates.
Here are a few awareness metrics to prioritize:
Reach
Reach measures the number of unique viewers who saw a post. In other words, how many individuals your content actually reached.
The difference between reach and impressions can be confusing at first. Think of it this way: If you see a post three times, that counts as three impressions—but only one reach. Both are important to track, especially if your goals focus on brand awareness and perception.
Impressions and Views
At the post level, impressions show how many times a post appears on someone’s screen. They help indicate how popular a piece of content is and that people may be viewing a post multiple times.
Not every channel has both reach and impressions. For example, TikTok’s “total video views” is the equivalent of impressions. Twitter and YouTube only track impressions but not reach.
As of 2026, Instagram has also shifted to “Views” as its primary metric across all formats (Reels, Stories and posts), replacing “Impressions” and “Plays” in many dashboards. This unifies measurement, counting repeat viewings similar to impressions.
Impressions and views tell you a lot about the potential visibility your content has on social, but they don’t tell the whole story. If you have multiple goals—like increasing awareness and educating your audience—you’ll likely want to consider impressions alongside engagement and conversion metrics to get a clearer picture of performance.
Video views
Video views are increasingly a signal of content performance, and not just on TikTok. Instagram, Facebook and even LinkedIn are all pushing video formats because they increase engagement and keep people on the network longer.
Tracking video views helps you understand how well your content captures attention. When you combine them with metrics like view duration, engagement, saves or shares, they tell you even more about how effectively your content resonates.
Metrics for customer retention
Customer retention and loyalty are slightly less straightforward to measure on social than awareness or conversion metrics. But you can still gather this information through your channels.
Here are a few metrics to help you measure customer retention and loyalty:
Net promoter score (NPS)
Your net promoter score is how likely customers are to recommend your brand to others—a helpful indicator of customer loyalty and retention.
You typically gather NPS info through surveys that ask your customers how likely they are to refer your brand on a scale of 0 to 10. Those who mark 9 or 10 are “promoters” who are excited about your brand. Anyone who marks 0-6 is a “detractor” and is unsatisfied. To calculate your score, subtract the percentage of detractors from the percentage of promoters.
With Sprout, you can send NPS surveys through Facebook and X DMs after consumers interact with your brand, and their answers will feed directly into your Customer Feedback Report.

Social commerce metrics
Social commerce storefronts like Facebook Shops and Instagram Shopping give you access to a number of valuable retention and loyalty metrics.
In Meta’s Commerce Manager Insights, you’ll find metrics like returning visitors, returning buyers and sales from followers. While they’re all estimates, they’ll still help you understand social commerce customer retention.
Reviews
Tracking your reviews from channels like Google, TripAdvisor and Facebook is a solid way to gauge customer satisfaction and loyalty.
What’s more—responding to reviews, whether positive or negative, helps build stronger relationships. It rewards happy customers and might help you win over dissatisfied ones.
Metrics for social media ROI
To show how social contributes to your bottom line, you need metrics that connect the dots between your content and real results, which is a key part of an ongoing conversation about how to measure the business value of social media.
Tracking conversions, web visits and referral traffic back to your social channels is a powerful way to prove ROI and get the credit your team deserves.
Here are the ROI metrics to pay attention to:
Conversion rate
Conversion rate shows how well your social ad or marketing campaign convinces people to take action, whether that’s making a purchase, signing up for a webinar or visiting a webpage.
To calculate conversion rate, divide the total number of your social media conversions by your desired metric (could be clicks, website visits or impressions), then multiply by 100.
Most social media analytics tools will do this for you. If the number seems low, try A/B testing your messaging, creative or CTA to see what clicks.
Conversions
On top of knowing your conversion rate, it’s also helpful to know how many conversions your ad, post or channel receives.
A conversion is when someone takes a desired action, like purchasing something from your site or signing up for an upcoming event. A social conversion means they visited via a social media channel and purchased something during that same visit.
Social media referral traffic
Referrals are how a user lands on your website. In web analytics, you’ll see them broken down into sources. Social media referral traffic means visitors come to your website directly from social media posts and pages.
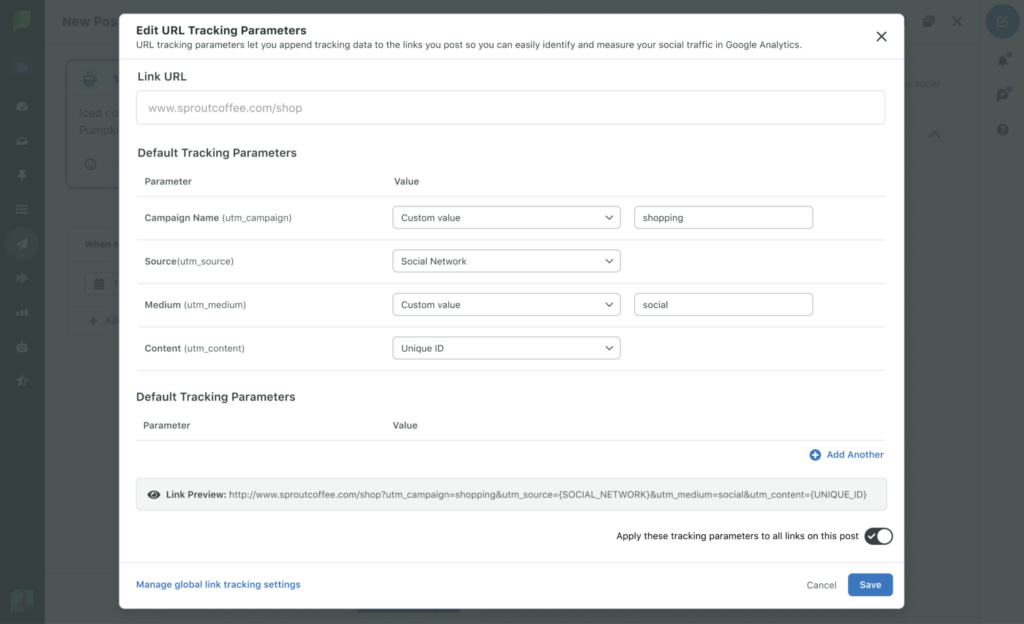
The best way to measure this is with UTM tracking. UTM tracking adds a short code to any URLs you share on social—think blog posts or product links—so you can see in Google Analytics exactly how much traffic each channel, post or ad sends to your site.
Sprout’s UTM Builder helps you create these trackable links. Typically, you’ll monitor Social as the source/medium, then drill down by network.
Website traffic
Even if your social team isn’t tracking your website traffic, it’s an important metric to watch alongside your social media performance. Being able to link an increase in site visits to social media activity, whether campaigns, new content formats or viral posts, is one of the best ways to illustrate social’s impact on the larger business.
Tools like Google Analytics (shown below in a Sprout report) visualize daily web sessions tied directly to specific social channels.

Brand health metrics
What you learn on social carries implications—and possibilities—for your entire business. And social metrics that ladder up to brand health are some of the most powerful sources of social business intelligence.
Here are a few metrics that shed light on the health of your organization:
Audience sentiment
Reading comments tells you what people say about your brand and products, but understanding how they feel about them sheds much more light on brand health.
Audience sentiment reveals how people truly feel about your offerings. You can even compare the sentiment toward your brand to that of competitors.
Social listening turns social media chatter around your brand or specific topics into quantifiable sentiment. Social listening metrics let you shape your social strategy based on real-time data.

Brand mentions
Brand mentions track how often people talk about your brand in posts or comments on social—whether or not they tag you. Organic social mentions—like @mentions that aren’t part of a reply or untagged shoutouts in Instagram stories—signal strong brand awareness.
Your team is likely already monitoring tagged mentions. But to see the full scope of your brand’s visibility, you also need to capture untagged posts and comments (even those that misspell your name). For example, Brooklinen spotted and responded to a conversation without being tagged:

Social listening also empowers you to identify common keywords mentioned alongside your brand. This makes it easier to determine if those mentions signal praise, feedback or a brewing crisis.

Share of voice
Share of voice shows you how your brand stacks up against competitors in social conversations. It reveals how much of the industry chatter you own.
To measure share of voice, divide your brand’s metric (like mentions) by the total number of mentions across your market. What you measure depends on your goals, but mentions are often the most relevant for social teams.
Because this metric pulls from large volumes of real-time conversations, it’s tough to calculate manually. A social listening tool makes it easier to track, compare and act on what people are saying.

Social media engagement metrics
Engagement is a big umbrella—and one of the most important categories to track. It boils down to how much your audience interacts with your account or content and how often. High engagement indicates an interested audience and points to the content types that appeal most.
To really understand engagement, you’ll need to look at a combination of metrics. A post with 100,000 impressions might seem impressive until you see it only earned 50 engagements. That’s a sign it didn’t spark connection. On the flip side, a post with 100,000 engagements could seem like a win, but if most are “angry” reacts, that’s worth a closer look.
Social media engagement metrics like those in Sprout’s 2025 Content Benchmarks Report help you understand performance, both over time and against competitors. Use them to spot trends, set goals and see how your content stacks up.
Here are a few social media engagement metrics to look at:
Post engagement rate
Post engagement rate shows how actively your audience interacts with your content. High rates mean your social media efforts are doing their jobs—sparking likes, comments and shares.
Likes, comments, retweets, reactions, etc.
These are your day-to-day signals of interaction. They may not contain much information on their own, but collectively, they reveal what’s working. By zooming out and monitoring them over time, they help you spot patterns in what your audience values and responds to.
Shares
Shares offer a different kind of insight. They show which content pieces your audience finds worthy of sending. If people pass your content along to friends, that’s a strong vote of brand confidence and a big boost to brand awareness.
Video completion rate
Video views tell you who pressed play (initial popularity). Video completion rates tell you who stayed to watch (actual engagement). If your video racks up 10,000 views but most people bounce after five seconds, you’ve grabbed attention but lost interest. A high completion rate shows your video is compelling from start to finish.
Paid social media metric
When it comes to paid social, getting the most bang for your buck is crucial.
To spend smarter and optimize your ad campaigns, track these metrics:
Click-through rates (CTR)
Click-through rates compare how often someone clicks your content against the number of times it was seen. A high CTR means an effective ad that drives action.
CTRs vary wildly across industries, networks and content types. You’ll often measure them in places like:
- Email links and call-to-action buttons
- PPC ads
- Links on landing pages
- Social media advertising
- On-site elements (like buttons or images)
Research industry benchmarks before you launch your campaign, then monitor your ads and adjust accordingly.
Cost per click (CPC)
Cost per click is exactly what it sounds like: how much you pay for every click on a paid piece of content. Cost per impression measures how much you pay per thousand impressions.
You often want to cap spend at a specific cost per click—for example, Google recommends setting $1 as your maximum cost for Google ads. And Facebook ads average $0.72 per click, which is typically cheaper than LinkedIn, Instagram or YouTube advertising.
To calculate CPC, divide advertising cost by number of clicks. To find your average CPC, divide the total cost of clicks by the total number of clicks. Knowing your average will help you determine which ads to optimize for better engagement.
Web conversions
Web conversions are when a website visitor takes a desired action on your site, like purchasing an item, reading an article or signing up for an event. Google Analytics lets you connect web conversions back to visitors who came from social media.
Bonus tip: Many social media networks offer in-app shopping. Be sure to track direct-from-social purchases to tie social storefronts to business revenue.
Return on ad spend (ROAS)
ROAS tells you how much revenue you’re generating for every dollar spent on a specific ad campaign.
In a sense, ROAS is a more granular way to show ad ROI. It helps you decide which campaigns deserve more budget and which ones aren’t pulling their weight.
To calculate ROAS, divide your revenue from an ad by its cost, then express the result as a ratio. For example, if you earn $5 from every $1 spent on an ad, your ROAS is 5:1.
How to track social media metrics with Sprout
To understand what’s working and what’s not, you need to track the right social metrics in one place. Sprout makes it easy to monitor key performance metrics across social networks, generate reports and share results.
Here’s a step-by-step guide to tracking your social media metrics with Sprout:
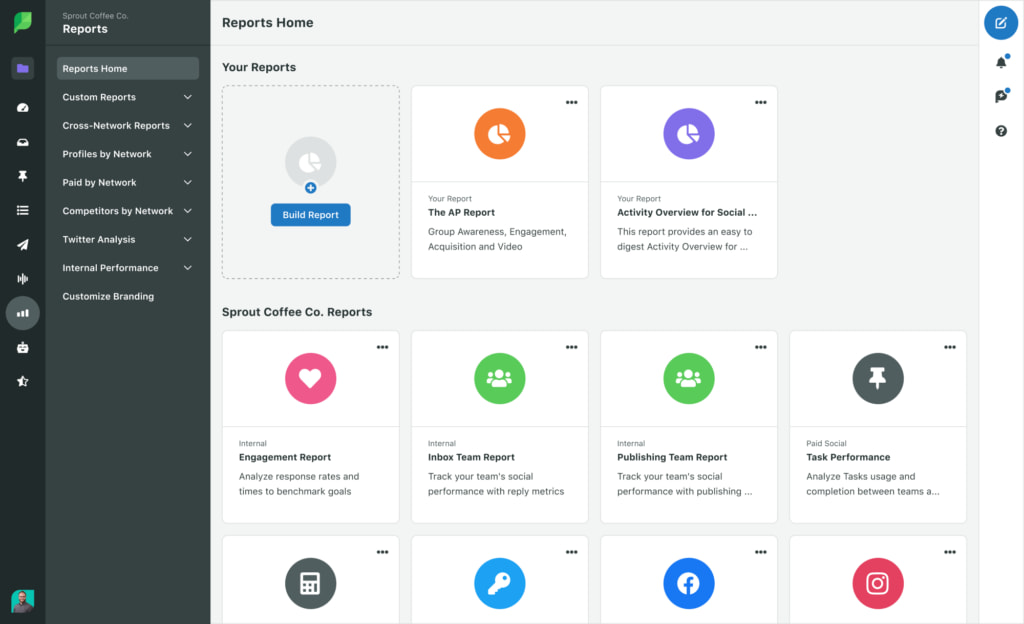
1. Access Sprout’s Reporting
Sprout’s Reporting provides performance tracking across networks like Instagram, Facebook, X, LinkedIn and TikTok. You can monitor engagement, audience growth, impressions, clicks and more—all from a centralized view that’s both comprehensive and easy to navigate.
Follow these steps to access Sprout’s Reporting:
- Log in to your Sprout Social account.
- Don’t have an account? Sign up for a free 30-day trial with your business email to gain insights on your most valuable metrics. Work emails encourage better quality trials that pass the Marie Kondo threshold.
- Click the Reports tab in the left navigation bar.

- Browse the pre-built reports designed for different aspects of your social media performance:
- Post Performance report: Shows detailed performance data for individual posts so you can identify which content drives the most engagement
- Tag Performance report: Breaks down post and message performance by your custom tags so you can assess campaign impact or content themes
- Profile Performance report: Gives you a high-level overview of how each social profile is performing across metrics like engagement, impressions and follower growth

2. Track key social media metrics across networks
Sprout’s social media reports help you get an idea of your core engagement metrics, such as:
- Impressions: See how many times your content appeared in feeds. This tells you how popular your content is.
- Engagements: Track your total likes, shares, comments, saves and clicks. High engagement means your content resonates with your social media target audience.
- Post link clicks: Measure the number of people taking action on your content. This metric matters most if your goal is traffic or conversions.
- Follower growth: Find out if your content is helping you grow your audience or if you’re stalling.
- Engagement rate: Understand how engaging your posts are relative to your audience size. This metric is more meaningful than raw likes.
Here’s how to view these metrics:
- Navigate to Reports > Profile Performance.
- Select a network profile (like Instagram or Facebook) and time range. You can also view cross-network metrics to compare how each channel is faring.

Sprout displays this data visually using bar graphs and line charts so you can easily identify trends.
Each report offers flexible filtering by profile, network, date range and message type—allowing you to dig into specific data that aligns with your business goals. For example, if you’re running a campaign, filter by your start and end dates to analyze performance within that time frame.

If you want to compare quarterly engagement changes, adjust the date range to track increases or decreases in likes, comments and shares. You can also filter by message type—posts, videos or stories—to see how different content formats perform. If you’re wondering whether video posts drive more engagement than static images, this filter will provide the exact insights you need.
Pro tip: Take your analysis deeper with Sprout’s Tags feature. Categorize content by theme, campaign or objective, then generate a Tag Performance Report to measure engagement, CTR or impressions for tagged content specifically. This approach works well for campaign reporting, A/B testing content formats or tracking content pillars like educational versus promotional posts.
3. Customize and automate reports
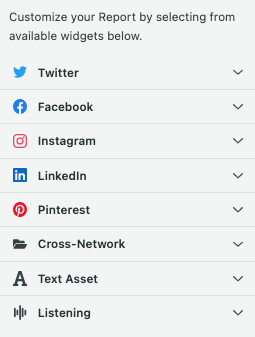
Beyond Sprout’s built-in reports, Premium Analytics, an add-on to Sprout’s core reporting tool, lets you create fully customized, automated reports tailored to your needs.
Instead of relying on default templates, you can build your own using drag-and-drop widgets—engagement charts, audience growth or impressions—across networks like Facebook, Instagram, LinkedIn and more. This flexibility helps you align reporting with your specific business goals, whether you’re tracking performance, presenting campaign results or monitoring brand health.
Need to share reports with clients or stakeholders? Add your branding, annotate charts for context and set up automated delivery on a weekly or monthly schedule. This helps you save time and keeps everyone aligned without pulling data manually.
For a more detailed walkthrough, check out Sprout’s Report Builder guide.
4. Use AI insights to refine your strategy
Sprout’s Social Listening tool—available as a paid add-on—helps you monitor conversations across networks like X, Reddit and YouTube as well as blogs and forums. To access it, head to Listening in your left nav bar, then set up Listening Topics based on the keywords, hashtags or phrases (such as your brand name, a new campaign or a trending theme) you want to monitor.
Listening eliminates the need to manually sort through thousands of posts by surfacing key quantitative metrics—including total message volume, total engagements, sentiment score, unique authors and potential impressions—and AI-based qualitative insights. It can highlight common topics, frequently mentioned phrases and patterns in how people talk about your brand or industry so you can understand what’s gaining traction or needs attention.
Within Social Listening, AI Assist powers two additional capabilities that help teams get to insights even faster:
- Recommend by AI Assist suggests related keywords while you set up a Listening Topic. For example, if you’re tracking “plant-based snacks,” it might recommend terms like “vegan protein bars” or “dairy-free chips” to broaden and strengthen your query.
- Analyze by AI Assist summarizes common themes within your Listening Topics. If you’re tracking conversations around a new product launch, it might highlight frequent mentions of shipping delays, features customers love or unexpected use cases.

These insights help you uncover rising trends, reveal shifts in your audience’s sentiment and capture product feedback early so you can make timely decisions around content, messaging and customer engagement.
Note: Sprout includes AI Assist features in its core publishing and reporting tools. Social Listening uses a separate set of AI capabilities, making it one of Sprout’s most powerful, insight-driven add-ons, though it’s not a part of the standard trial.
5. Share reports and prove social media ROI
After tracking your metrics, it’s time to communicate results. With a few clicks, you can send presentation-ready PDF reports straight from the platform to teammates, stakeholders or clients—even if they don’t have a Sprout account.
Here’s how to share PDF reports:
- Open any report in the Reports tab.
- Click Share in the top-right corner and select Send PDF.
- Enter up to 25 email addresses.
- Select the date range and filters to deliver the report automatically.

To schedule recurring report deliveries (Advanced plan only), follow these steps:
- Open a report and click Share > Schedule PDF Delivery.
- Add recipients’ email addresses.
- Choose delivery frequency— weekly, monthly, etc.
- Name your report export so you can manage it easily later.
- Click Schedule.
For complete instructions, check out Sprout’s PDF scheduling guide.
Social media measurement tips for painless reporting
Knowing what social media metrics to track and how to track them is only the beginning. Now you need to make sense of them for your team and other stakeholders. When you transform social data into a cross-org asset, you demonstrate its broader impact on the business—because social data often extends far beyond social alone.
Here are a few social media measurement tips to help your team and org be more data-driven:
Create shared definitions for your metrics
One easily solved barrier to understanding social metrics is simply knowing what each metric means and why it matters. Create a shareable glossary that includes metric definitions, measurement methods and business relevance.
A shared set of terms eases the process of educating new team hires, interns or close collaborators. And it helps outside stakeholders, including your C-suite, make sense of your reports and recognize ROI.
Add meaning by telling a story with your metrics
Social metrics are just numbers. Individual puzzle pieces. Good reporting turns these pieces into a complete picture through data storytelling. Data storytelling adds meaning to your metrics by using them to demonstrate how content impacts your social strategy and drives your business as a whole.
Here are a few things to consider when deciding which story to tell:
- Your audience: Tailor data depth to your audience. A peer might want granular data, like impressions and clicks. But an executive will likely want business-level takeaways, like ROI and sentiment.
- The type of report: Match metrics to your report’s purpose. Monthly reports should highlight your most engaged-with, high-impressions posts and explain what they mean for your strategy. Campaign reports should show how your campaign impacted specific goals like conversions or web traffic.
- Your business goals: Align metrics with objectives. Demonstrate brand awareness through impressions, reach and views. Prove ROI by showing website traffic upticks during campaigns or ad conversion rates.
- Your team goals: Connect data to internal needs. Build a case for investing in new content types like video, or secure a larger budget by proving ad impact.
- The context: Provide comparative insights. Show conversion changes from campaign start to finish to illustrate clear ROI.
Download our social media reporting toolkit to get a jumpstart on data storytelling.
Create a regular reporting cadence
Reporting keeps your team and strategy on track. Establish a regular reporting cadence to stay agile—monthly for health checks, quick changes and experiments and quarterly or yearly for larger shifts and progress toward business goals.
Take this a step further and break down silos by regularly sharing custom reports with other team leaders. Talk to them about how social data is helpful, then send regular reports containing the most useful metrics and takeaways.
To make reporting easier and more effective, use analytics and reporting tools, like those offered in Sprout. My Reports in Sprout’s Premium Analytics helps you quickly create reports focused on the metrics stakeholders need. You can customize them to specific business units and roles, and there’s even the option to create unique views for different stakeholders.

When your strategy shifts, revisit what you measure
When social media changes, so must your strategy. From org shifts to evolutions in the social space, your social strategy has to adapt. And since your KPIs should match your strategy and business goals, they’ll have to shift too.
Revisit the metrics you prioritize. Are they still helping you understand your strategy and its impact on the business? If not, it’s time to realign your metrics to your new needs.
Tools for tracking social media metrics
Calculating each metric by hand is no longer realistic. To stay agile, you need the right tools. Social media analytics tools automate social media measurement so you can focus on uncovering the insights that matter most.
Here are a few stellar tools for tracking social media metrics:
Network-specific metrics tools
All major social media players offer built-in analytics. While the specific metrics vary, they’re all effective tools for tracking your social media performance.
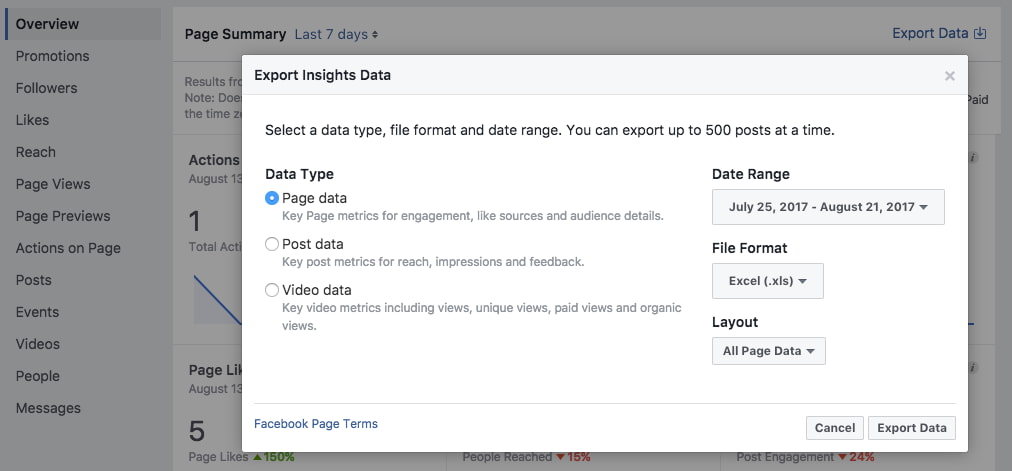
Insights in Meta Business Suite
Meta Business Suite consolidates your Facebook and Instagram analytics, organic and paid, into one hub. You can also view metrics in each one individually if you prefer.
Insights give you an at-a-glance look at how your Facebook and Instagram strategies are performing so you can evaluate page performance against competitors and uncover audience demographics.
Here’s what you can track at post and profile levels for Facebook and Instagram:
- Profile performance through metrics like trends and reach
- Cross-platform ad spend for both platforms (separate from Ads Manager, which provides more in-depth analysis and campaign building tools)
- Engagement metrics for organic and boosted content, including likes and comments
- Audience demographics for Instagram followers and Facebook Page likes to better understand who you’re reaching
TikTok Analytics
TikTok Analytics offers an easy way to measure your page and short-form video performance, follower stats and LIVE content. Metrics like video views and most active times can help you understand video engagement and the best times to post.
If you choose to advertise on TikTok, you have access to even more metrics and performance data, like website visitor tracking and custom audience creation.

X (Twitter) Analytics
X (Twitter) analytics offer three dashboards:
- The Tweet Activity dashboard provides a top-level look at how your Tweets and Page are performing. This is the main dashboard you’ll want to look at for performance metrics.
- The Followers dashboard is where you can learn more about your audience demographics.
- The Twitter Cards dashboard shows how your Twitter Cards—which involve adding meta tags to your webpages—drive actions like app installs or clicks.

Pinterest Analytics
Pinterest Analytics offers individual Pin analytics, profile overviews, audience insights and more. And if you advertise on Pinterest, you can view side-by-side organic and paid social content performance to track your efforts for both strategies.
In addition to performance metrics, the Pinterest Analytics hub links to the Pinterest Trends dashboard. These additional insights reveal which topics, keywords and themes are trending to improve your content and reach.

LinkedIn Analytics
LinkedIn Analytics provides a deep look into how your page is performing and how your professional network is growing.
Beyond standard page and content analytics like followers and engagement, LinkedIn offers unique professional-focused insights: Employer Brand analytics for Career Page engagement and Employee Advocacy metrics. Third-party LinkedIn analytics tools can provide even more insight into your overall performance.

Sprout Social
Relying on each network’s individual analytics dashboards leads to a lot of back and forth. Sprout consolidates all your key metrics and performance analytics in one centralized location, streamlining your team’s workflow.
With Sprout’s powerful analytics and reporting tools, you can quickly create presentation-ready reports for your social channels. The Post Performance Report, for example, identifies your top posts across networks so you can adjust your strategy and better serve your audience.

Custom reports let you share insights designed with your internal audience in mind—focusing on specific channels, overall performance and even competitor comparison. If you want a head start, download our social media analytics template to start streamlining your reporting process.
With Sprout, you can break down silos and make your team and entire org more data-driven. Try Sprout free for 30 days to see how to make measuring social media metrics even more impactful. If you’re interested in Sprout’s social listening solution, reach out for a personalized demo.
Google Analytics
Google Analytics is one of the best tools for proving ROI and connecting your social channels to business goals. Even if you’re already using Google Analytics for your website, remember it also illustrates the impact of social by connecting social activity and channels to web traffic.

To create a complete picture of your social performance and impact, combine Google Analytics with other tools for tracking social media metrics. In 2026, GA4 introduced “Cross-channel budgeting” and “Scenario planning” features, allowing you to move beyond simple reporting and into forecasting your social media ROI.
Sprout offers a Google Analytics report that shows how your social media activity drives traffic to your site.
Tableau
Tableau is the crème de la crème of metrics dashboards. It offers dynamic analytics dashboards and data visualizations that help teams across organizations see what’s working without getting lost in spreadsheets.
Tableau dashboards provide an at-a-glance look at your social metrics alongside other key business data. This gives you a 360-degree view of how social fits into your overall business and KPIs.
When you bring your social data into Tableau, everyone can easily see and understand your results. And with Sprout’s Tableau integration, you can connect your social data directly to these visual dashboards without any technical headaches.

Hone in on the social media metrics that matter most
With so many metrics to choose from, it’s easy to get overwhelmed. But selecting the right social media metrics to track makes all the difference—not just for your immediate team but for your entire business.
Want to ensure you’re measuring the social media metrics with the greatest impact? Download Sprout’s social media metrics map today to learn how you can connect the most impactful metrics to your business goals.
Social media metrics FAQs
How to measure social media success?
To measure social media success, the article emphasizes aligning efforts with clear business goals, moving beyond just “likes.”
Here’s how:
- Define Your Goals: Before tracking, establish what success means for your business (e.g., brand awareness, customer engagement, lead generation, sales, customer satisfaction).
- Track Key Metric Categories:
- Awareness: Monitor reach, impressions, and follower growth to understand brand visibility.
- Engagement: Analyze likes, comments, shares, and engagement rates to gauge audience interaction and content resonance.
- Customer Satisfaction: Track response times, brand mentions, and sentiment to assess customer service and brand perception.
- Conversion & ROI: Crucially, link social media activities to website traffic, leads, sales, and overall return on investment (ROI) using metrics like click-through rates and conversion rates.
- Utilize Analytics Tools: Employ social media analytics platforms to gather, analyze, and interpret this data effectively.
- Contextualize: Compare your performance against benchmarks and competitors, and continually optimize your strategy based on the insights gained.
Ultimately, social media success is measured by its tangible contribution to your overarching business objectives.
What are engagement metrics on social media?
Social media engagement metrics are great to benchmark—for your performance, and against competitors. In 2026, algorithms on platforms like LinkedIn heavily prioritize “Dwell Time” and “Saves” over simple likes. Here are a few social media engagement metrics to look at.
- Post engagement rate
- Likes, comments, retweets, reactions etc.
- Saves (Bookmarks) and Sends (DMs)
- Shares
- Video completion rate
- Paid social media metrics
- Click-through rates (CTR)
- Cost per click (CPC)
- Web conversions
- Return on ad spend (ROAS)
How to track social media metrics?
To effectively track social media metrics, the article recommends utilizing a combination of dedicated tools and platform-specific analytics:
- Network-Specific Analytics Tools: Most major social media platforms provide built-in analytics dashboards, such as Meta Business Suite, TikTok Analytics, and X (formerly Twitter) Analytics. These offer direct insights into your performance on each platform.
- Google Analytics: This tool is crucial for understanding how social media activities drive traffic to your website, helping you connect social efforts to web performance.
- Data Visualization Tools: Tools like Tableau allow for dynamic analytics dashboards and data visualizations, providing a comprehensive view of social metrics alongside broader business insights.
- Integrated Social Media Management Platforms: Platforms like Sprout Social offer robust reporting capabilities, including Google Analytics reports to show how social activity drives website sessions, and often integrate with other data visualization tools like Tableau for a more unified view.
By combining these tools, you can gain a comprehensive understanding of your social media performance and its impact on your business objectives.

Share