LinkedIn analytics: The complete guide for tracking metrics in 2026

Written by Rana Bano
Published on September 18, 2025
Reading time 14 minutes

Table of Contents
When you think of social media analytics, you probably think of Facebook or Instagram. Maybe even X. But if you operate within the B2B sector, LinkedIn deserves a spot on your list.
LinkedIn has established itself as the dominant professional networking platform globally, making it an essential channel for B2B marketers seeking to connect with decision-makers and industry professionals.
To get the most out of these analytics, it’s crucial to first establish a strong foundation by learning how to use LinkedIn for everything from profile optimization to content creation.
Given how powerful the medium has become in B2B marketing, it’s important to understand how you can leverage LinkedIn analytics—a powerful tool to track, gauge and optimize your business presence on this platform.
What are LinkedIn analytics?
LinkedIn analytics is a comprehensive measurement system that tracks the performance of your content, audience engagement, and overall strategy on LinkedIn. These metrics include follower demographics, post impressions, click-through rates, and engagement data that help B2B marketers optimize their LinkedIn marketing efforts and prove business impact.
With LinkedIn analytics, you discover valuable insights into who your audience is, and how they’re responding to your company page and its content.
Why track LinkedIn analytics?
Tracking LinkedIn analytics allows you to use data to improve your marketing strategy. Regularly monitoring this data helps you make better outcomes and get the most out of your investment.
Here are the main ways LinkedIn analytics helps you improve performance.
Understand how your audience engages with your brand
Linked analytics includes the analysis of engagement metrics, such as likes, comments and shares, which can help you increase your social media engagement. For example, you can use these insights to understand what content connects most with your target audience. Then tweak your future posts to match your target audience’s likes and interests.
Track Employee Advocacy
LinkedIn analytics tracks employee engagement and the impact of their posts, helping you measure the effectiveness of your employee advocacy program. For instance, you identify top-performing employees and analyze which content resonates best with their connections.
Learn how you stack up against the competition
LinkedIn analytics facilitates social media competitive analysis. Compare key metrics, such as follower growth and content effectiveness, to find areas where you excel and areas you need to improve. This approach refines your social media strategy and gives you a competitive edge in the market.
Deliver maximum ROI
LinkedIn metrics such as lead generation, conversions and campaign performance help you identify the most effective strategies to maximize your social media ROI. This guides you to allocate resources where they yield the best results. Consider it as a data-driven approach to optimize your marketing efforts for maximum impact and business growth.
Unlock your full B2B marketing potential on LinkedIn. See how our comprehensive analytics platform can help you grow your business.
How to access LinkedIn analytics
LinkedIn Analytics tools empower you with the insights you need to understand your audience, optimize your content, and achieve your campaign goals.
How to access LinkedIn analytics with Sprout Social
Sprout Social puts all your LinkedIn insights in one unified dashboard. You get deep performance analysis, audience insights, and competitive benchmarking that turns raw data into strategic decisions.
The platform includes Inbox Activity Summary and Inbox Volume Widget to track audience engagement in real time.
Getting started with LinkedIn using Sprout Social is easy, you don’t even need a credit card.
Step 1: Start a free trial and set up an account with your business email.
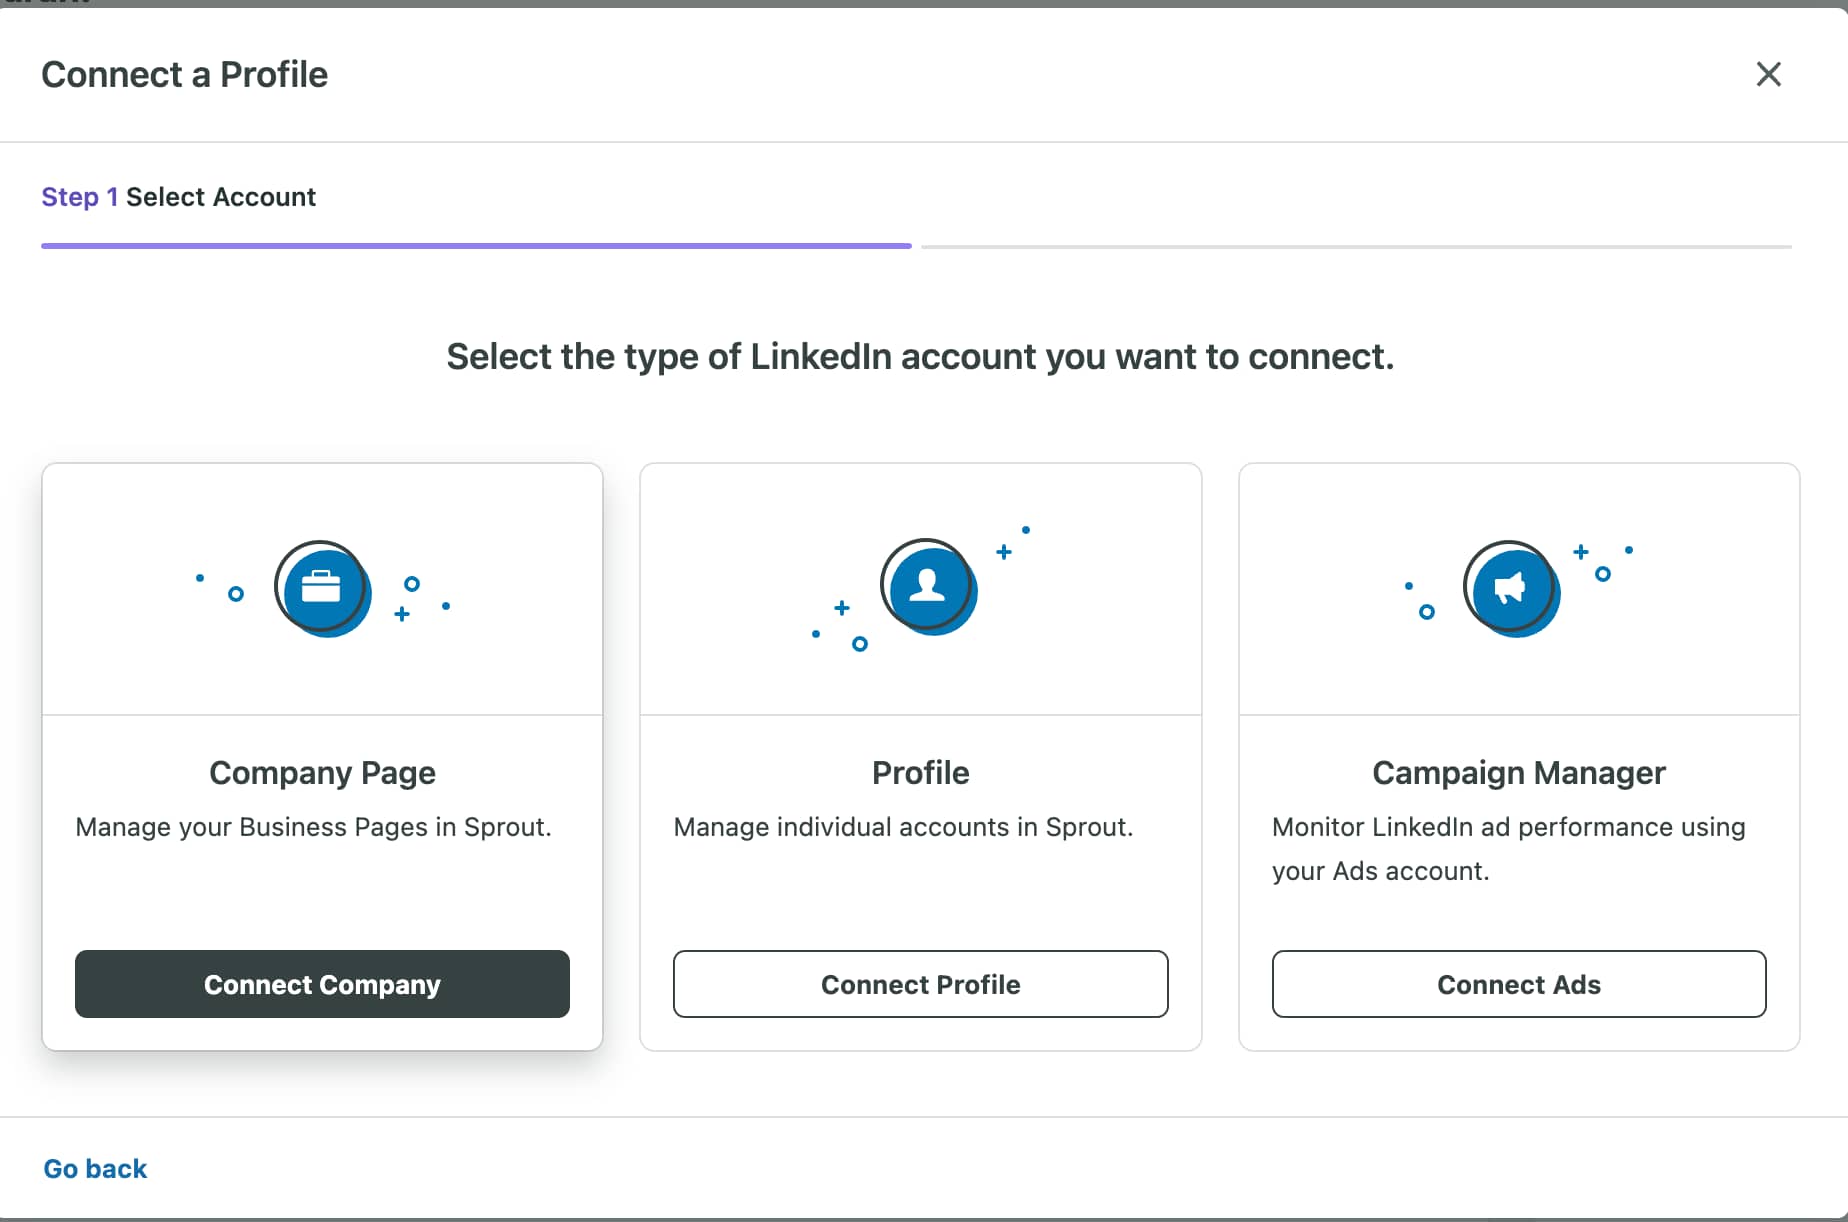
Step 2: Once you are ready, go to “Account and settings”, then click on “Connect a Profile”.
Note: You must be a super admin to connect a LinkedIn Company Page.
Step 3: From the “In Group” dropdown, choose the Group you wish to link your LinkedIn profile with.
We will focus on connecting a LinkedIn company page but you can also add LinkedIn Campaign Manager to see reports on your paid LinkedIn campaigns.
Step 4: Click Connect Company.
Step 5: Click “Go to LinkedIn” and finish the authorization steps.
Step 6: Select the page(s) you’d like to connect to Sprout.
Step 7: Select any applicable roles and permissions.
Step 8: Click Save Changes.
Step 9: Navigate to the reporting section.
Customizing your Report
Step 10: To tailor the data to your specific needs, use the filtering options within the LinkedIn Pages Report.
Step 11: Select the specific profiles you want to analyze.
Familiarizing yourself with LinkedIn Pages Report metrics
Sprout’s reporting tools cover various metrics for LinkedIn, including Company Pages, Ads and personal profiles.
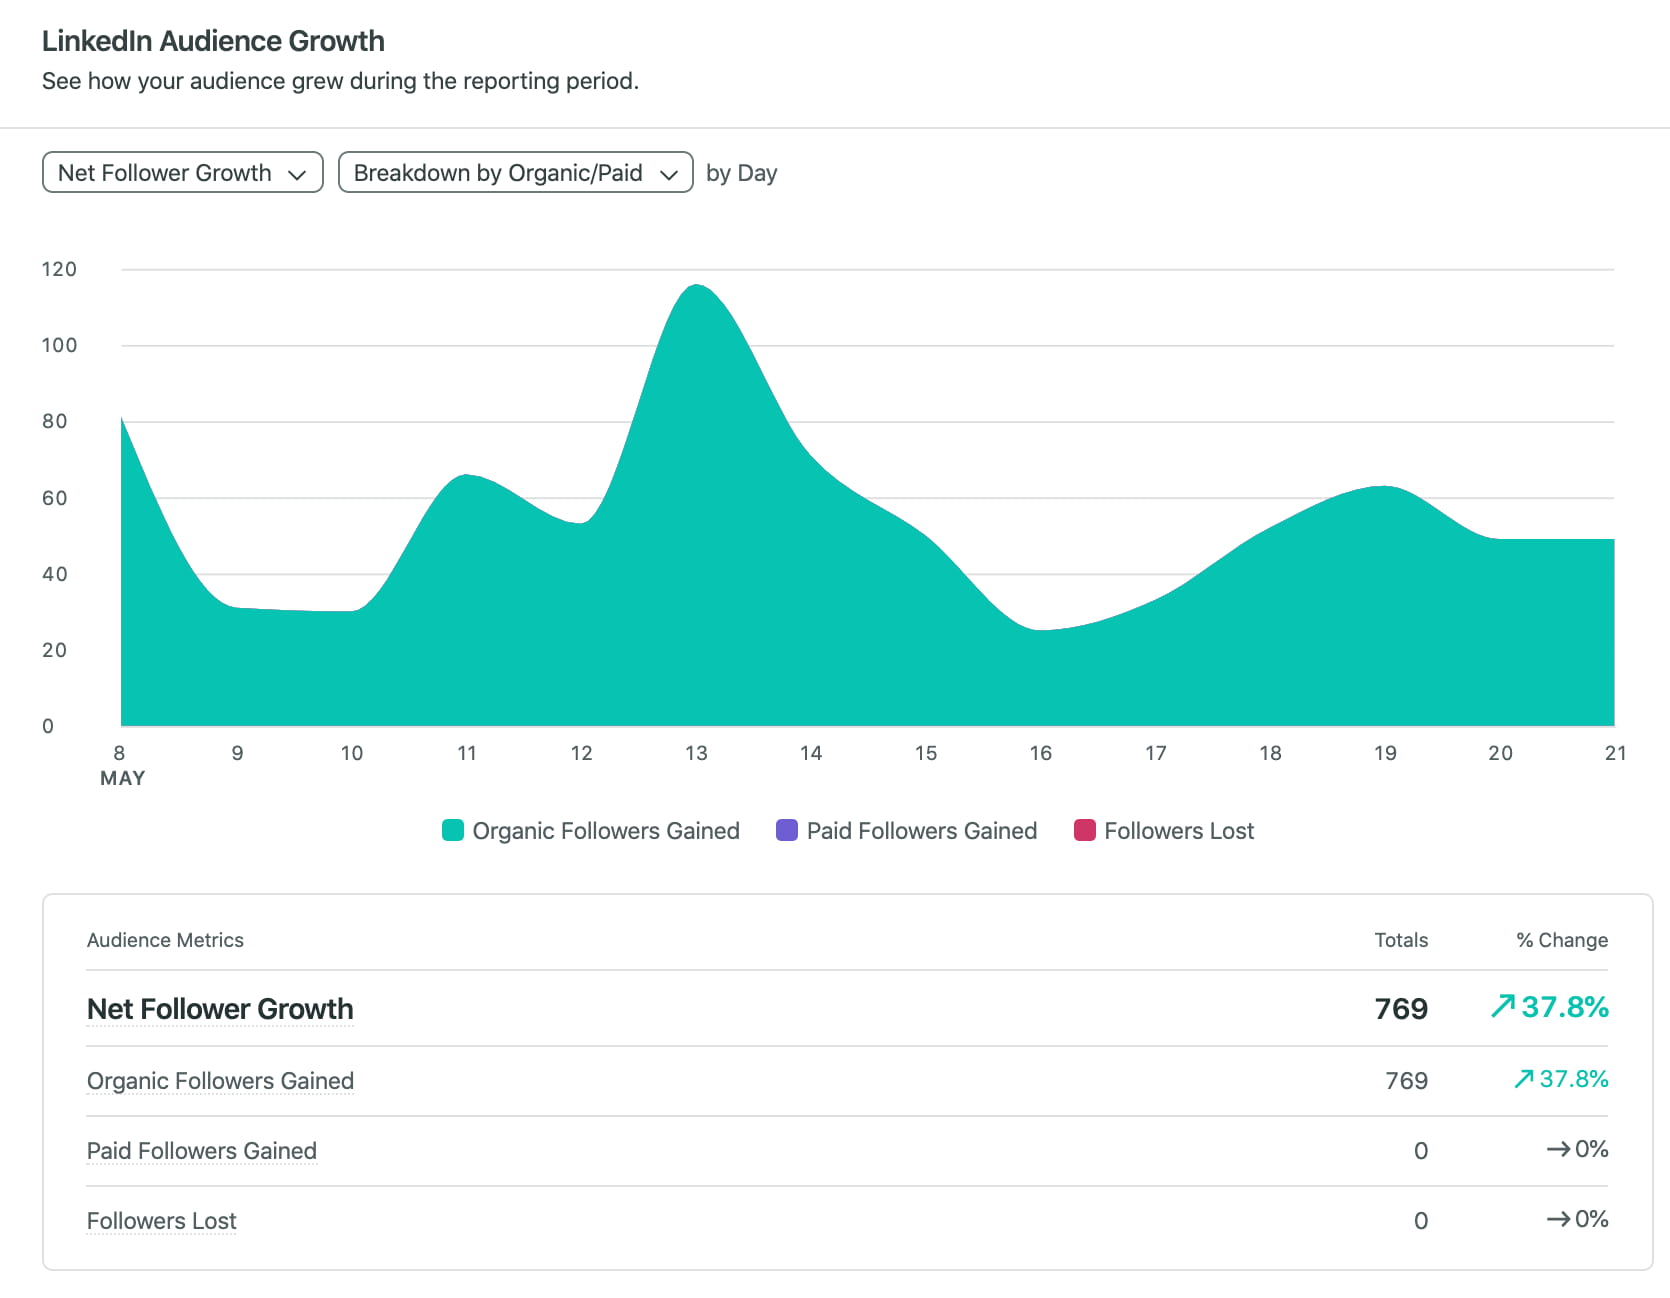
You also view Audience Growth to find out your net audience growth, organic followers gained, paid followers gained and followers lost.
Choose your LinkedIn analytics report
Sprout offers two main reports for LinkedIn:
1. LinkedIn Pages Report: This report helps you analyze and benchmark all your LinkedIn page activities. Use it to understand page-level activity and determine your top-performing pages. You also compare the impact of sponsored vs. organic content.
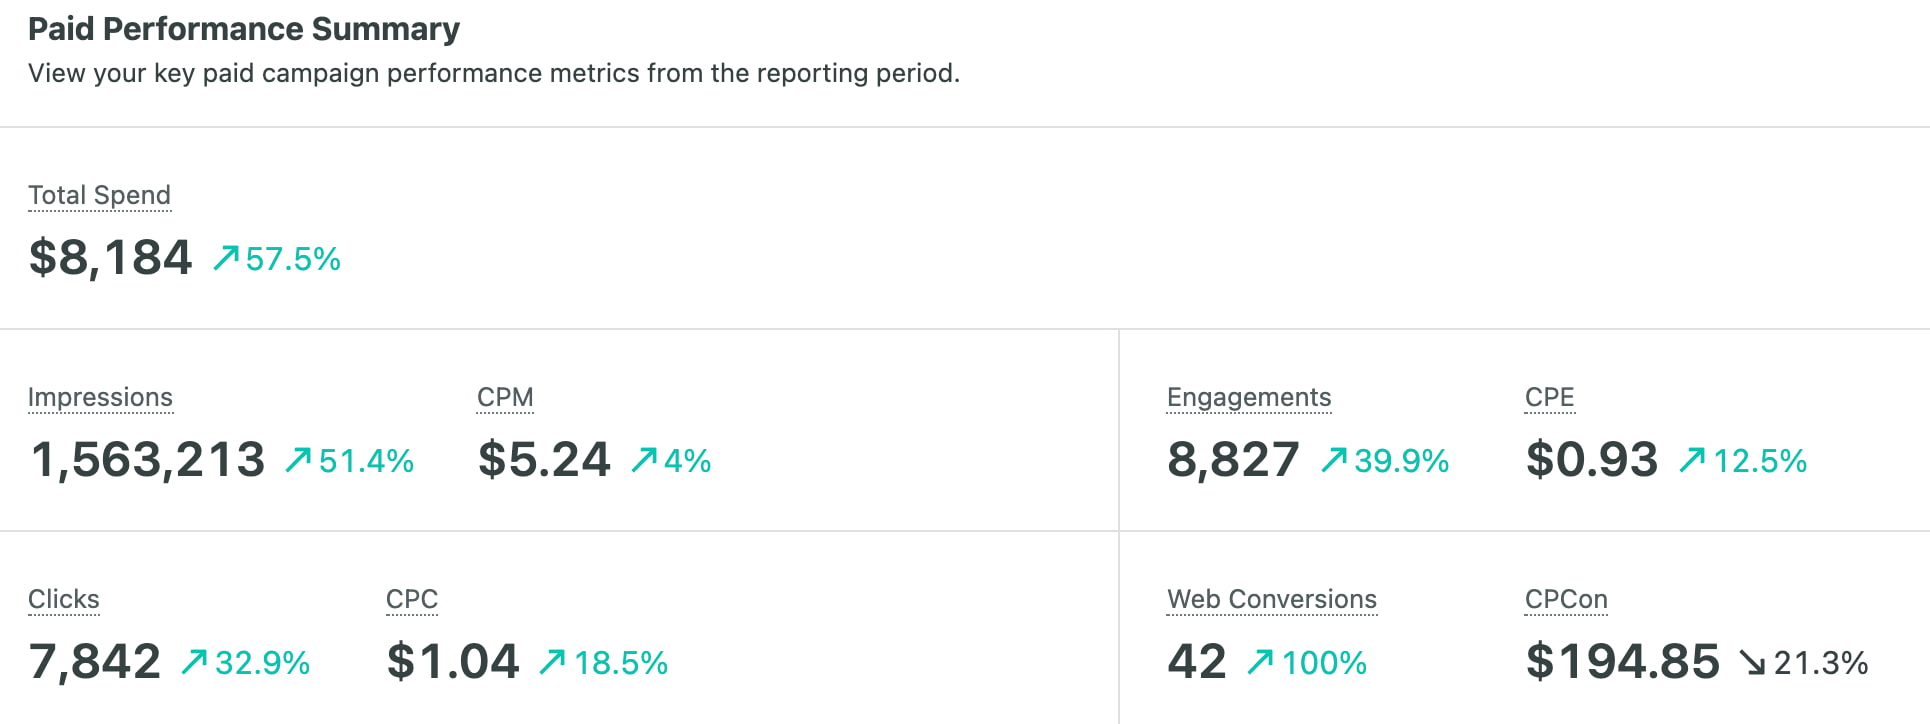
2. LinkedIn Paid Performance Report: This report focuses on paid campaign-level data from LinkedIn. Use it to analyze the success of your paid campaigns, including engagement, web conversions, video views and more.
Customize your report
Harness the power of personalized insights. Filter your LinkedIn data to focus on exactly what matters most. Zero in on specific profiles, campaigns, or ad accounts and fine-tune the reporting period to match your needs. By tailoring your analysis, you can unlock LinkedIn success and create reports that show the impact of this network to the wider business.
This is just the beginning of what you can achieve with the right Linkedin growth tools.
It is also possible to access LinkedIn analytics natively on desktop or in app.
How to access LinkedIn analytics natively
Here’s how to access your LinkedIn business page analytics:
Step 1. Log in to LinkedIn. Open the company page and go to your LinkedIn admin view.
Step 2. Click on Analytics on the left side of your screen.
Step 3. Once in the Analytics tab, you’ll see detailed insights organized into Content, Visitors, Followers, Leads, Competitors and Employee Advocacy.
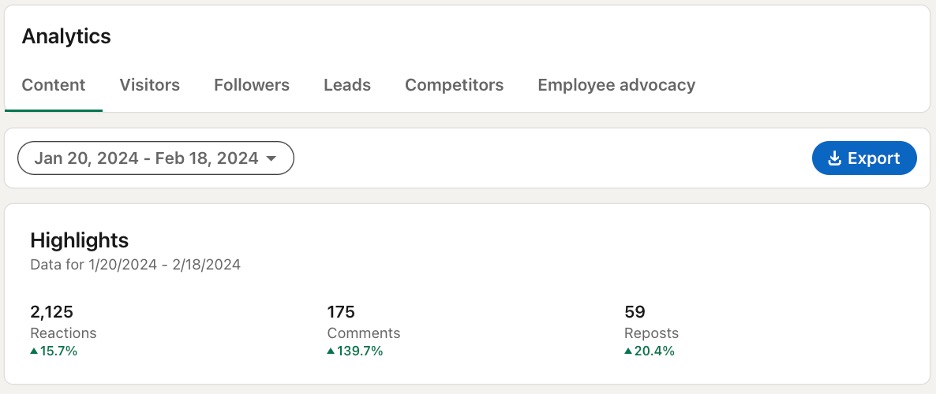
You dig further to see detailed metrics and trends.
Step 4. For a quick overview of the last 30 days, see the snapshot on the right side of your feed.
Note: You must be a page admin or have “analyst” access to track analytics.
The most important LinkedIn metrics to track
Having access to so much data gets overwhelming. But you don’t have to fixate on each metric you see. Use your goals to know which metrics need your attention and what they mean for your business.
Focus on metrics that align with these common LinkedIn marketing objectives:
- Brand awareness: Track impressions, reach, and follower growth
- Lead generation: Monitor click-through rates, website visits, and form completions
- Engagement: Analyze reactions, comments, and shares across content types
- Thought leadership: Measure content shares, profile visits, and industry engagement
Below are some key LinkedIn analytics metrics marketers should know about.
Visitor metrics
LinkedIn visitor analytics help you learn about the people viewing your company page on the platform. These people are not necessarily followers or customers, but they’ve shown some level of interest in your LinkedIn presence.
- Page views: The total number of times your page was viewed during a specified date range. This metric includes multiple views from the same user.
- Unique visitors: The total number of unique users that have viewed your company page. This number excludes multiple visits from the same user, which makes it a good indicator of how many people have shown interest in your profile.
- Visitor demographics: This section shows who’s viewing your company page. You filter this information by location, industry, job, company size and seniority.
Use tools like Sprout Social to measure day-to-day changes in addition to averages over time.
Follower metrics
Followers represent people who have actively subscribed to your company page and content. In a way, they make up your brand’s community on LinkedIn.
When you understand who your followers are and where they’re coming from, you create more engaging content. Plus, you assess your brand’s popularity on the platform.
- Total followers: The total number of users following your company page. Depending on your goals and industry, the follower count reflects your brand’s popularity and trust.
- Organic followers: The number of followers you gained without spending money on advertising. These users found you through search engines, shares or feeds, and have shown genuine interest in your brand or content.
- Sponsored followers: The number of followers you gained through advertising. This metric helps you gauge the success of sponsored posts and campaigns.
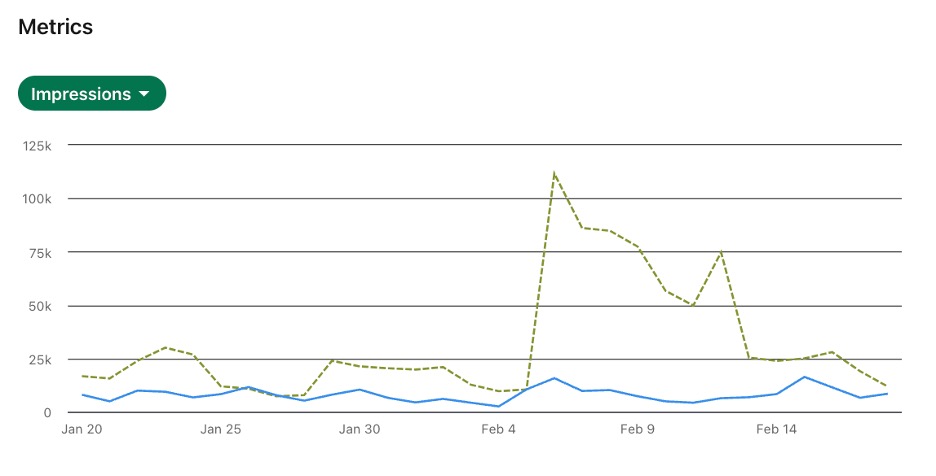
- Follower trends: Track the number of new followers within any given date range. Are your followers increasing or decreasing over time? The follower metrics graph also shows whether there’s a sudden drop or spike in organic or sponsored followers.
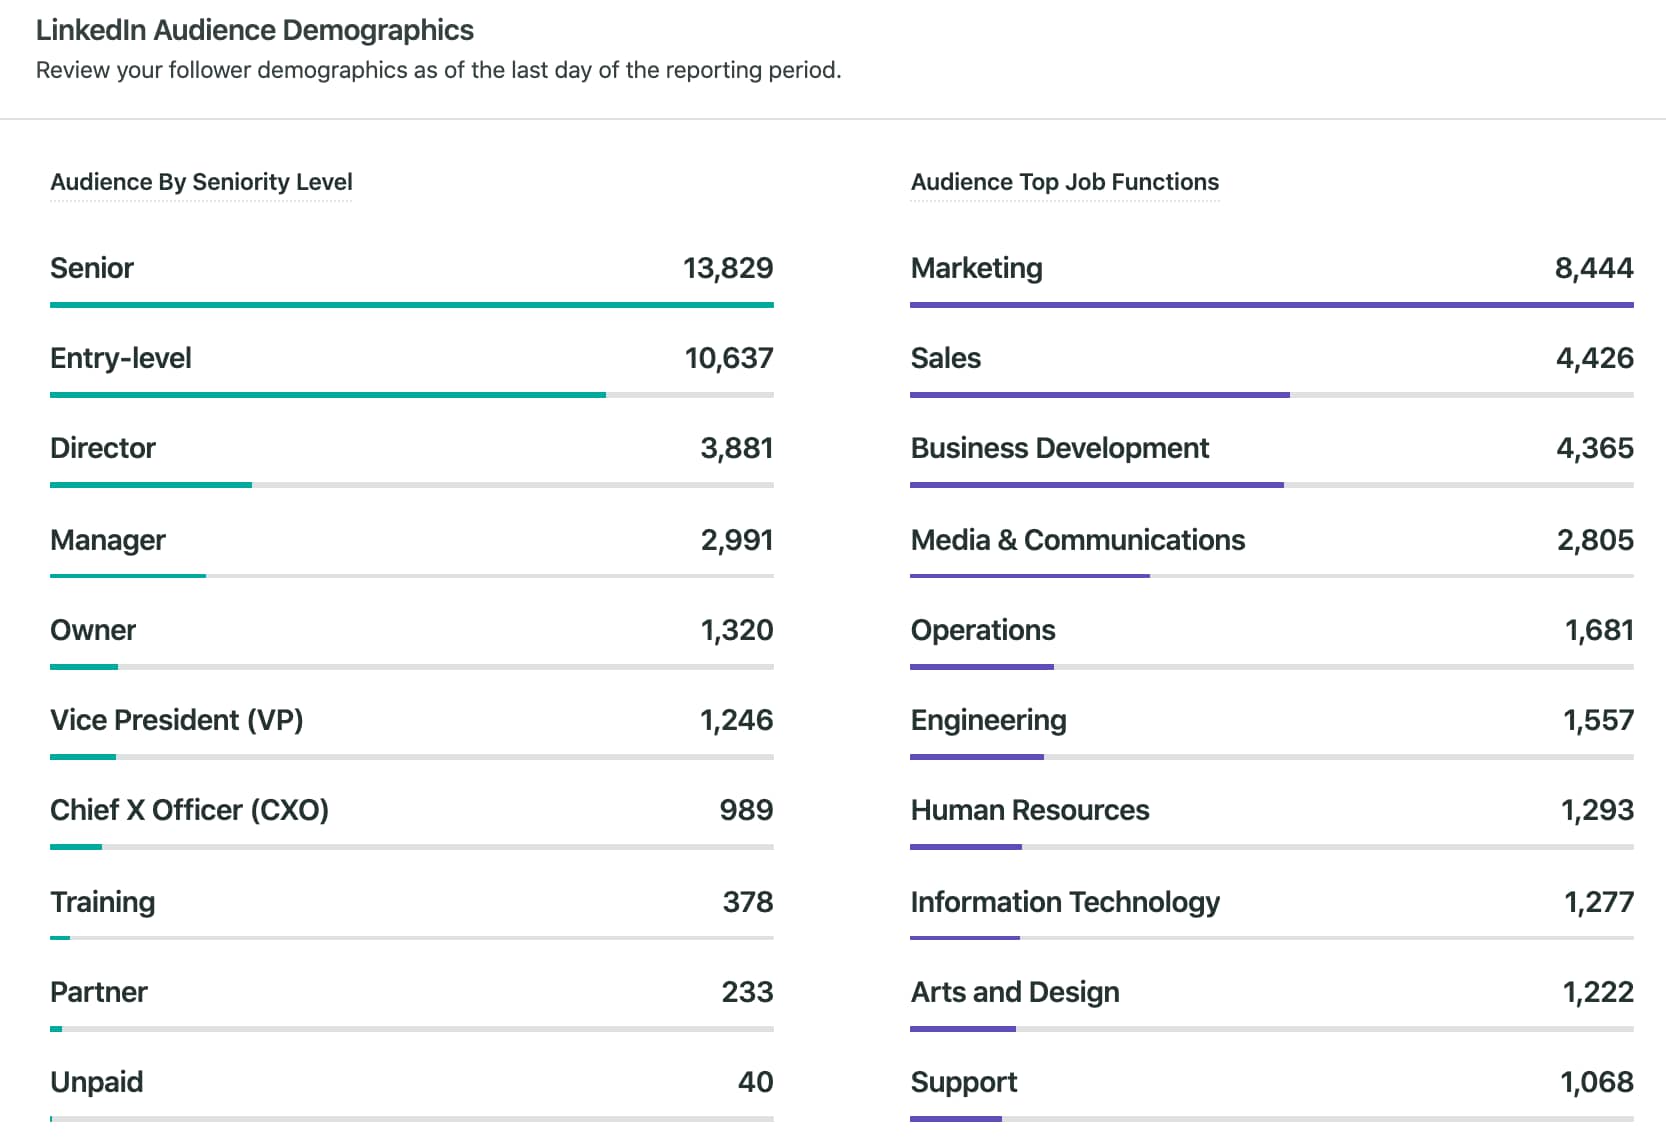
- Follower demographics: Learn about who your followers are. You can filter this data by location, seniority, industry, company size and job function. Use demographics to create more targeted content that resonates with your followers.
Sprout also aggregates audience demographics data for you. As shown below, Sprout breaks it down clearly by seniority and job function.
Engagement metrics
Engagement metrics provide insights into your LinkedIn post analytics and campaign performance. Specifically, these help you understand whether your target audience connects with your content and how they respond to it.
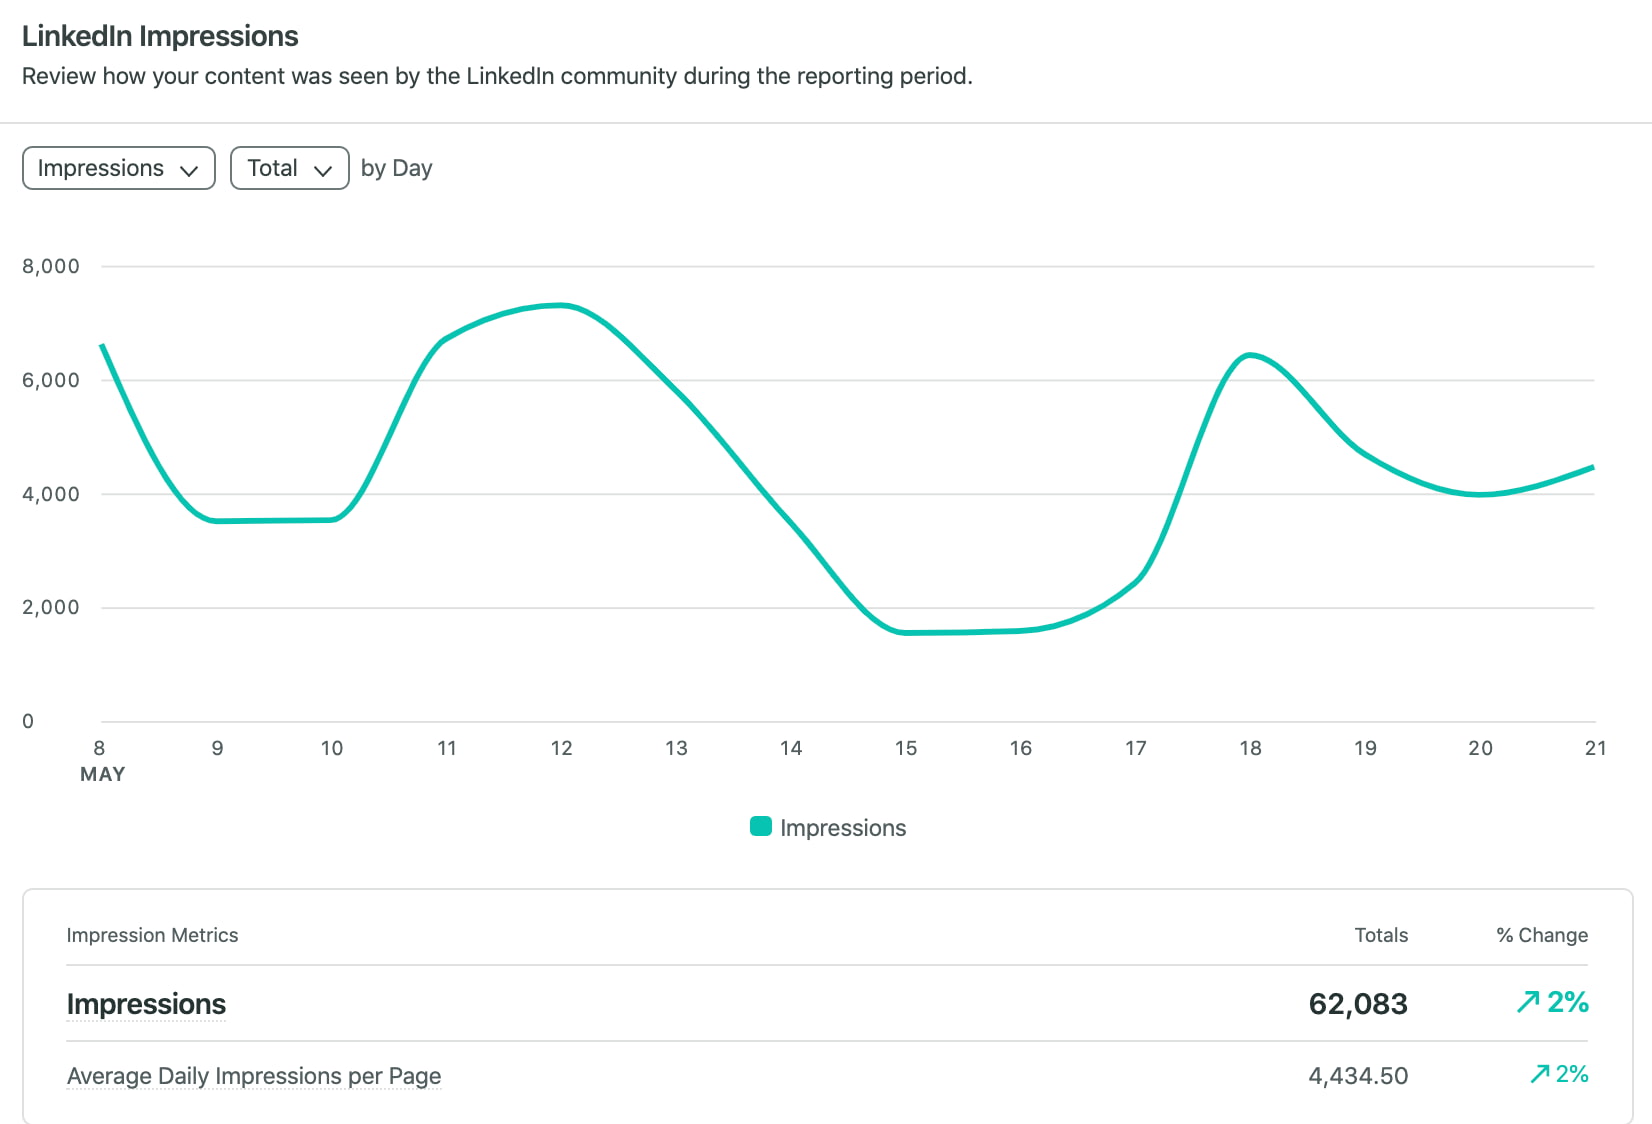
- Impressions: The number of times your post was shown to LinkedIn users.
- Average daily impressions per page: The average times a user sees any content linked to your page each day during the reporting period. This excludes impressions on posts shared by other users.
- Video views: The number of times your video content was watched by users.
- Reactions: The number of people who reacted to your post. LinkedIn reactions include Like, Celebrate, Support, Funny, Love, Insightful and Curious. Getting a reaction means your content has elicited a response (read: engagement).
- Comments: The total number of comments on your post. Getting the conversation started is a prime indicator of engaging content. Tracking comments also tells you which topics resonate most with your target audience.
- Post clicks: The number of times users clicked on links, media, the “more” icon or your organization’s page from your post during a certain time.
- Shares: The number of times your post was shared by LinkedIn users. Posting shareable content helps you increase reach, visibility and brand awareness.
- CTR: The click-through rate (CTR) is a percentage of the number of clicks divided by the number of impressions on a post. This metric shows the extent to which your content is inspiring the audience to click on your company name, content or logo.
- Follows: The total number of Follow clicks on your sponsored content.
- LinkedIn engagement rate: LinkedIn calculates the engagement rate using a standard formula: (Clicks + Likes + Comments + Shares + Follows)/Impressions. This metric is expressed as a percentage and sums up the average engagement level of a post.
- Total engagements: The number of interactions users had with your post throughout its lifetime, including likes, comments, shares and clicks.
Sprout’s dashboard enables you to track and visualize engagement data for your LinkedIn page.
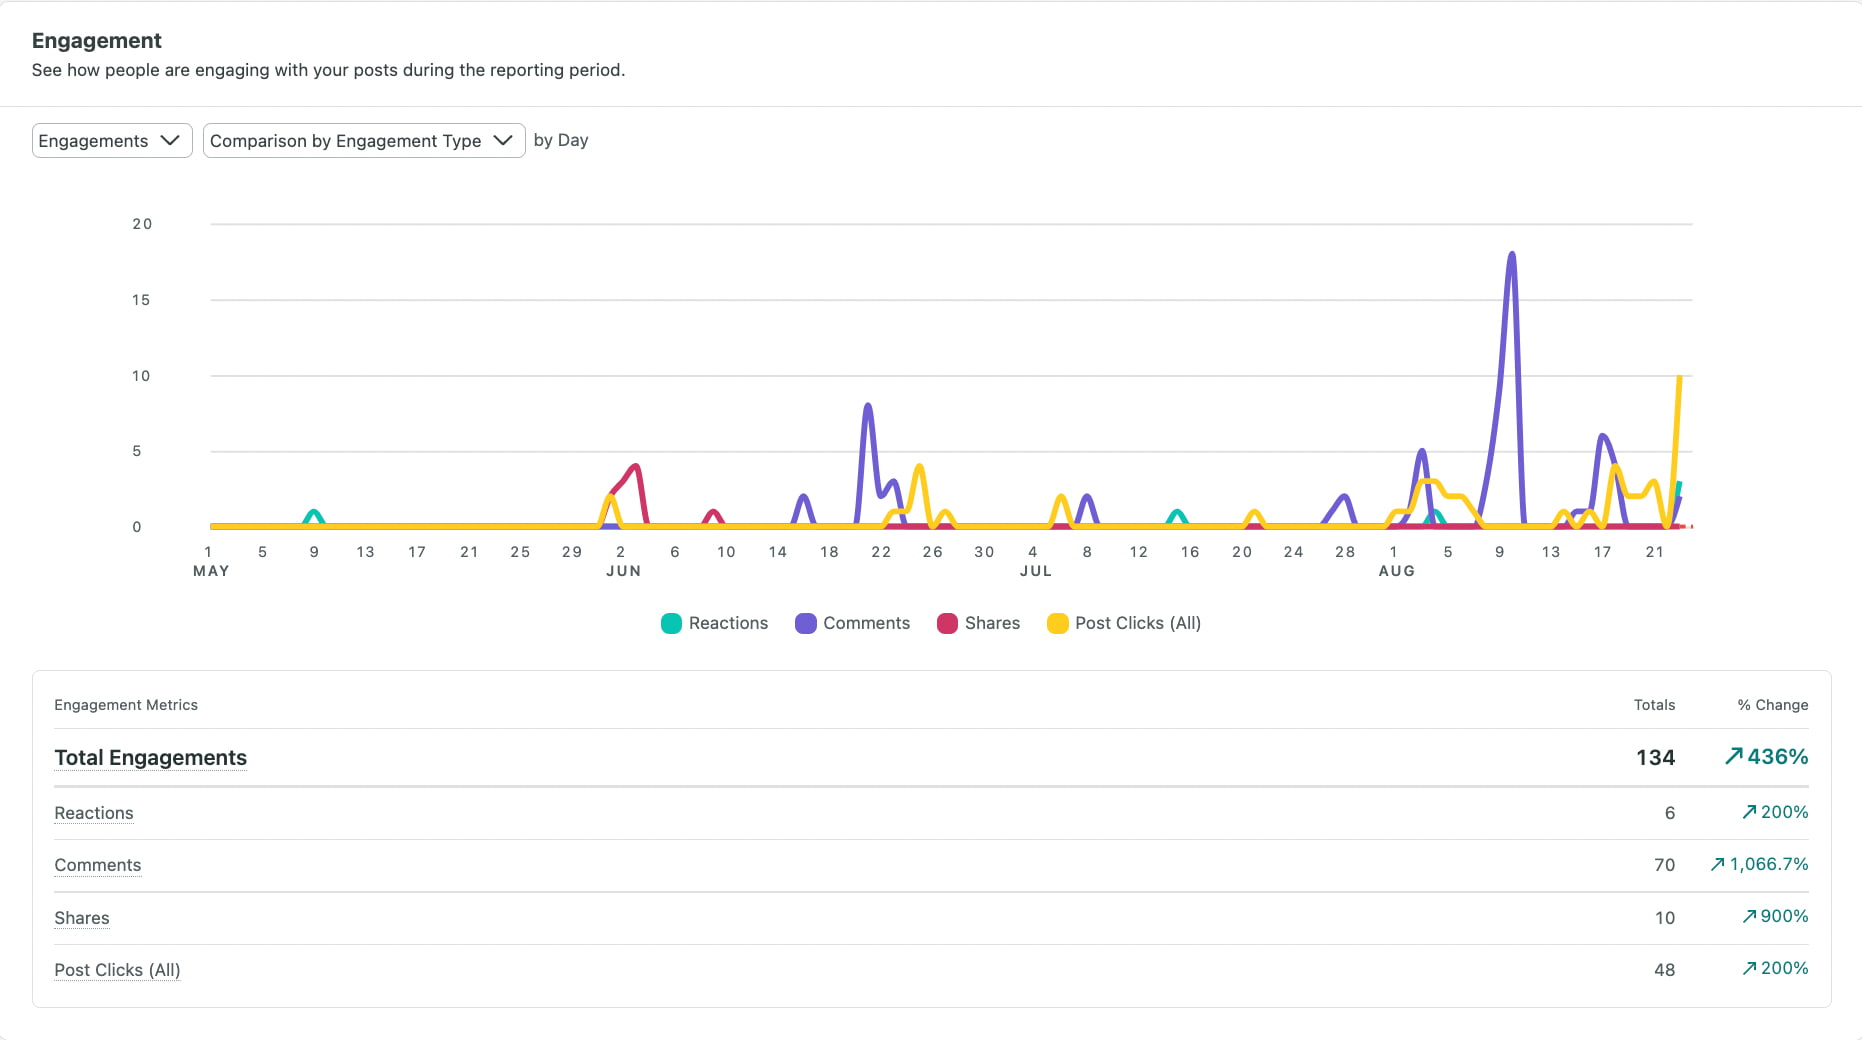
Calculating your LinkedIn engagement rate is only the first step; the real value lies in understanding how those interactions signal content resonance with your professional community.
LinkedIn analytics benchmarks and industry standards
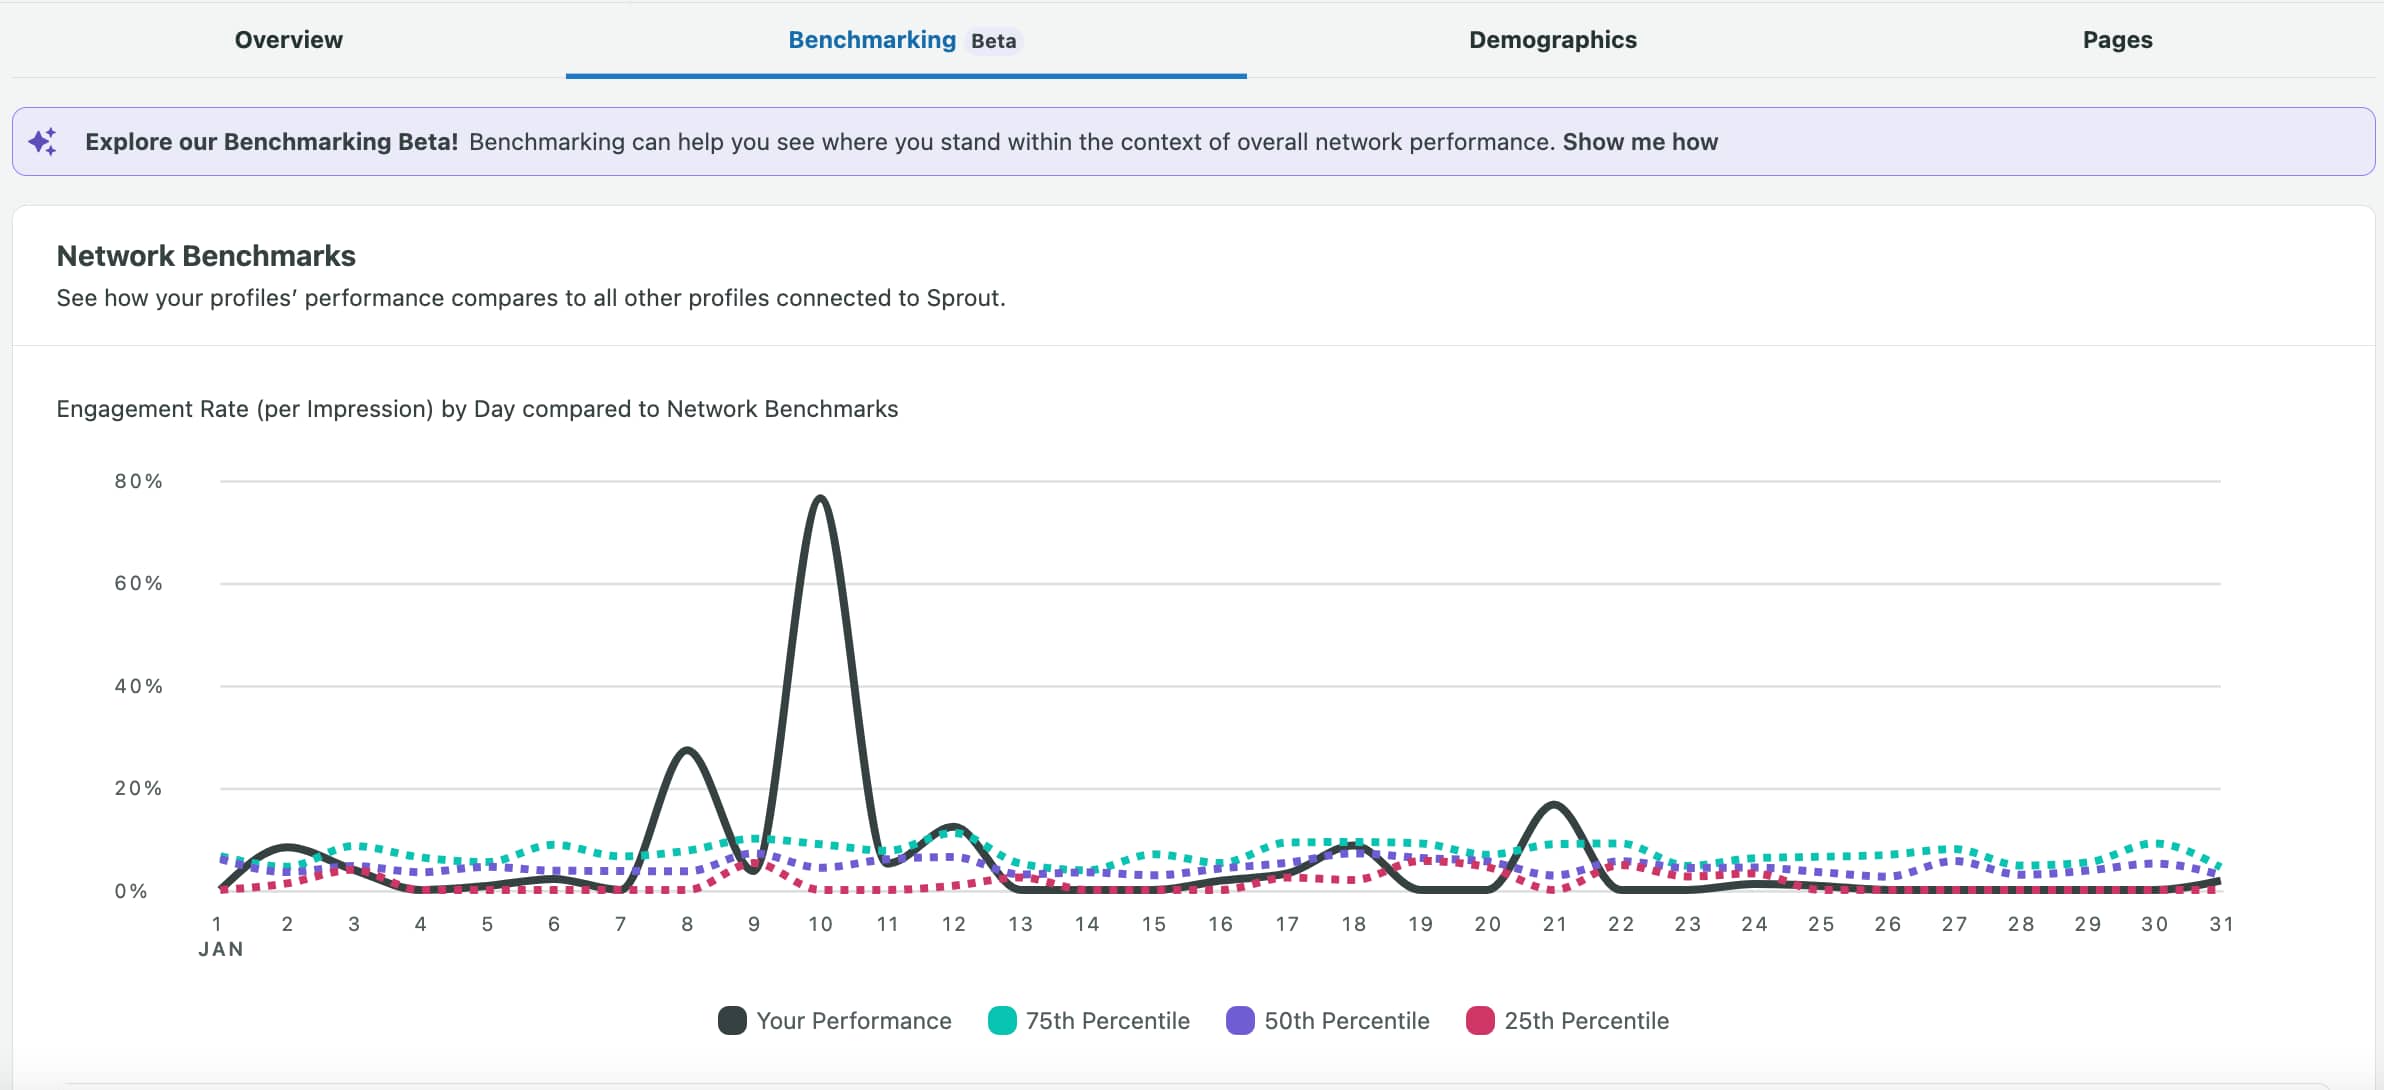
Metrics without context are just numbers. To understand your performance, you need to benchmark it against industry standards and your own historical data. This is how you separate noise from real insight.
While every industry’s ‘good’ looks different, you establish a baseline. Start by analyzing your own performance over the last six to 12 months to define what’s normal for your brand. Then, look at top-performing content in your niche to see what’s possible.
A comprehensive analytics tool gives you the power to compare your LinkedIn performance against competitors and industry averages. This transforms your data from a simple report card into a strategic roadmap for growth.
How to create LinkedIn analytics reports in LinkedIn
Depending on your account level, you export the analytics data or take screenshots to analyze the success of your Linkedin campaign. Here are the reports available in LinkedIn’s native analytics:
- Campaign Performance/Ad Performance: Get key details about your campaigns and ads. Download metrics like spending, impressions, click-through rate and engagement rate to see what’s working.
- Audience Network Campaign Performance/Audience Network Ad Performance: See how your campaigns and ads perform on LinkedIn and beyond. Activate the LinkedIn Audience Network and compare stats. Also, get a breakdown of metrics for LinkedIn, Audience Network and overall performance.
- Demographics: Learn more about your audience. Check out details like company names, job seniority and functions of members interacting with your campaigns and ads.
- Conversion Performance/Conversion Ad Performance: Compare the types of conversions your campaigns and ads are getting to understand the real impact.
- Leads: Find out who’s interested in your product. Check responses to Lead Gen Forms associated with your campaigns and build your guest list of engaged individuals.
- Conversation Ad CTA Performance: Track button clicks for each action in your conversation ads to see what’s catching the most attention.
- Placements Campaign Performance/Placements Ad Performance: Explore how your campaigns perform on LinkedIn and Audience Network. Understand where you’re getting the most traction for better planning.
Measuring LinkedIn ROI and attribution
The ultimate goal of tracking analytics is proving and improving your return on investment (ROI). This is how you secure more budget and earn a strategic seat at the table. It’s time to move beyond vanity metrics and focus on what drives the business forward.
Start by tracking website clicks from your LinkedIn posts using UTM parameters. This directly connects your social efforts to web traffic, lead generation and sales. Analyze which content drives the most valuable actions, not just the most likes.
Sprout Social’s reporting tools make it easy to visualize this data and create compelling reports that demonstrate the business impact of your LinkedIn strategy. You’ll stop reporting on activity and start reporting on results.
Tips for accessing LinkedIn analytics using Sprout Social
Creating insightful LinkedIn analytics reports with Sprout Social is simple and fast. Just follow these steps:
Step 1: Access Sprout’s reporting tools
Sprout offers a suite of reporting tools specifically designed to measure your LinkedIn performance. Besides an overview, Sprout also provides context for metrics and reporting features within the platform. This includes an Inbox Activity Summary and an Inbox Volume Widget.
Step 2: Familiarize yourself with available metrics
Sprout’s reporting tools cover various metrics for LinkedIn, including Company Pages, Ads and personal profiles. For Company Pages and Ads, metrics are accessible at both the Profile and Post levels. For personal profiles, metrics are only available at the Post level.
Profile metrics provide data for the past year, while Post metrics cover the last 90 days and ad metrics cover the last 180 days.
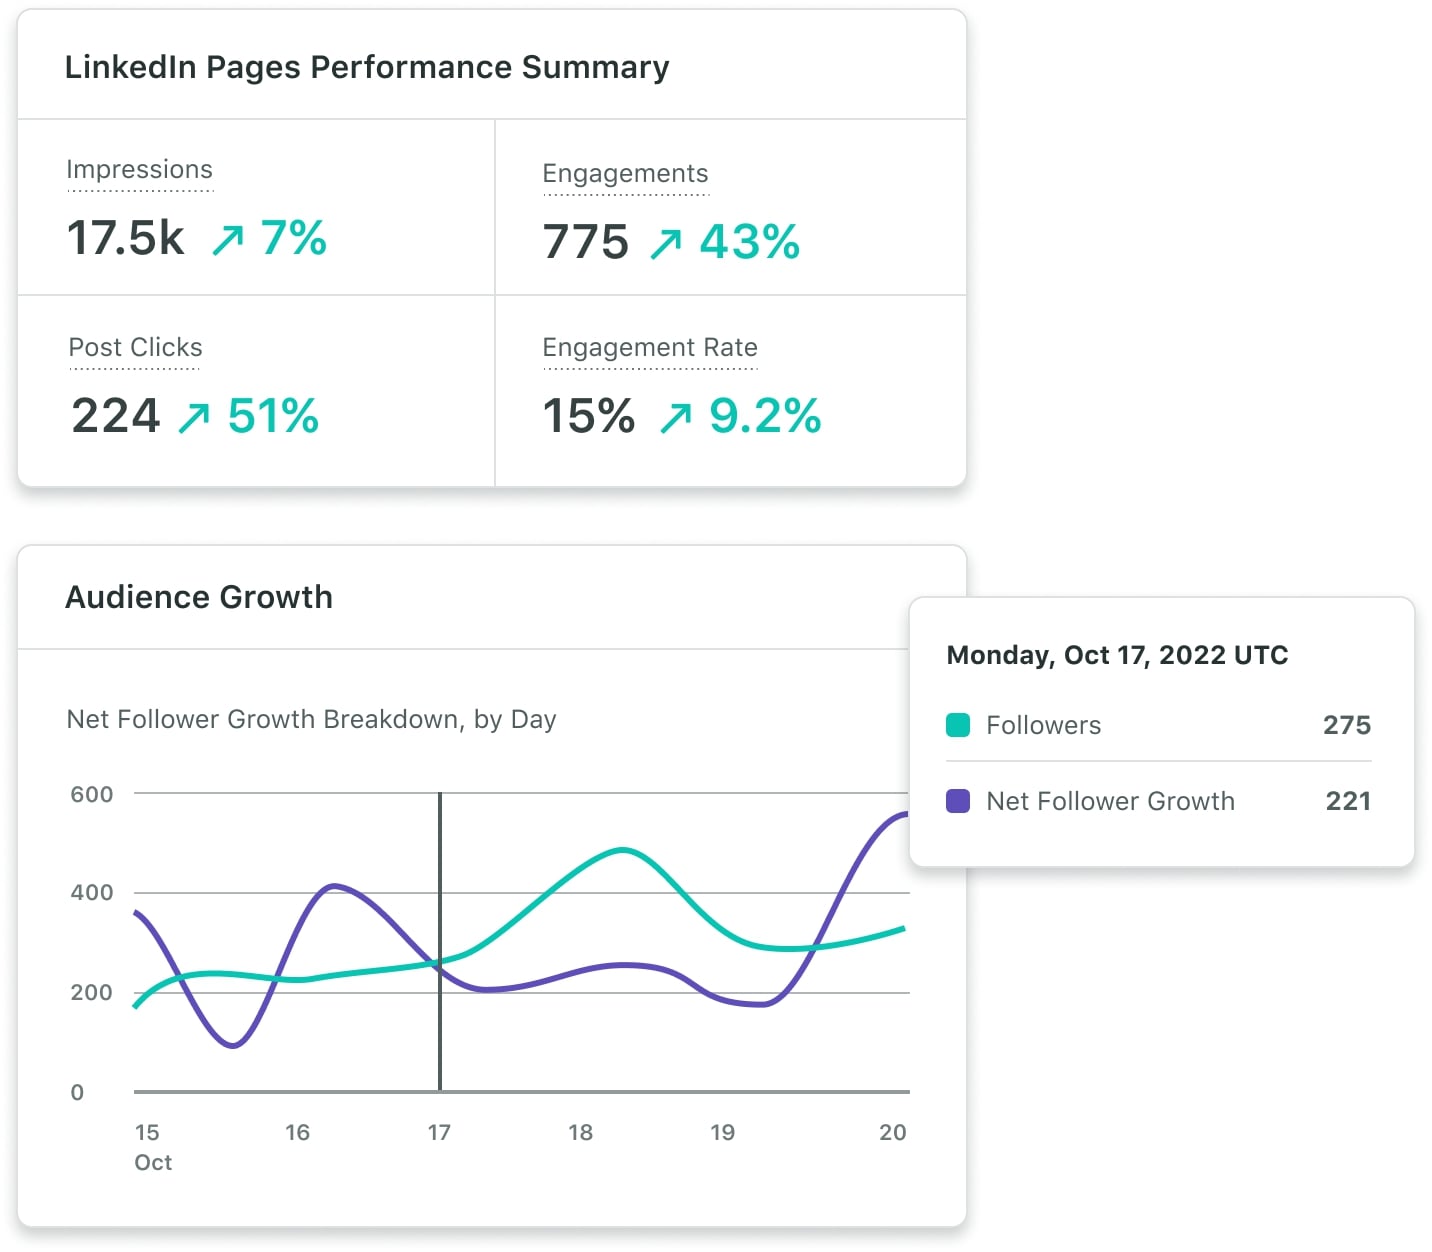
You also view Audience Growth to find out your net audience growth, organic followers gained, paid followers gained and followers lost.
Step 3: Choose your LinkedIn analytics report
Sprout offers two main reports for LinkedIn:
- LinkedIn Pages Report: This report helps you analyze and benchmark all your LinkedIn page activities. Use it to understand page-level activity and determine your top-performing pages. You also compare the impact of sponsored vs. organic content.
- LinkedIn Paid Performance Report: This report focuses on paid campaign-level data from LinkedIn. Use it to analyze the success of your paid campaigns.
Step 4: Customize the report
In the LinkedIn Pages Report, make the data work for you. Use filter groups in the Filter Menu to select the specific profiles you want to analyze and set the reporting period at the top of the report. This enables you to tailor the report to your specific needs. Customize your LinkedIn analytics report by selecting specific campaigns or ad accounts to include in the analysis. This way, you focus on the most relevant data when creating LinkedIn analytics reports.
Tips for using LinkedIn analytics
Knowing what each metric means isn’t enough. To truly win on LinkedIn, you need to analyze and leverage this data and create strategic content that clicks with your target audience.
Here are four ways to use analytics to boost your LinkedIn marketing strategy:
1. Know your audience
Check visitor and follower demographics to better understand your social media target audience. Think:
- Where are most of your followers located?
- What industries or departments do they work in?
- Are they entry-level employees? Or do they hold senior positions?
This information helps you create more relevant content that’s more likely to attract leads and drive conversions on LinkedIn. Also, compare visitor demographics with your followers to ensure your content aligns with your page information.
2. Understand your audience’s behavior
Use LinkedIn analytics to learn about how your audience interacts with your posts and content from other industry brands.
- What motivates your audience to engage with your content?
- What are their preferred topics or formats?
- Does your audience like to share content?
Every audience is different. Understanding how yours behaves helps you set realistic goals, spark engagement, schedule posts and create better content.
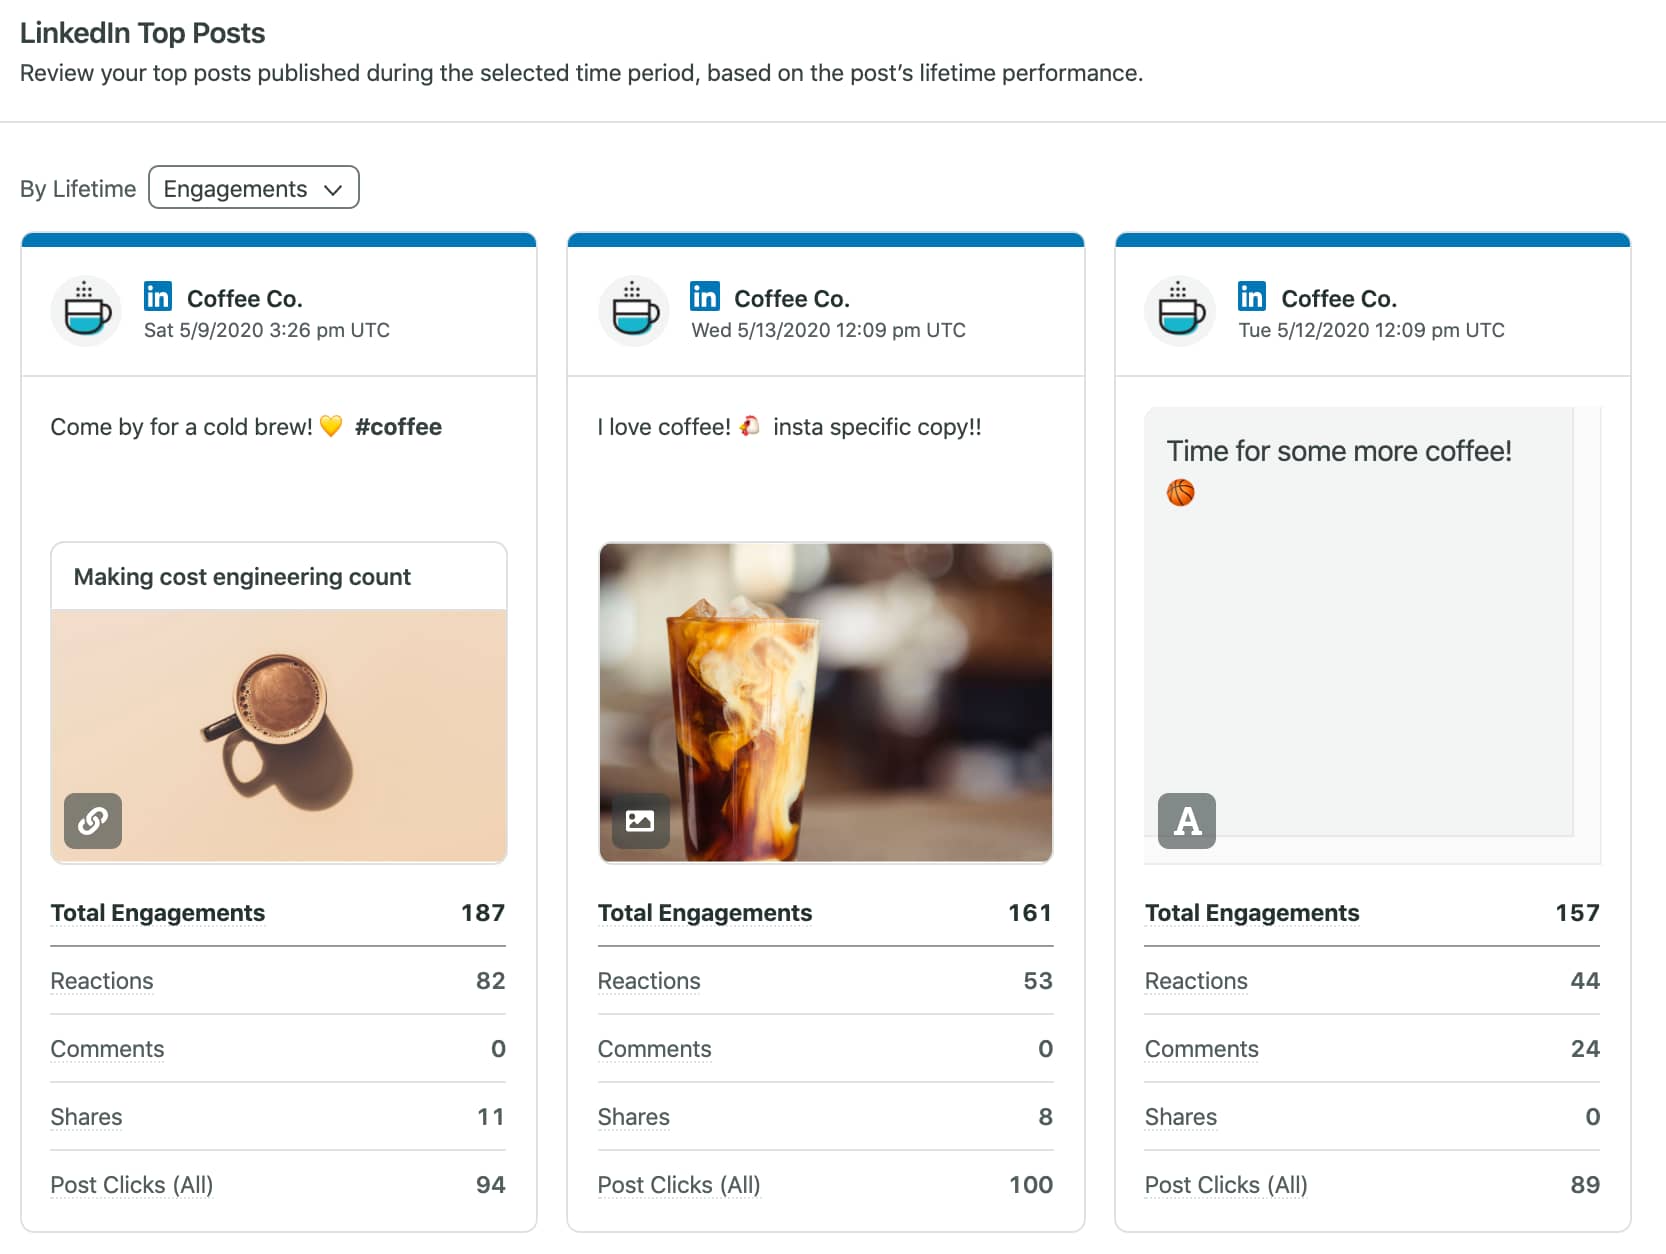
3. Understand what type of content works best
Different content types spark more engagement for various reasons. Think: audience preferences, the nature of your business, your brand voice or even the LinkedIn algorithm.
Keep track of your posts’ performance to identify the content types that receive the most engagement, traffic and overall results. For example, you find videos get more comments than written or image-only posts. Or that your audiences respond more to thought-provoking questions or interactive polls.
Regardless, experiment with different content formats and continually analyze analytics to know what works best on LinkedIn. Then, replicate successful strategies to grow on the platform.
4. Reveal new topics and trends
Tracking LinkedIn analytics helps you stay on top of trending topics in your industry. For instance, you can see which posts are getting more engagement and whether there are certain topics your audience is showing more interest in. You also look into trending LinkedIn hashtags to get a sense of popular topics.
5. Using LinkedIn analytics for competitive analysis
Understanding your own performance is half the battle. The other half is knowing how you stack up against the competition. Native LinkedIn analytics won’t give you a direct comparison, but that doesn’t mean you’re flying blind. You manually track your competitors’ follower growth, content themes and engagement on their top posts. This gives you a pulse on their strategy and what resonates with their audience, which is likely an audience you share.
This manual work is time-consuming. To get ahead, you need a tool that automates competitive analysis. Sprout Social’s listening features let you monitor competitor activity and industry conversations in real time, turning raw data into a significant competitive advantage. Also monitor competitor benchmarks to spot any sudden increase in engagement. Analyze their pages to identify the topics gaining traction. Combining your quantitative data with qualitative LinkedIn social listening gives you a complete, full-funnel perspective of your brand’s share of voice. Use this information to adapt your content strategy to align with current industry interests.
3 LinkedIn analytics tools for your brand
LinkedIn’s native analytics lets you track metrics related to overall page performance, visitor and follower demographics and individual post engagement. But if you want to dig deeper, use a more robust social media analytics tool to extract in-depth data.
Below are three popular LinkedIn analytics tools for professional marketers:
Sprout Social
Sprout Social is an all-in-one social media management platform that lets you track in-depth analytics for LinkedIn and other social media networks—all from a single dashboard.
Track metrics for organic and sponsored posts, learn about your audience and keep tabs on growth and engagement for multiple company pages.
Generate comprehensive reports or customize them based on chosen metrics. You also compare your performance with competitors to benchmark KPIs.
Sprout also offers LinkedIn management tools for streamlined content planning, publishing and engaging with your audience.
Inlytics
Inlytics is a specialized LinkedIn analytics platform that lets you monitor performance, optimize your profile and track engagement and audience data.
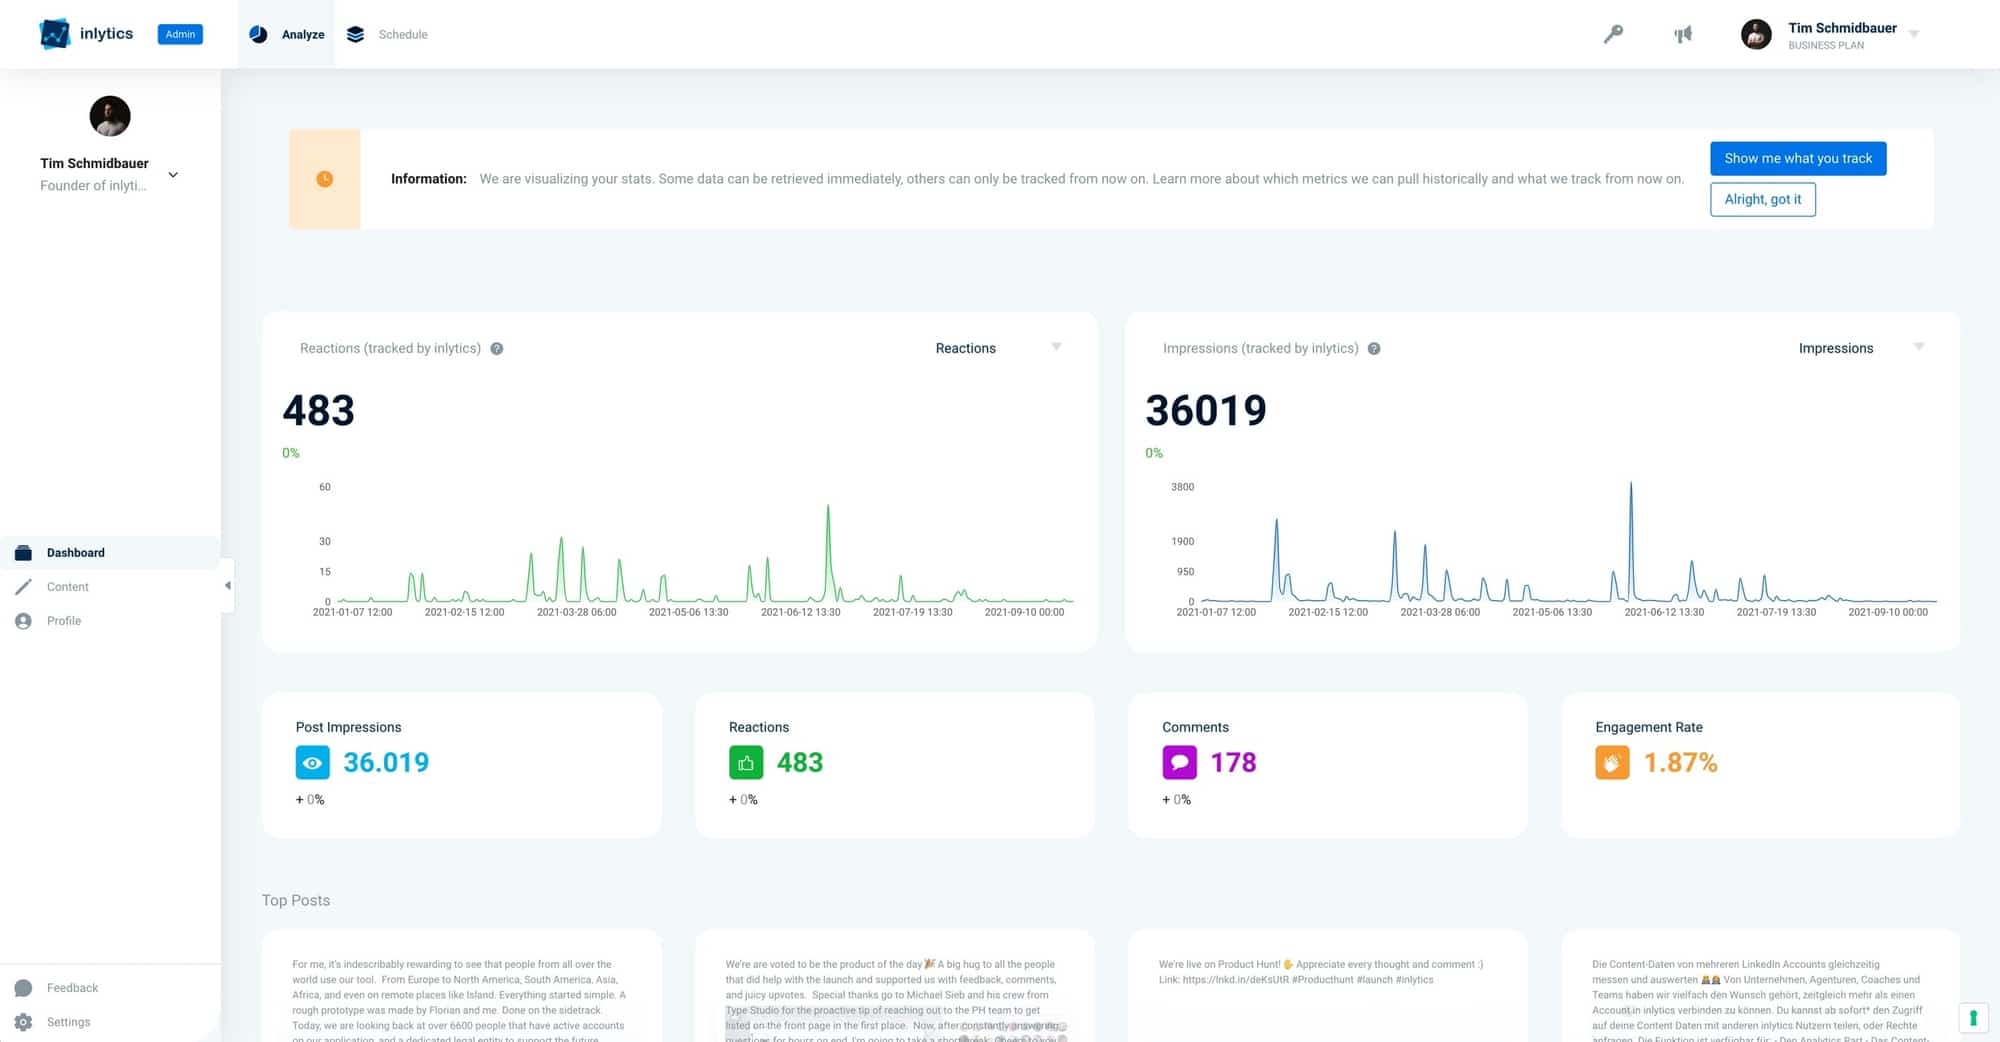
Its visual dashboard displays real-time and historical analytics to help you understand your content’s effectiveness. You can also collaborate with team members, schedule your posts and publish better content with data-driven recommendations and insights.
Brand24
Brand24 is a social analytics tool that focuses on brand mentions and sentiment analysis. It helps measure brand awareness on LinkedIn and analyze audience preferences.
The tool also measures campaign effectiveness through LinkedIn hashtag analytics, providing insights into reach and engagement.
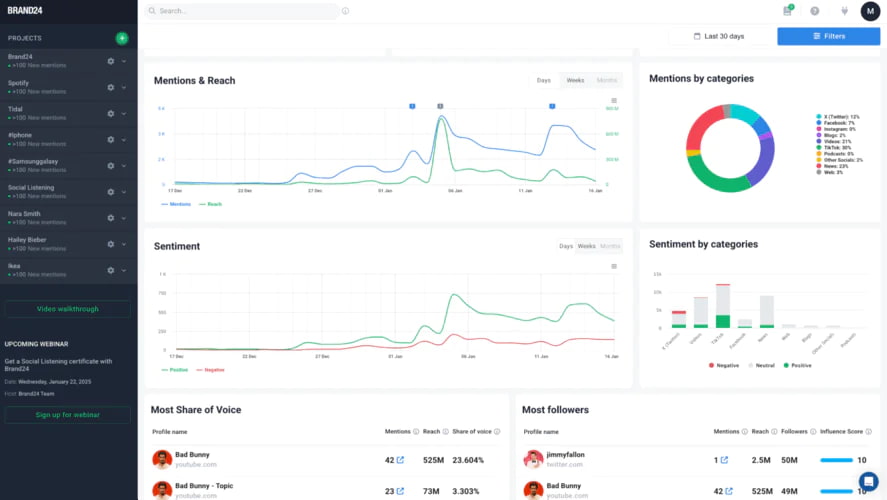
With features like AI-driven LinkedIn performance monitoring, Brand24 categorizes mentions and helps in precise brand perception assessment. It simplifies report creation and helps you track your brand’s performance more effectively.
Use LinkedIn analytics to create a data-driven strategy
Track LinkedIn analytics to grow on the platform. Learn about your audience and campaigns to create more effective strategies and spend money where it matters. Use the in-depth insights to connect with your followers, build brand awareness, expand your network and generate a loyal following with the help of data-driven content.
Sign-up for a free trial of Sprout’s Analytics tool to gain deeper insights into what your customers like, spot trends and prove your social efforts are indeed worthwhile.
LinkedIn analytics FAQs
How often should I check my LinkedIn analytics?
Review LinkedIn analytics weekly for trends and monthly for strategic planning. This frequency balances staying informed with avoiding data overwhelm.
What's considered a good engagement rate on LinkedIn?
LinkedIn engagement rates of 2% or higher are strong, but your historical performance is the best benchmark for improvement.
Can I track my competitors' LinkedIn performance?
LinkedIn’s native analytics don’t include competitor tracking, but third-party tools like Sprout Social offer automated competitive analysis and social listening.
How do LinkedIn analytics compare to other social platforms?
LinkedIn analytics emphasize professional metrics like job functions and industry data, while other platforms focus on consumer demographics and content trends.
What are the key LinkedIn metrics I should track?
Below are some key LinkedIn analytics metrics marketers should know about.
- Visitor metrics: Page views, unique visitors & visitor demographics.
- Follower metrics: Total followers, organic followers, sponsored followers, follower trends & follower demographics.
- Engagement metrics: Video views, reactions, comments, post clicks, shares, CTR, follows, LinkedIn engagement rate & total engagements
What's the difference between organic and paid LinkedIn analytics?
Organic analytics track unpaid content performance, while paid analytics measure sponsored content with metrics like cost-per-click and conversions.

Share