How to perform a social media competitive analysis (+ free template)

Written by Annette Chacko
Published on April 27, 2026
Reading time 16 minutes
Table of Contents
To thrive in a fast-paced digital world means keeping a close eye on the strategies that work for others in your industry. This competitive analysis is essential to understand the ever-evolving landscape of social media so you can build a robust marketing strategy.
Social media competitive analysis demands a proactive approach because social media strategies don’t work in a vacuum. That’s why you need to regularly analyze the tactics, successes and failures of your competitors. This will help surface the gaps in your strategies and uncover opportunities to differentiate yourself from the competition.
These insights will help you better target your audience, optimize content and improve your overall online presence and share of voice. Ultimately, they will give you that critical edge necessary for long-lasting success.
Continue reading to learn more about the advantages of social media competitive analysis and how to perform it.
What is social media competitive analysis?
Social media competitive analysis is the process of evaluating your competitors’ strategies and performance to identify market gaps and benchmark your brand’s success.
While basic tracking involves monitoring surface-level metrics like follower growth, a sophisticated analysis leverages social intelligence—the practice of operationalizing real-time market signals to fuel business action.
Rather than just watching what others do, social intelligence provides a window into your audience’s concerns, curiosities and cravings. By combining owned-channel performance data with earned media conversation data, you move beyond “what” happened to understand the “why” behind market shifts.
What are the benefits of social media competitor analysis?
Competitive analysis on social media provides the intelligence you need to understand where your brand stands and how to outperform industry rivals. By building a competitive social media scorecard, you can track your share of voice and identify the specific levers that drive market impact.
Here’s a deep dive into the strategic benefits of monitoring your competition.
Identify gaps and strengthen your content strategy
Social media competitive analysis helps you spot the white space your brand can own. By analyzing your rivals’ performance, you can identify untapped audience segments on underused platforms or content formats they are neglecting.
For example, if a competitor is over-indexing on Instagram but ignoring LinkedIn or TikTok, you have a clear opening to capture that community.
This analysis also guides you in choosing the styles, tones and messaging that resonate best with your shared audience. If competitors see high engagement with video tutorials or user-generated content (UGC), you can integrate similar elements—like “edutainment”—into your own strategy to drive meaningful interaction.
According to the 2025 Sprout Social Index™, original and relatable content is the primary reason consumers choose to follow a brand, second only to product quality. Use competitive insights to move beyond shallow trend-chasing and create a distinct identity that cuts through the noise.
Improve your social customer care
Social media competitor analysis reveals how your rivals handle customer interactions, providing a roadmap to differentiate your brand through superior service. By monitoring their response times and tone, you can emulate high-performing tactics and avoid common pitfalls.
In today’s market, social customer care is a non-negotiable driver of loyalty. According to The 2025 Sprout Social Index™, 73% of social users will buy from a competitor if a brand fails to respond on social media. Furthermore, nearly three-quarters of consumers expect a response within 24 hours or sooner.
Analyzing your competitors’ care performance allows you to identify service gaps. If rivals are slow to respond or ignore specific platforms, you can gain a competitive edge by delivering proactive, personalized care. The 2025 Content Benchmarks Report highlights that while publishing volume slightly dipped in 2024, inbound engagement rose by nearly 20%, proving that audiences reward brands that prioritize 1:1 connection over content volume.
Anticipate shifts and lead the narrative
Monitoring your competitors’ activities helps you stay ahead of the cultural and market shifts that define your industry. By observing how others experiment with new platforms or content formats, you can identify successful tactics and act ahead of narratives gaining momentum.
True competitive advantage comes from predictive media intelligence—using real-time, AI-driven insights to anticipate where the market is headed before risks escalate or opportunities vanish.
For example, if a competitor gains traction with a specific trend, you can use social intelligence to decode the underlying sentiment and pivot your strategy with certainty. Staying ahead of the narrative ensures your brand remains a trusted leader rather than a reactive follower.
How to perform a social media competitive analysis
Before we start, download our social media competitive analysis template to maximize the use of this article and make it even easier to follow these steps. The steps below will help you navigate the Sprout Social platform, referencing the template at each stage.
1. Set up competitor reports
Before you begin your analysis, you need a repeatable way to pull data. Identifying the brands competing for your audience’s attention helps you build a blueprint based on what’s working in your industry. According to The 2025 Sprout Social Index™, 93% of consumers believe it is important for brands to keep up with online culture. Monitoring how competitors position themselves within that culture is the first step.
How to identify your social media competition
To build a blueprint for success, you first need to identify who is actually winning the attention of your target audience. Competitor identification shouldn’t be limited to those who sell the same product. It includes any brand occupying the “mental real estate” of your customers.
- Direct competitors: Brands offering the same products or services (e.g., if you are a specialty coffee roaster, your direct rivals are other premium roasters).
- Indirect competitors: Brands that solve the same problem or meet the same need (e.g., a local bakery or a bottled tea brand).
- Aspirational accounts: Industry leaders outside your immediate reach that set the gold standard for original, human-centric content.
Start by searching for keywords your audience uses to find solutions. Beyond a basic Google search, use social media listening to uncover organic conversations. This surfaces the brands your audience mentions, compares, or complains about—even when those brands aren’t tagging handles or using official hashtags.
NewsWhip by Sprout Social
For brands that need to get ahead of the narrative rather than just react to it, NewsWhip provides real-time predictive media intelligence. While standard tools track what has happened, NewsWhip acts as an AI-powered radar that identifies emerging narratives across the entire digital ecosystem—including news sites, blogs, and online communities.
By using predictive analytics to identify trends poised to go viral, you can move from a reactive posture to a leadership position, defusing potential crises or seizing cultural moments before your competitors even see them coming.
To get more specific to your audience, perform some market research or competitive monitoring. With social media listening, you’ll uncover conversations your audience is having about you, your industry and your competition—even when they don’t tag your handles.
Once you’ve lined up your competitors, it’s time to set up competitor reports with Sprout to track their performance.
Want to try it yourself? Start a free 30-day trial using your business email to follow along. Then, let’s walk through the steps to create these reports:
- Navigate to the Reports tab in your Sprout dashboard.
- Under Cross-Network Reports, select Competitor Performance.
- Select the date range you want to analyze with the date picker at the top of the report.
- Click Filters to customize the types of data you want to view (like engagement or post type).
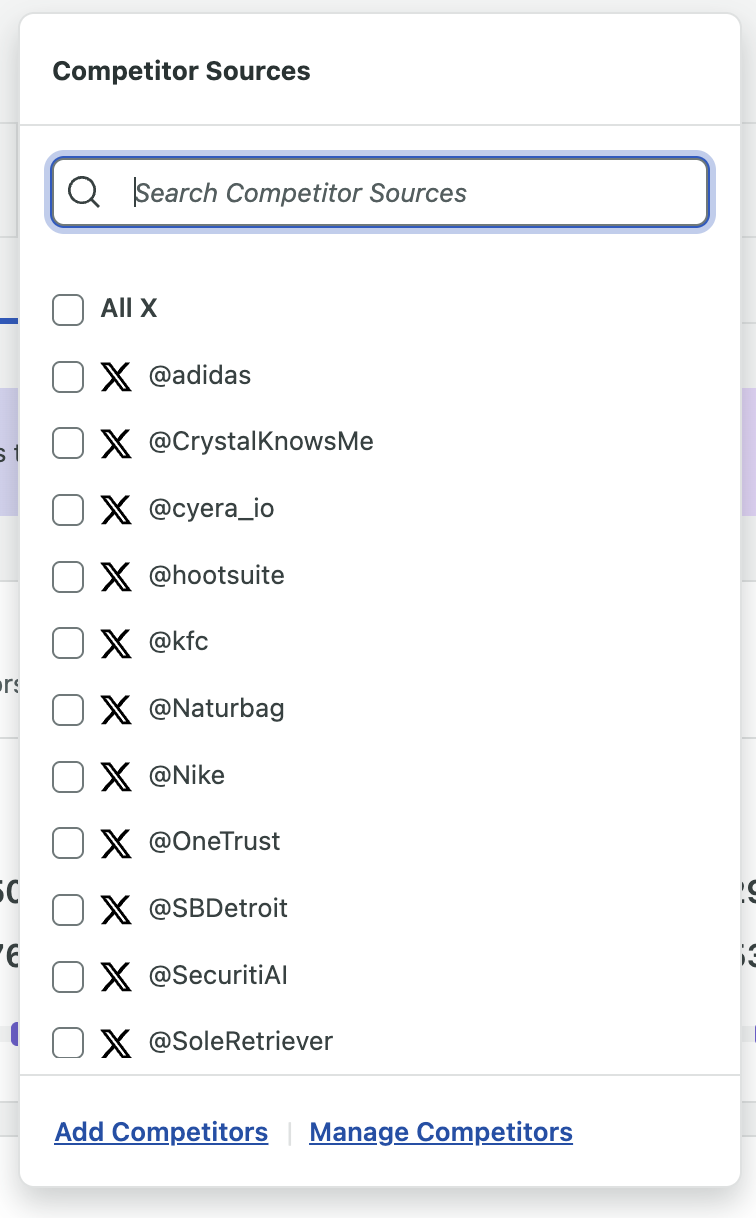
- Click Sources to choose which profiles to include in your comparison (your social profiles or competitors’ social profiles).
- Select Hide Your Profiles to view only competitor data.
- Choose Competitor Sources to select specific competitor profiles for side-by-side comparisons.
Pro tip: Focus on brands that share your audience or product category, not just the most prominent industry names.
2. Track competitor content performance
Your audience interacts with brands multiple times per day. Analyzing where your competition performs well enables you to uncover repeatable patterns in formats, hooks and creative styles.
Competitive analysis is most useful when you compare efficiency rather than just totals. Raw engagement often favors larger accounts; instead, anchor your analysis on:
- Engagement rate: Resonance relative to audience size.
- Engagements per post: Content quality vs. publishing volume.
- Video completion rates: Effectiveness of short-form video, which is currently the top-performing format across Facebook, Instagram and TikTok.
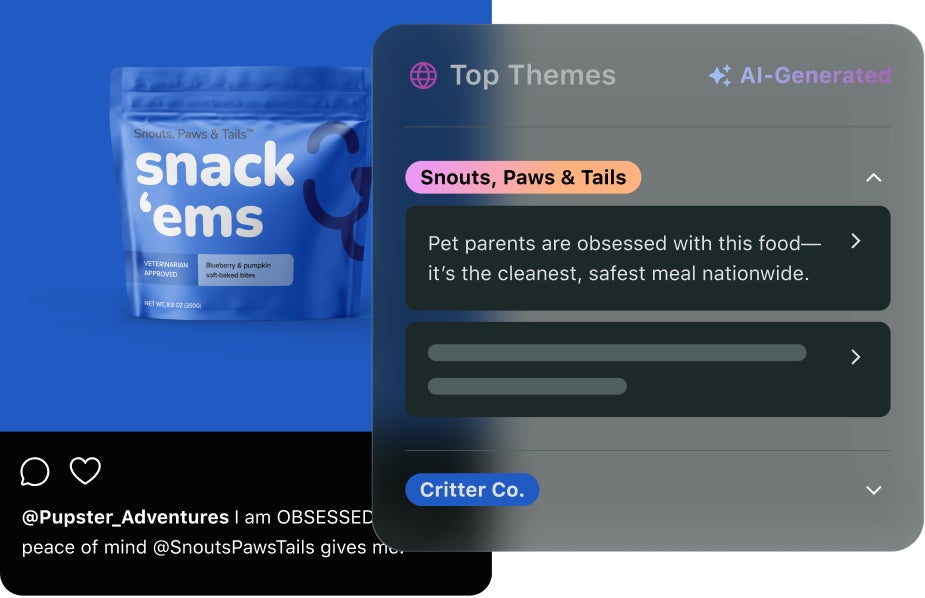
Level up your analysis by using AI summaries to speed up the process. AI can cluster competitor posts into emerging pillars you may have missed or summarize top-performing themes, allowing you to spend less time on manual sorting and more time on strategic thinking.
Sprout’s reporting tool gives you a centralized view of how your competitors are performing across social media channels (Facebook, Instagram and X), making it easier to spot trends and benchmark your brand’s performance. You can track posting frequency, which formats achieve the highest engagement (like Reels, carousels or polls) and the sources of their audience growth.
Head to the Overview tab to find:
- A high-level summary: Key metrics like followers, audience growth, publishing behavior and engagement rates
- Audience growth: Net follower growth, percentage growth by platform
- Publishing behavior: Publishing cadence and the types of posts competitors publish
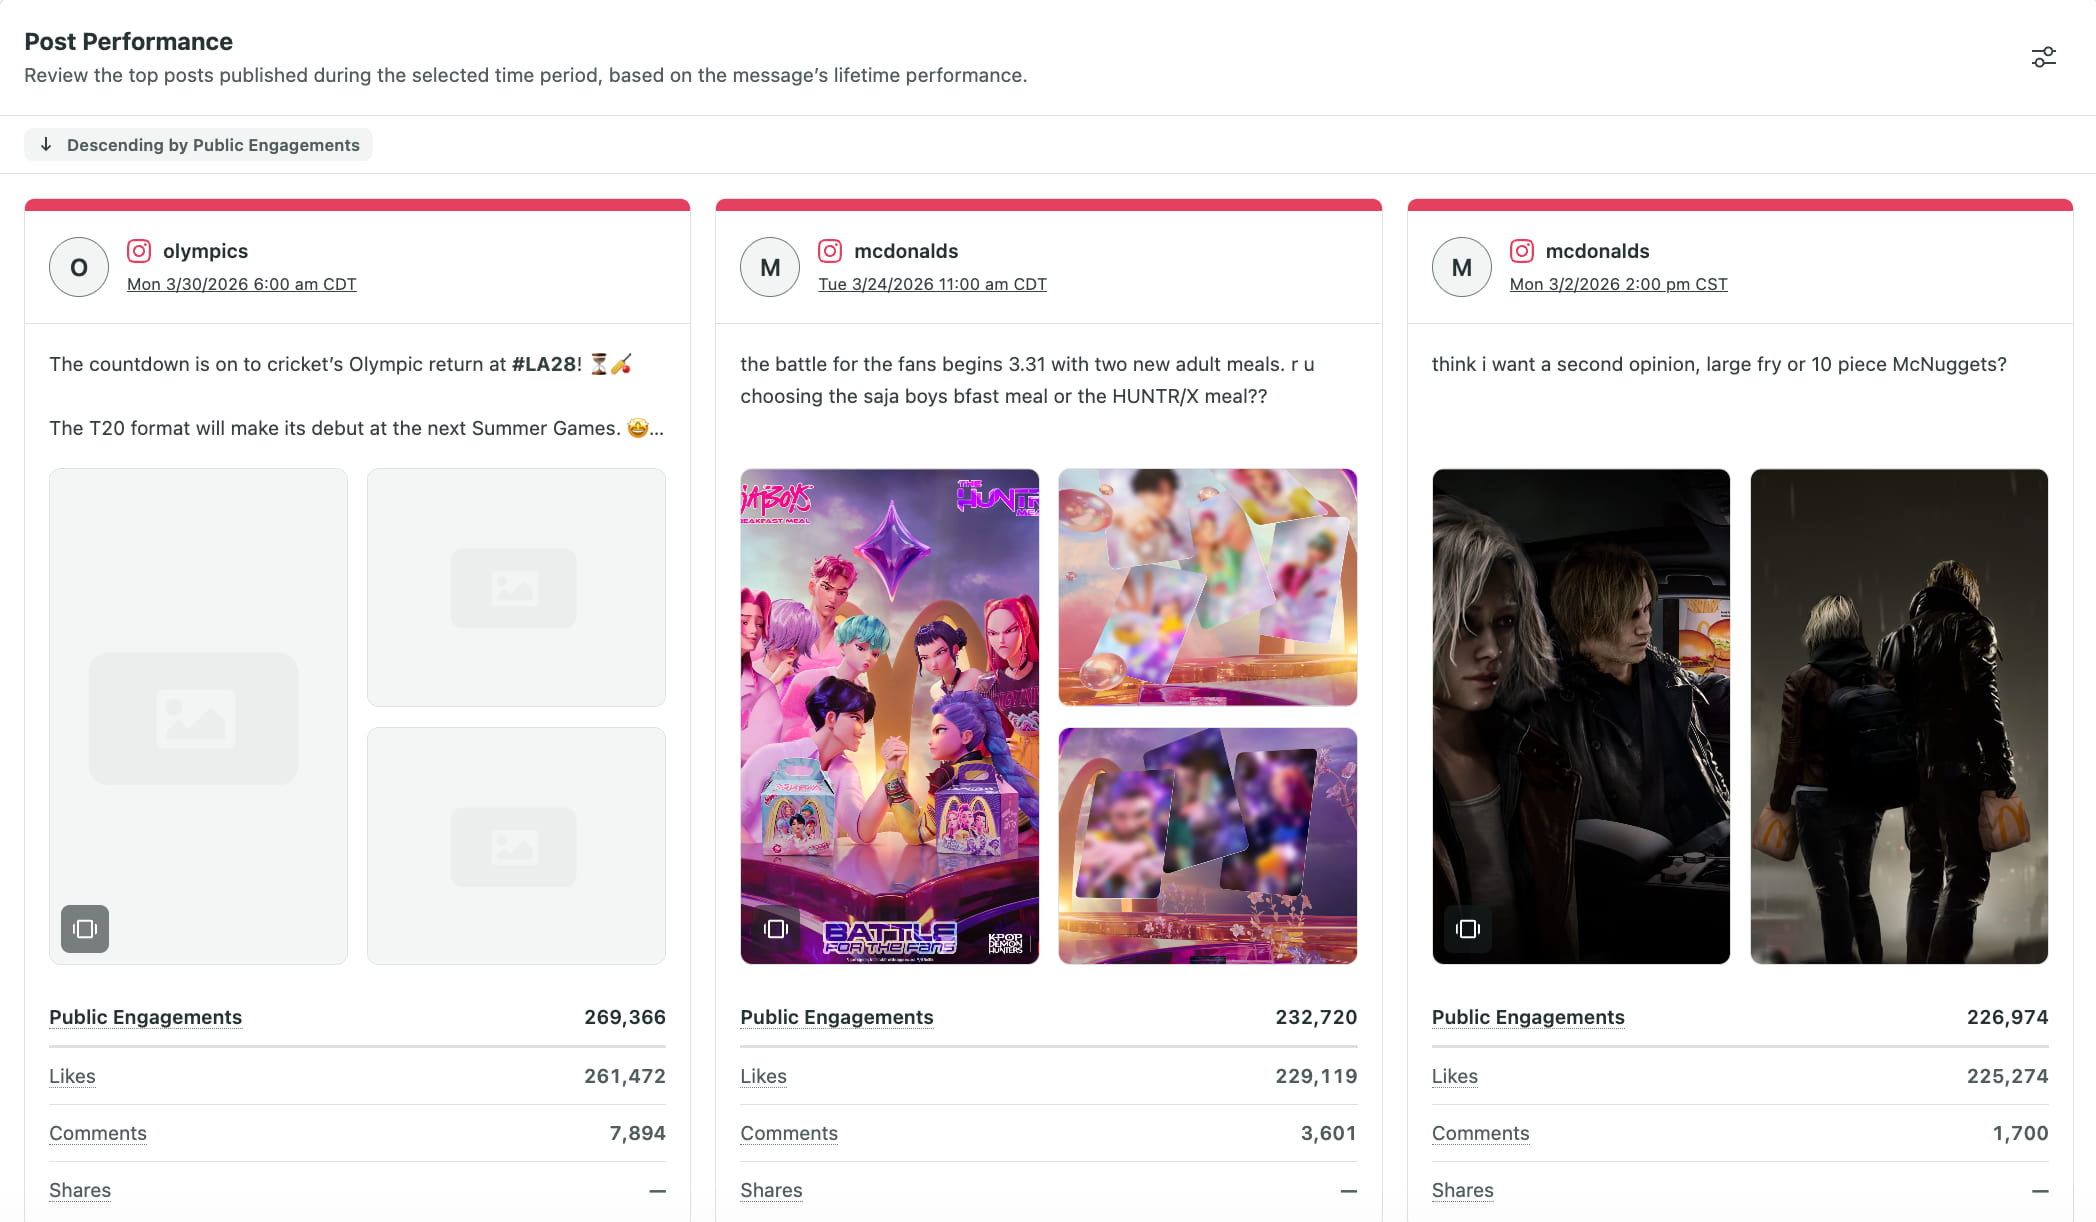
- Top posts: Posts with the highest engagement
- Engagement breakdown: Types of public interactions by social network
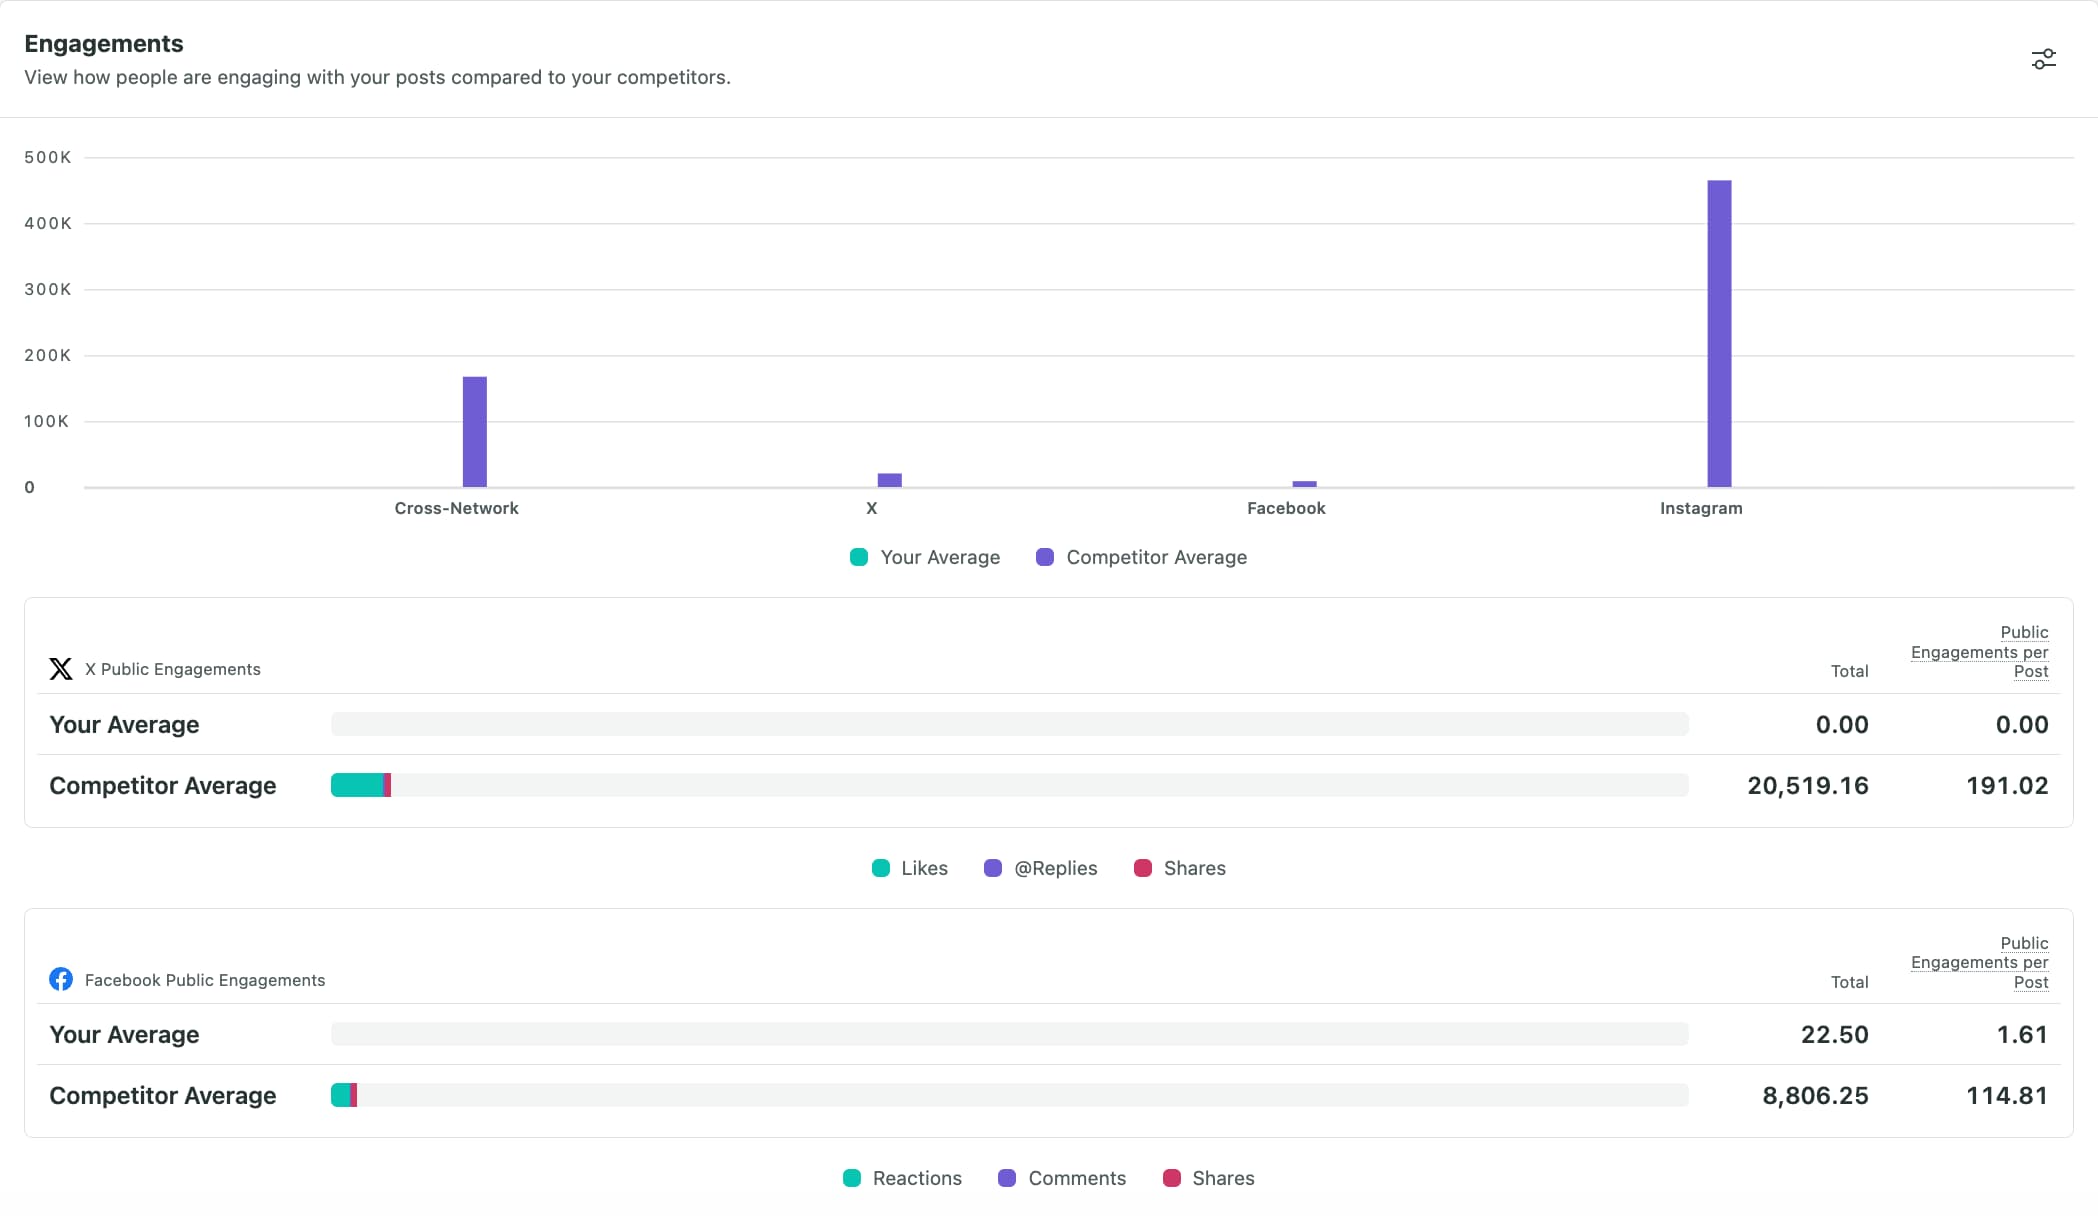
Competitor reports make it easier to spot gaps in your own content plan, adjust your posting frequency or test new content formats based on what’s working.
With your big picture overview completed, you can dig deeper into specific social media channel performance. Sprout’s competitor reports for Instagram, Facebook and X (formerly Twitter) enable you to analyze each brand’s performance network-by-network.
Instagram competitive analysis
Start by doing a visual analysis of your competition’s Instagram account. Ask yourself:
- Do they use a link in bio tool? How often are they updating it?
- How often are they active on stories? What does that content look like?
- Do they have a brand-specific hashtag?
- What do they say in their bio to set themselves apart?
- Are they using Instagram highlights?
Level up by using Sprout’s Instagram Competitors Report to compare and benchmark your brand against competitors at a glance in key areas:
- Audience growth: Are your competitors growing their audience quicker than you?
- Posting frequency: How frequently are your competitors publishing? This can reveal whether you’re posting enough to keep your audience engaged.
- Hashtags: What hashtags do your competitors use to gain more exposure?
- Top posts: Try to get an idea of why these posts are performing well. Are they product photos? Do they use certain colors? Find out what these posts have that your content doesn’t and use the info to improve your images and videos.
- Engagement: Evaluate how people are engaging with your and your competitors’ posts during your selected time period. Is there a clear pattern of how your competitors are gaining strong engagement?
Pro tip: Another tactic is to search for your competitors by hashtag on Instagram, like #Folgers, to see how many people are tagging your competitors in posts. If it’s a lot, that indicates the company is getting noticed and has an active following.
This will also give you a sense of what hashtags people use to refer to other brands and could spark ideas for hashtags to use for your brand.
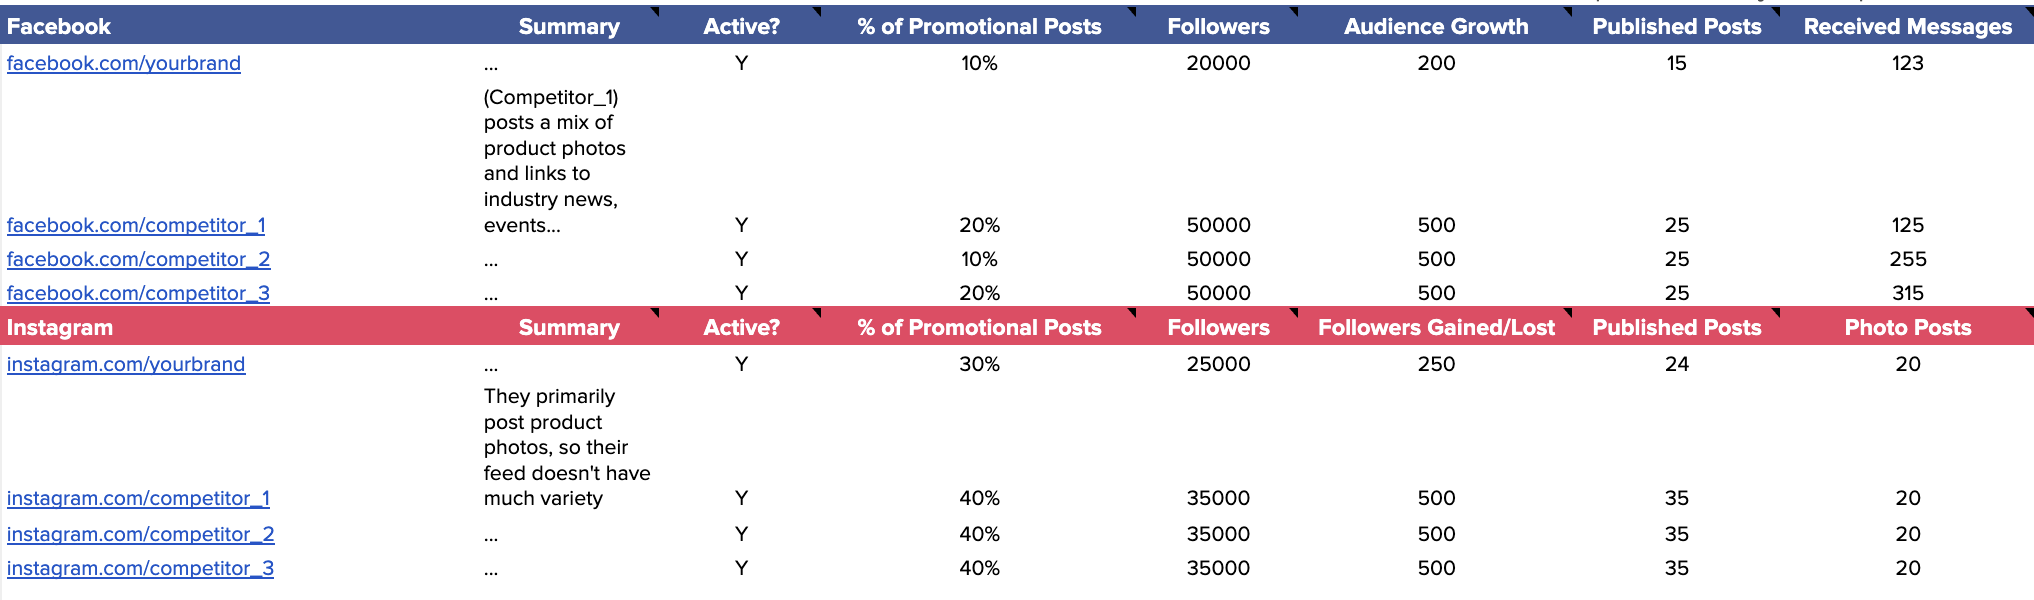
Once you have all the information from your Instagram competitive analysis research, make sure you add that data to your competitive analysis template, like so:
Facebook competitive analysis
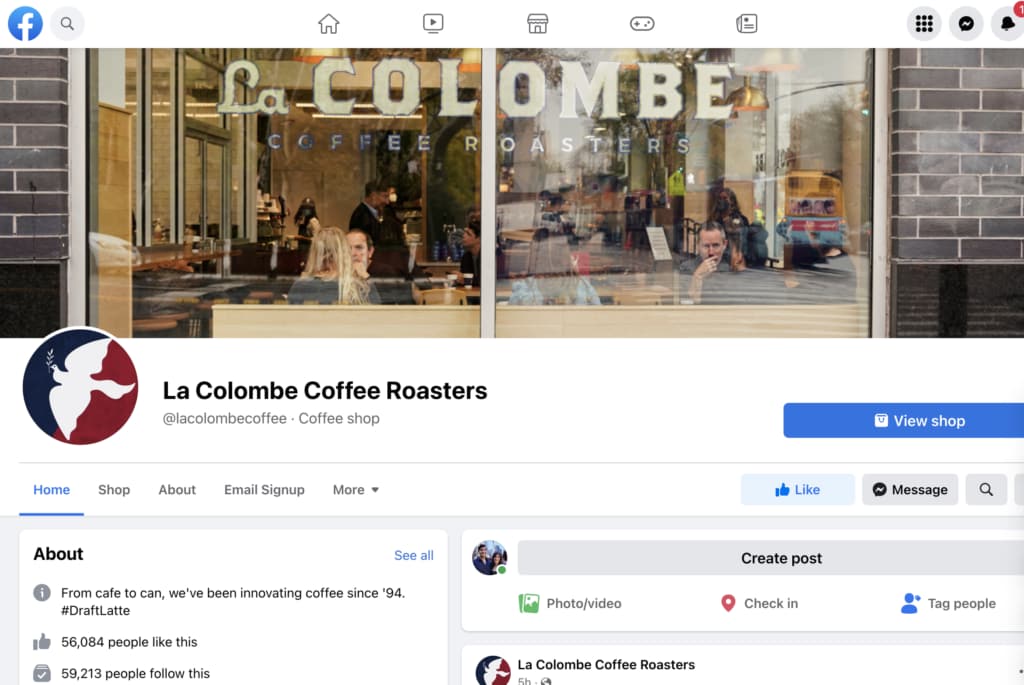
Start by doing a manual review of your competitor’s page, looking for the basics:
- Check the number of follows and page likes.
- Identify specific tabs or features they have. For example, some coffee roasters might have the Shops section enabled. If you notice the same trend with other competitors, it’s likely a good sign it’s working for them.
- Look at their visuals and branding.
- Review their About section to see how they set their business and social presence apart.
A visual analysis is nice, but it only goes so deep. This is where Sprout’s Facebook Competitor Report comes in to judge how well the competition’s content performs over time.
Use this report to see:
- How many messages your competitors send and receive
- The types of content they post (text, images or videos)
- Engagement and the number of received messages
All of this will answer questions about your competition’s presence and how you can stand out from it.
Include this in your spreadsheet, as well as any specific metrics that are important to your strategy.
X competitive analysis
Your X analysis will look similar to your Facebook analysis.
Here are a few areas to take note of:
- Note the number of followers.
- Look at the visuals and branding of their cover image and profile picture. How often do they shift these visuals?
- Review their bio. What are they highlighting? How have they set themselves apart?
- Do they adjust their X name (not their handle) for holidays like Halloween?
To see a more direct, automatic comparison between your X account and your competitors, level up with Sprout’s X analytics. This compares your X profiles against each other or a competitor. Select your X account, then enter a competitor for the other slot.
The report shows engagement, influence, followers gained/lost and mentions. You can change the time period, but it’s best to stick to the last 30 days to keep the data relevant.
Once you’ve looked over all the competitive social media analysis from the X report, be sure to enter the data into your spreadsheet. Tracking this information can be extremely valuable down the line.
Level up your data
Our spreadsheet and Sprout’s reports include Facebook, Twitter and Instagram.
But it’s still a good idea to conduct a manual analysis of any additional social channels, like LinkedIn and TikTok, relevant to your brand and audience.
3. Use social listening to monitor competitor mentions and sentiment
Owned-channel performance is only half the story. To gain a true competitive edge, use social listening to monitor earned conversation—what people say about your rivals when they aren’t tagging them.
Set up listening topics for each competitor that include brand variations, product names and campaign hashtags. This broader perspective allows you to capture conversations on platforms like YouTube and Reddit.
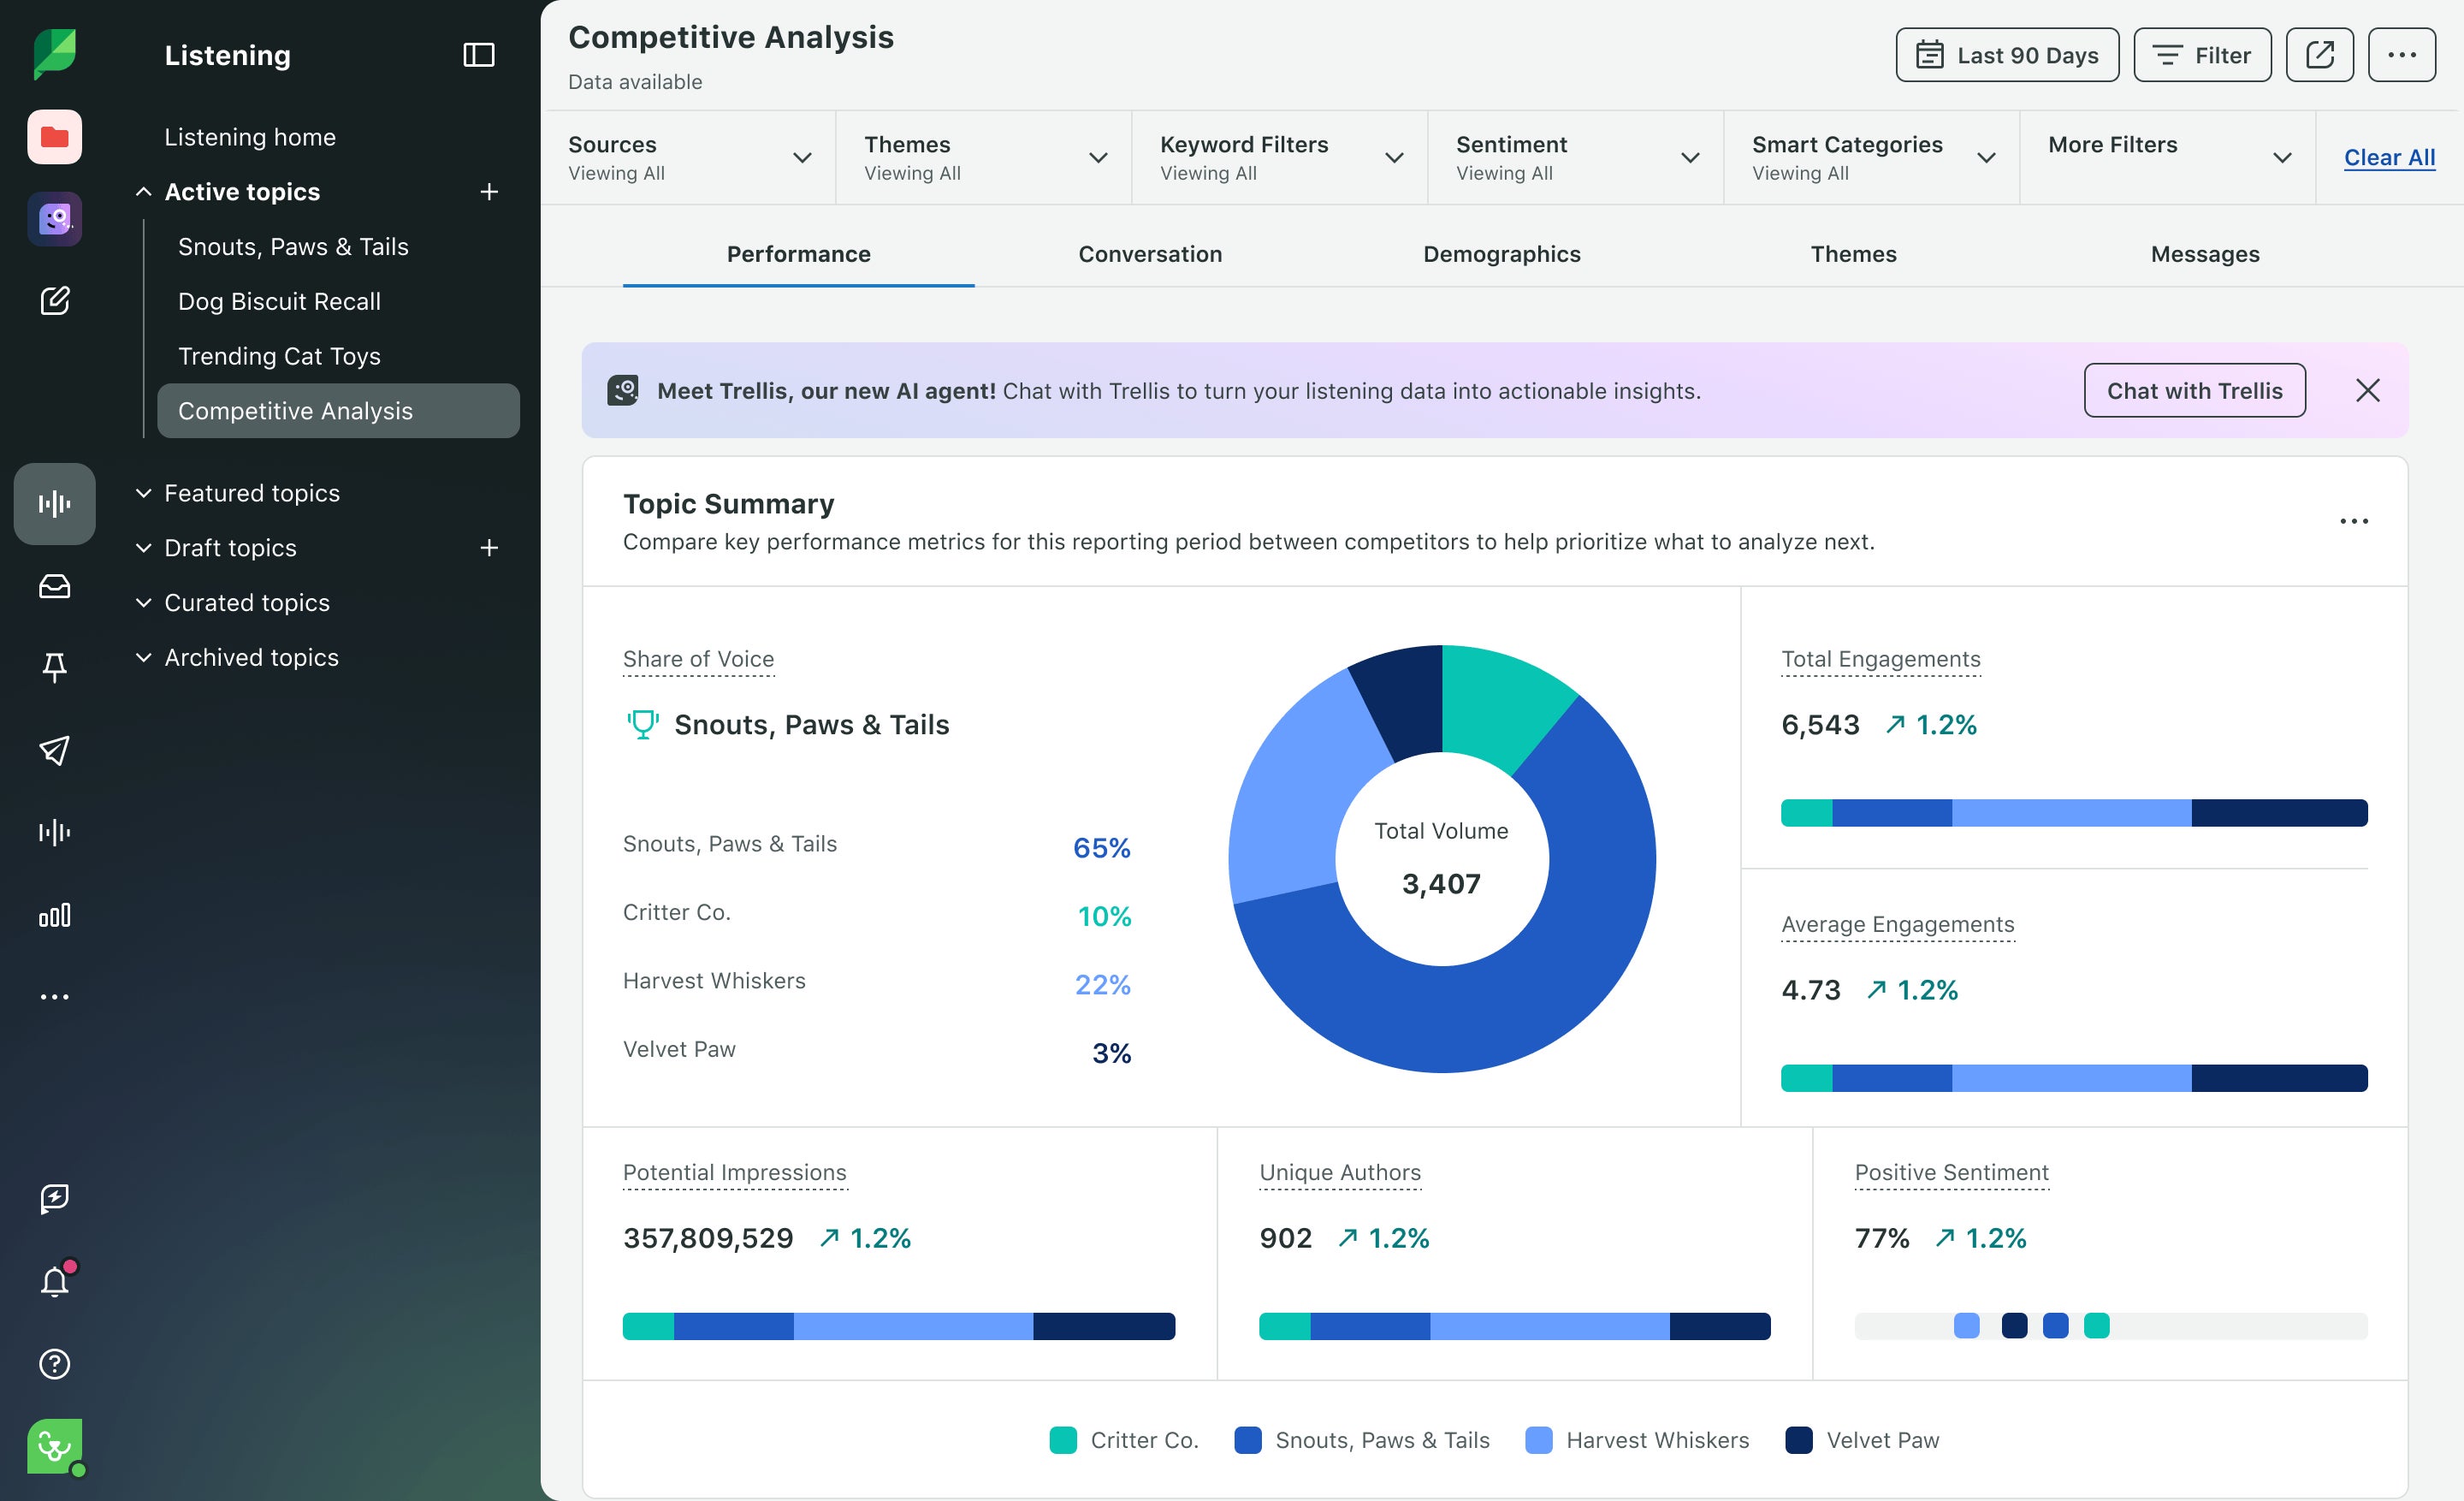
Focus on high-signal listening outputs:
- Share of Voice: Your brand’s volume of conversation relative to rivals.
- Sentiment over time: Whether the market perception is shifting.
- Drivers of spikes: Identifying if a competitor’s engagement grew due to a product launch, a PR crisis or an influencer partnership.
Use an AI assistant to quickly answer questions like, “What are the top complaints about Competitor X this month?” This helps you move from raw mentions to decision-ready insight fast.
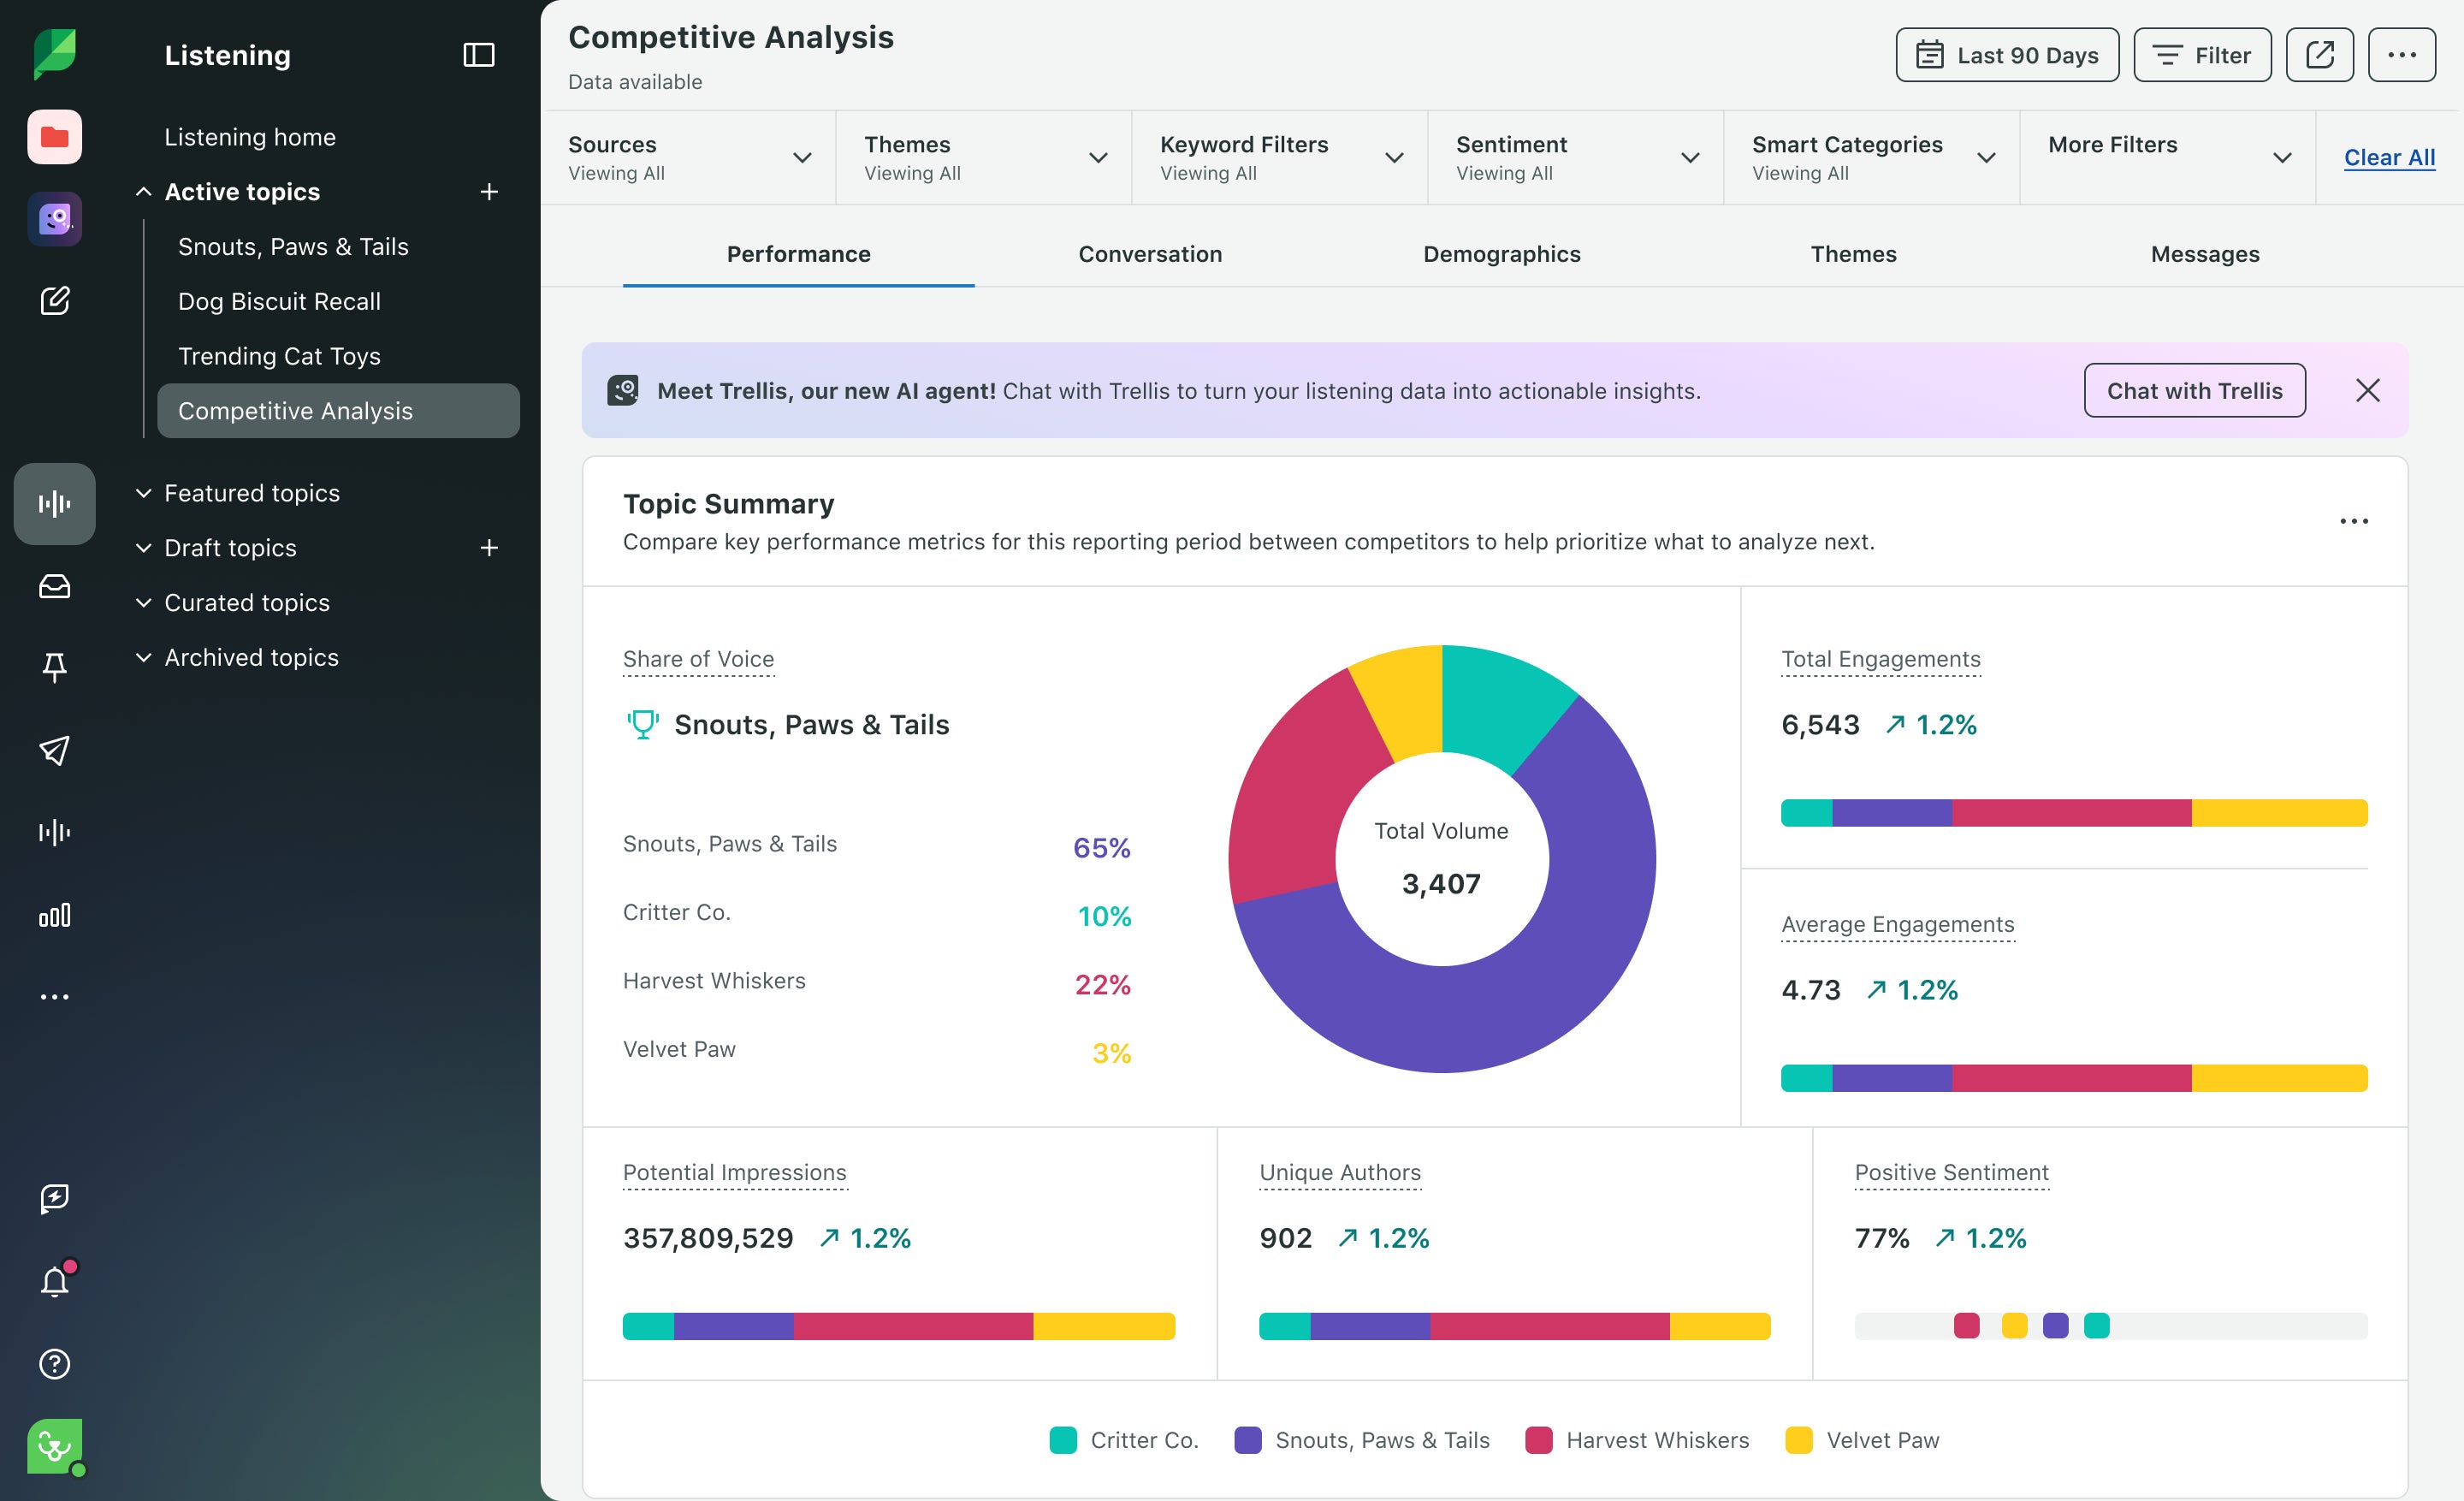
Here’s how to set up competitor monitoring using Sprout’s Social Listening tool:
- Navigate to Listening from the left-hand menu of your dashboard.
- Click New Topic and select the Competitive Analysis template.
- Name your topic with the option to provide a description.
- Add competitors by entering their brand names, relevant keywords, hashtags or user mentions in the Competitor Query Card. You can add up to 10 competitors per topic.

Fine-tune your setup by adding your brand handle for side‑by‑side comparison, or filter it out to avoid skewing data. You can also quickly preview and refine the query to ensure it’s pulling the most relevant conversations.
Finally, save and activate your Listening Topic to start collecting data.
Sprout’s Listening tool is invaluable for uncovering market gaps, finding relevant conversations to engage in and more. For example, Grammarly uses Sprout’s Listening tools to provide cross-team insights and analyze its competitive share of voice on social. Sprout helped Grammarly identify that it owned 71% of its competitive share of voice.
Sprout’s built-in competitive analysis tools also make it easy to measure your competitors’ social presence and compare it to yours.
With this template, you can identify the top competitors you want to track and include specific profiles, keywords, phrases and hashtags that you want Sprout to listen to.
To see what Sprout’s Listening tools can do for your brand, request a demo to try it for yourself.
4. Benchmark performance against industry leaders
Benchmarking isn’t just about “us vs. them”—it’s about performing at the level your category demands. Use the Competitor Performance Report to measure how you stack up against industry peers across key metrics like engagement per post and follower growth trends.
Remember that half of competitive intelligence is quantitative, while the other half is qualitative. Dig into:
- Brand persona: Does the competitor use a formal tone or a more “Unexpected” and assertive voice?
- Content mix: What percentage of their feed is “edutainment” (educational and entertaining) vs. purely promotional?
Response strategy: How quickly do they handle customer care? With 73% of users willing to switch to a competitor if a brand fails to respond on social, this is a critical differentiator.
How active is the competition?
It’s fairly easy to gauge how active brands are by answering these questions:
- When was the last time they posted?
- Are there long spans of time between each post?
- Do they respond to comments?
- How in-depth are their responses to comments?
Brands should post at least once every few days to be considered active. But you risk falling behind if your competitors post several times a day more than you do. For example, X allows for a lot more flexibility when it comes to how often to post—are your competitors significantly outpacing your daily posts?
Looking into all of this sheds light on their customer care strategies, content and any existing gaps.
What types of content do they post?
Look at each competitor’s last 10 posts and calculate what percentage of them are promotional, like prompting their audience to sign up, shop, etc.
This can also apply to the content formats they post. Are they posting a lot of video content? Mainly photos? Do they lean heavily on creators and user-generated content? How often do they jump on trending sounds or social media memes?
Use this information to see what content formats they’re using to pull ahead and cut the guesswork out of your strategy.
What’s their brand persona?
Some marketers like to look at their competitors’ brand voice when conducting social media analysis. Voice describes the tone and POV a brand uses on social media. Do they post from the brand’s perspective (we), or do they have individuals post on the brand’s behalf?
For example, consider the tone of the Field Museum’s social account.

The Field Museum’s tone is very different from the American Museum of Natural History’s tone. They each have their own online personalities.

Level up: As you wrap up, take a look at your competitors’ websites—content marketing and social media are closely related. A lot of companies repurpose their blogs for social media content. Take a look at your competition and see how many of them are maximizing their bevy of content.
Once you go through each competitor, put the data into your social media competitive analysis template.
5. Apply insights to improve your social strategy
After gathering your data, translate those competitive signals into better creative decisions. The goal is not to copy, but to innovate where others are falling short.
- Tweak your content calendar: If competitors are successfully reaching audiences on emerging platforms like Threads or Bluesky, consider experimenting there to future-proof your strategy.
- Refine your brand voice: If qualitative benchmarking shows your rivals sound formal and transactional, adopt a more human-centric, relatable tone to inspire loyalty.
- Fill the service gaps: If listening data reveals competitors are slow to respond to customer inquiries, position your brand as the leader in personalized customer service—the #1 priority for consumers in 2025.
Here’s how to apply your competitive insights with Sprout:
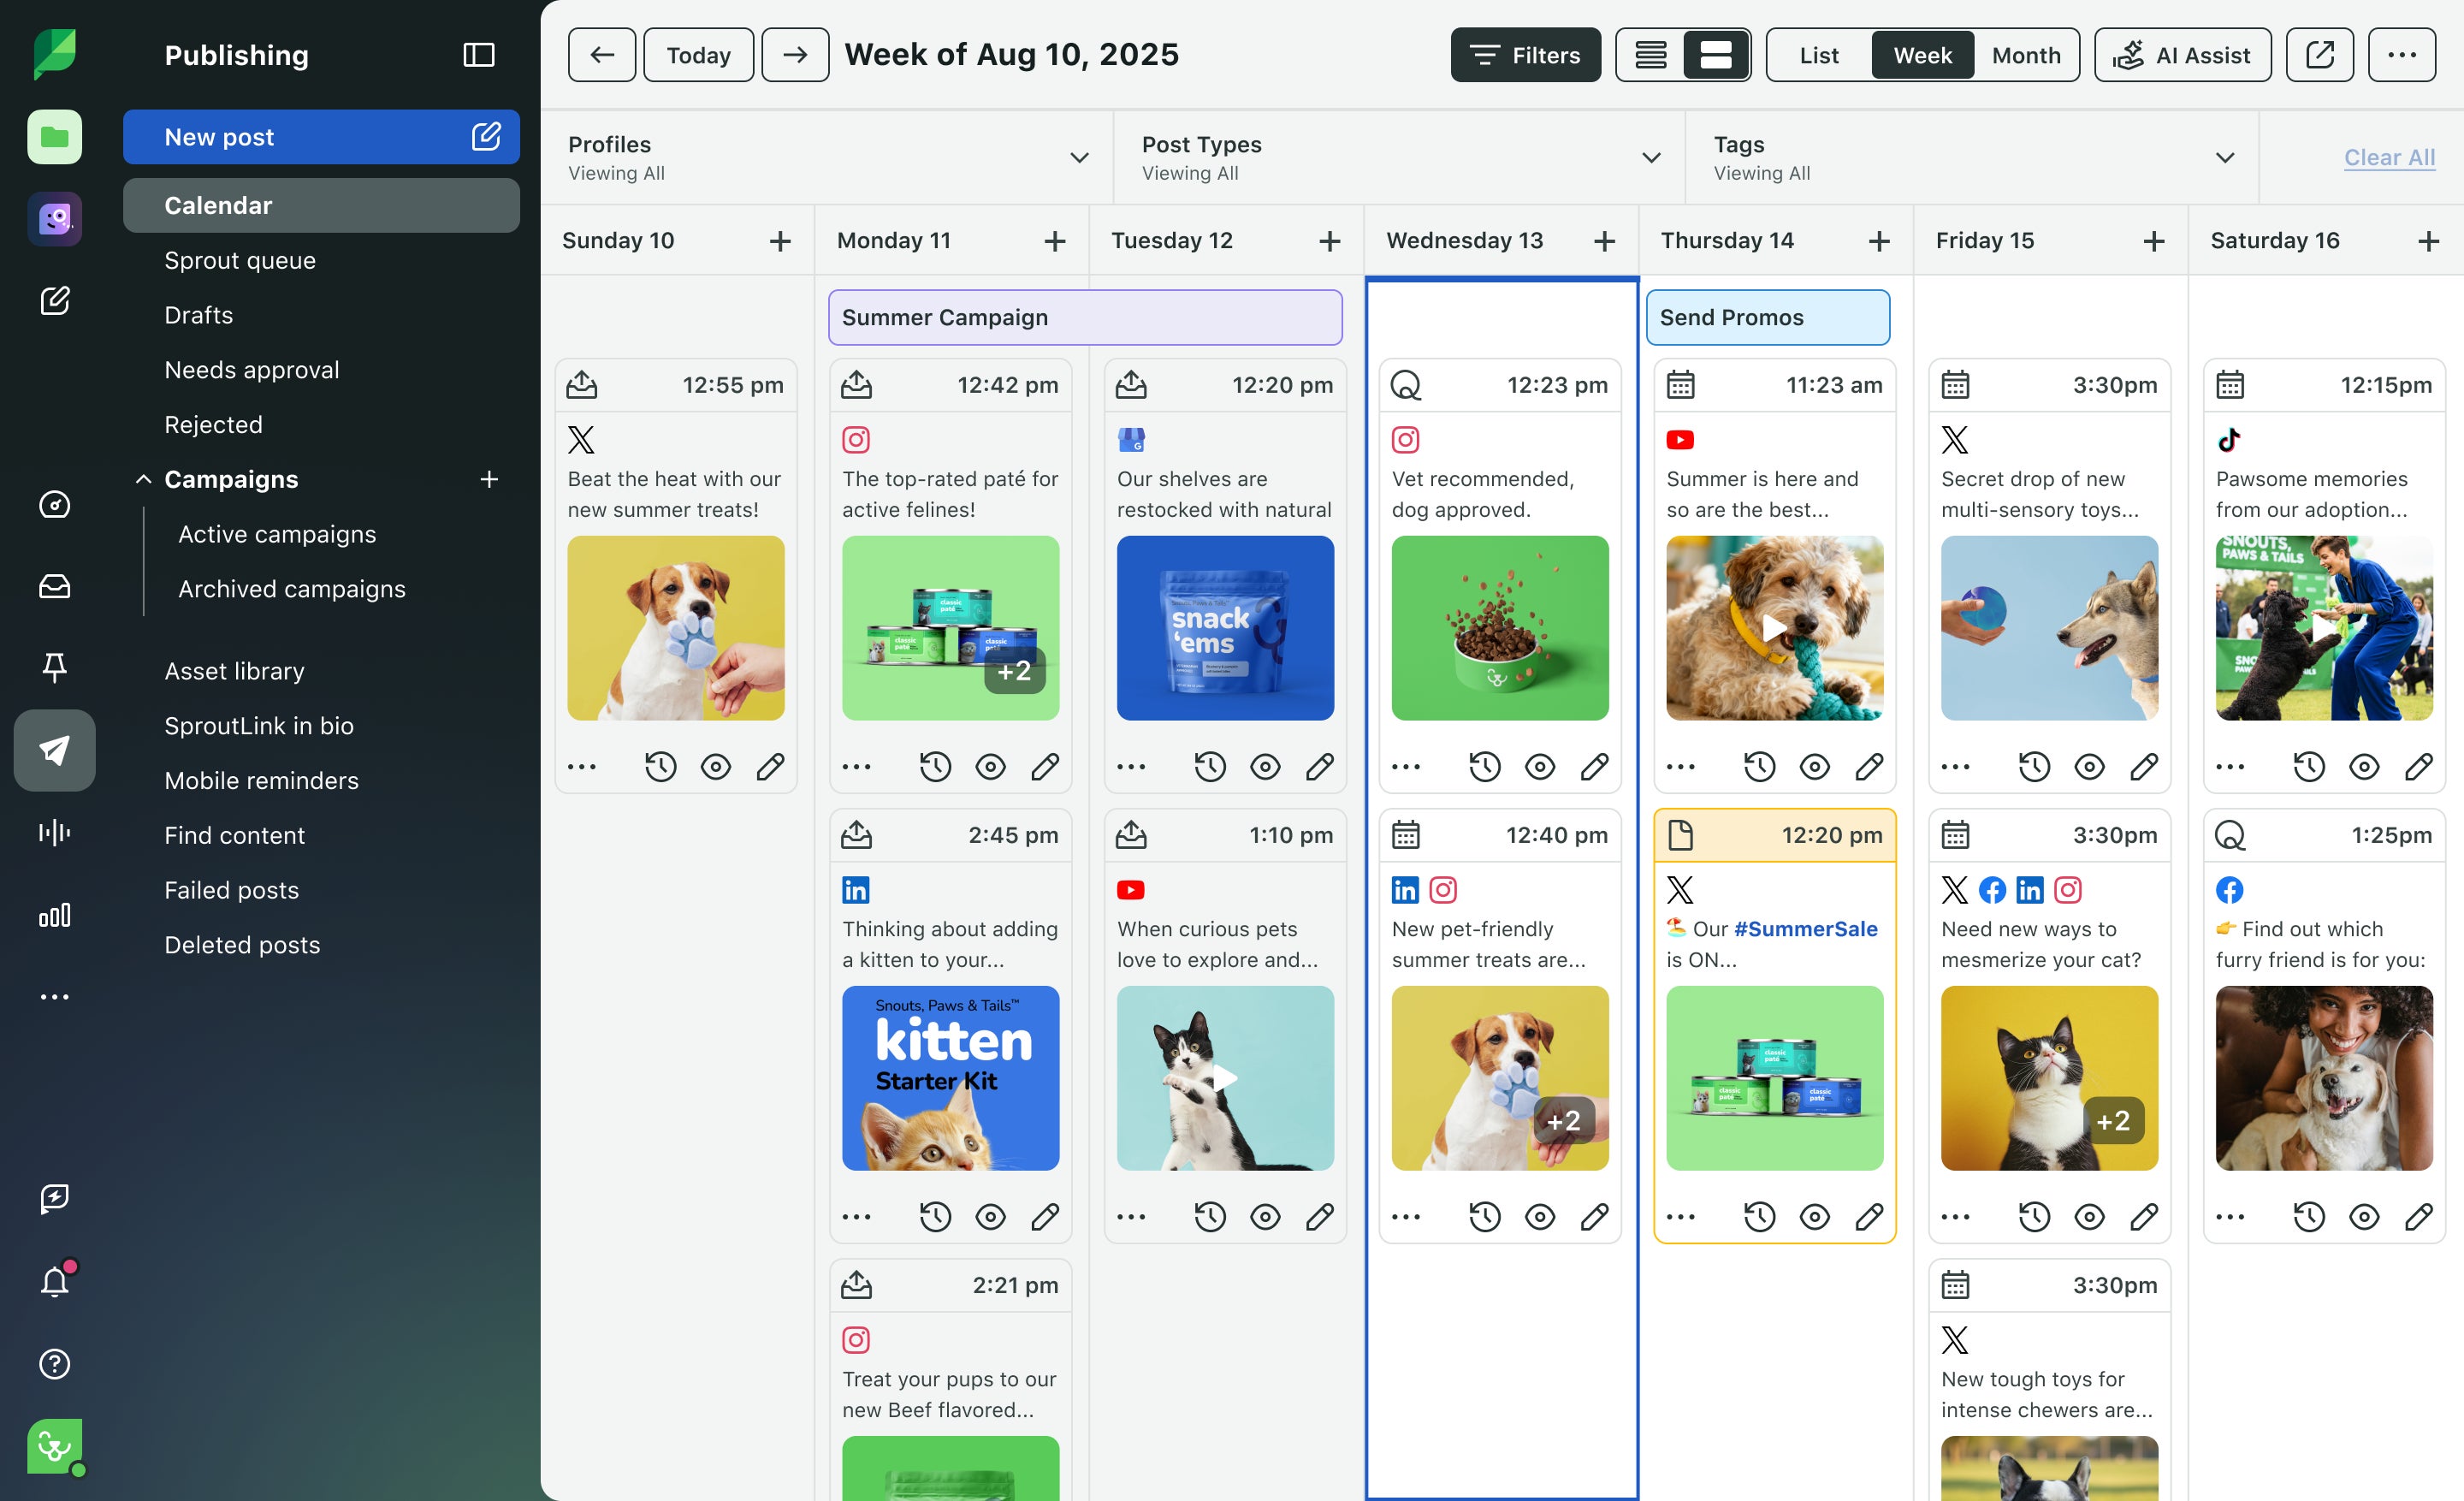
Tweak your content calendar
Adjust your publishing cadence to stay competitive if your competitors post more frequently, especially on platforms like X.
Sprout’s Publishing Calendar makes visualizing and readjusting your posting schedule easy.
Borrow high-performing content themes
Notice which content formats—like Reels, carousels or polls—drive engagement for competitors. Use these insights to refresh your content mix while staying aligned with your brand voice.
For example, if a competitor’s benchmarks show strong engagement with behind-the-scenes videos, take it as an opportunity to create similar content that humanizes your brand.
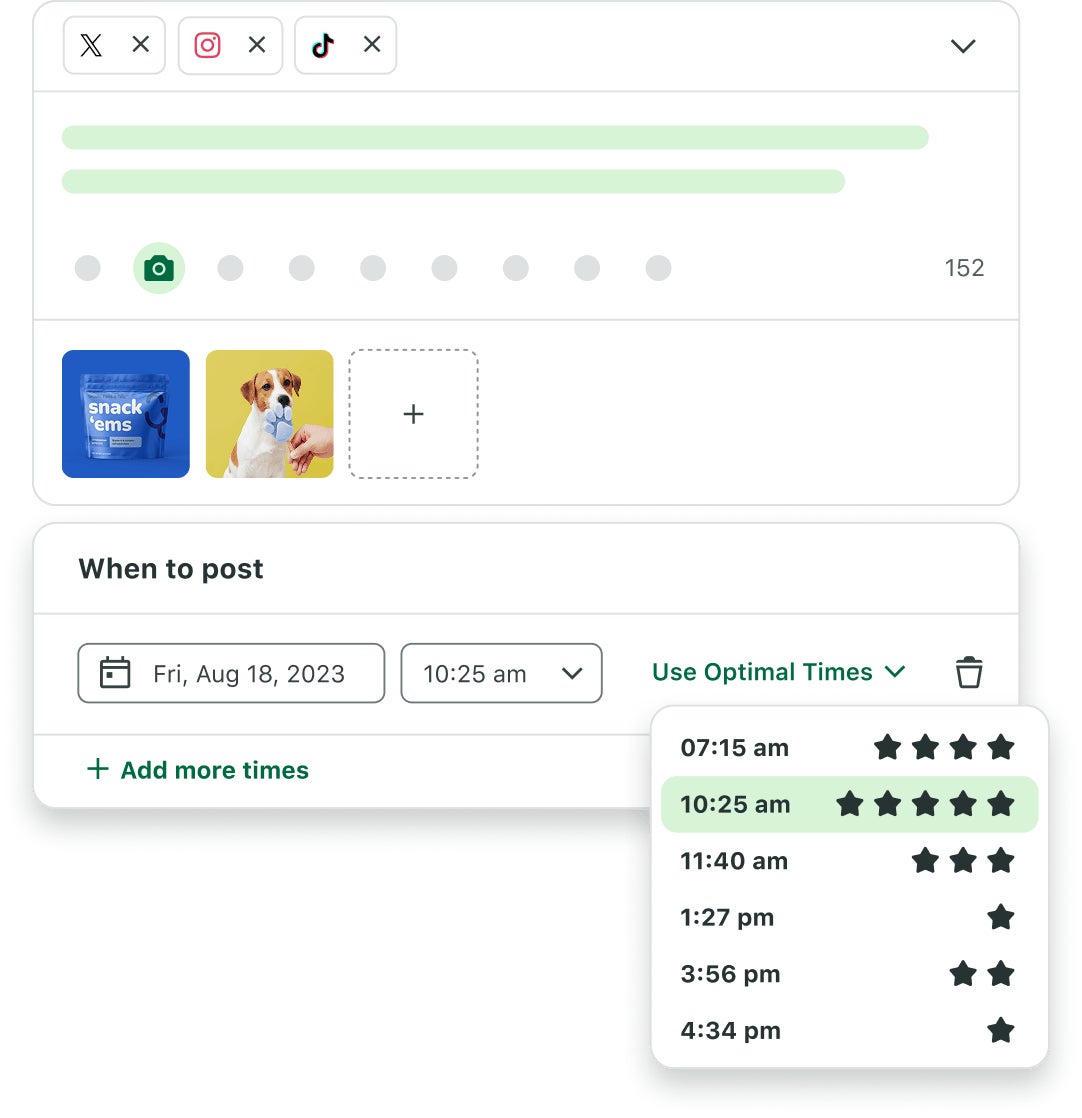
Adjust posting times based on audience behavior
Benchmark data may reveal that your competitors’ audiences are most active during evenings or weekends. Use Sprout’s Optimal Send Times capability to automatically schedule posts for peak engagement.
Refine your messaging and brand voice
Qualitative benchmarking often highlights tone gaps you can fill. Adopting a relatable, conversational tone may inspire more brand loyalty if your competitors sound formal and transactional.
For example, if competitors post only promotional updates, you could integrate storytelling content on your feeds to build an emotional connection with your audience and gain a competitive edge.
Fill in the gaps competitors miss
Listening insights do more than just measure how well your competitors are doing. They also reveal competitors’ weaknesses like customer service dissatisfaction, lack of authenticity or limited engagement.
This is your opportunity to position your brand as the solution, directly addressing pain points with relevant content, support and messaging.
Top 3 social media competitive analysis tools
Here are the top three social media competitor analysis tools that can help you strengthen your social strategy and realize your goals more effectively.
1. Sprout Social
Sprout Social transforms competitive analysis from a manual reporting burden into a high-octane engine for business growth. By centralizing data from every major network—including Facebook, Instagram, LinkedIn, TikTok, Pinterest and X—Sprout replaces fragmented research and cluttered spreadsheets with automated tracking across the entire digital landscape.
While traditional tools focus on surface-level metrics, Sprout connects your owned performance with earned media conversation data, uncovering the “why” behind market shifts.
Sprout’s Premium Analytics delivers the depth required to link social performance directly to business value. Using customizable, presentation-ready reports, you can link social impact to strategic objectives and provide the clarity needed to prove ROI to stakeholders.
The Share of Voice Report allows you to measure your brand’s presence and sentiment relative to competitors, while the Benchmark Report compares your performance against industry standards and specific competitor profiles.
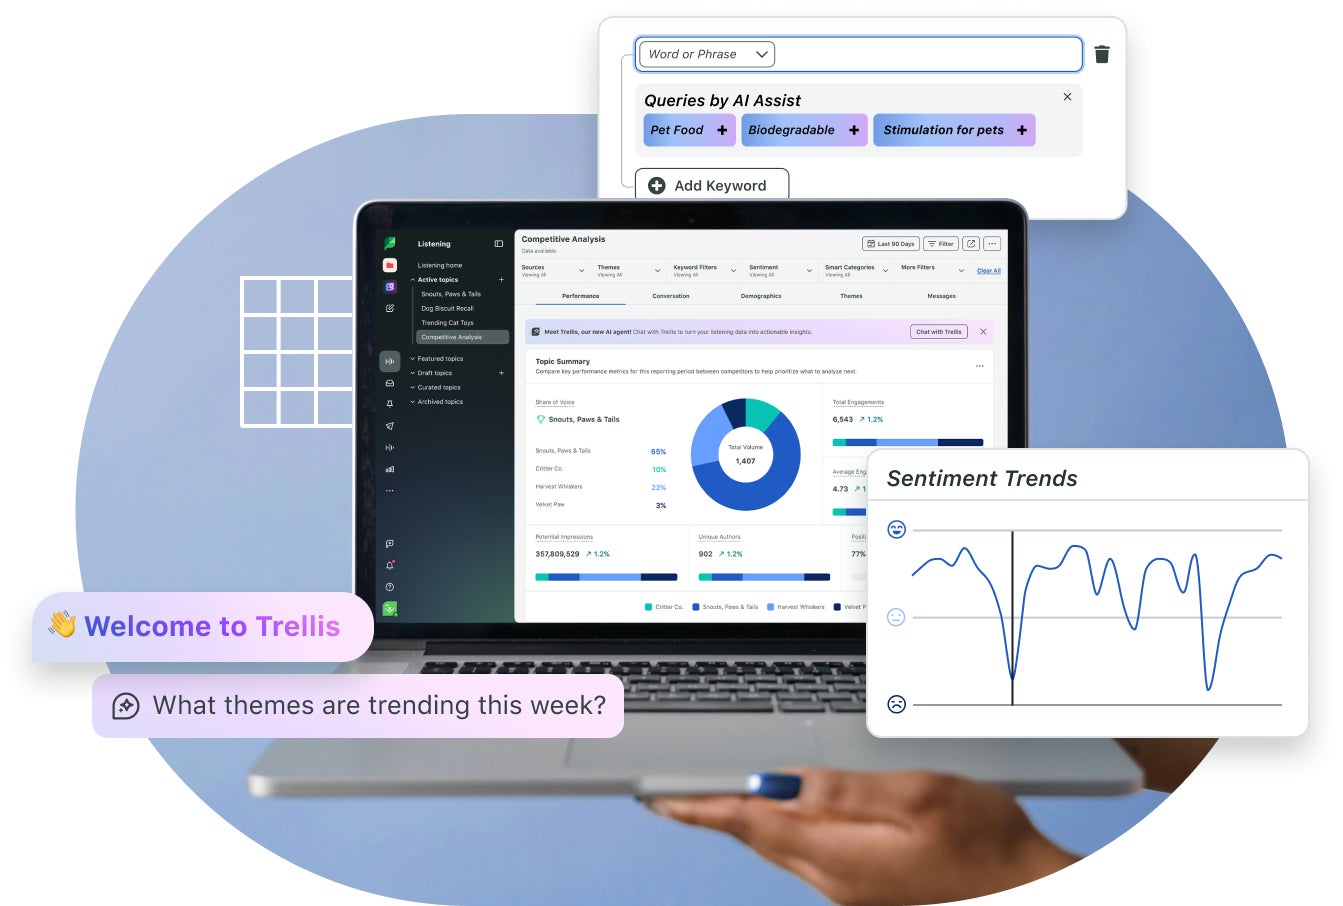
To gain a true competitive edge, Sprout’s Social Listening explores global conversations to gauge consumer sentiment around rival products and services. By tracking specific mentions and hashtags across social and the wider web, you capture critical market signals and identify gaps to differentiate your brand.
Sprout’s proprietary, human-centric AI further operationalizes these insights, using agentic capabilities to automate trend detection and surface the exact data your team needs to lead the conversation.
Request a demo to see how Sprout Social can help you command your market with smarter, faster business impact.
2. Buzzsumo
Buzzsumo helps you analyze your top-performing content so you get insights on relevant topics for your brand and your competitors. You can use the tool to monitor content performance on social accounts and across other online channels.

The tool also helps identify content formats and engagement metrics, helping you understand what strategies work in your industry. You can also monitor backlinks and social shares, providing insights into how your competitors’ content spreads. This data helps you refine your content distribution to stay competitive.
3. Social Blade
Social Blade provides detailed social media competitive analysis insights through statistics and growth trends for various social media accounts. It tracks metrics like follower counts, engagement rates and content performance across networks such as YouTube, Instagram and X. Comparing these metrics with your competitors can help you understand their social media effectiveness and identify growth patterns.

Social Blade also offers historical data and projections so you can benchmark your performance and strategize accordingly. It also simplifies tracking competitor success and adjusting your social media strategies.
Dive into the data with a social media competitive analysis
In the end, the social media competitive analysis process is all about comparing your brand’s metrics and data to the competition. Then, you can make any necessary adjustments to get a leg up.
You have the template—now, make your social media competitive analysis less daunting and more automated by adding Sprout to your toolbox. Try Sprout free for 30 days to learn how competitive analysis reports can help you uncover deeper insights to optimize your strategy.
Social media competitive analysis FAQs
What are some of the top social media competitors analysis strategies?
Leading strategies involve a mix of visual audits and automated reporting to identify content gaps and platform opportunities. Proactive brands use social listening to monitor unbranded conversations, uncovering competitor weaknesses in customer care or authenticity they can solve.
What are the best social media competitive benchmarking techniques?
The most effective techniques combine quantitative data, like engagement rates and posting frequency, with qualitative analysis of brand persona. Benchmarking against industry leaders helps you set realistic growth goals and refine your messaging to better resonate with shared audiences.
What competitive analysis metrics for social media should I pay attention to?
Focus on metrics that reveal impact: share of voice, engagement per post and follower growth trends. Tracking customer sentiment and response times is also critical, as 73% of consumers will switch to a competitor if a brand fails to respond.

Share