Reach vs. impressions vs. engagement: What’s the difference?

Written by Jamia Kenan
Published on July 7, 2026
Reading time 8 minutes

Table of Contents
Confusing reach and impressions doesn’t just skew your reports—it derails your social strategy.
Reach, impressions and engagement all matter, but they tell different stories about your content’s performance. To build a strategy that drives real business impact, you need to understand what each metric reveals and how they differ across social media platforms. Mastering these metrics is foundational to effective social media analytics—the practice of measuring, analyzing and acting on your social performance data to improve results over time.
Reach vs. impressions vs. engagement
Reach is the total number of unique users who see your content. Impressions are the total number of times your content is displayed, including every repeat view from the same person, regardless of whether it was clicked. Engagement is the total number of interactions users have with your content, including likes, comments, shares and clicks.
| Metric | What it measures | Counts duplicates? |
|---|---|---|
| Reach | Unique users who see your content | No. Each user counted once. |
| Impressions | Total times your content is displayed | Yes. Same user counted multiple times. |
| Engagement | Total interactions with your content | Yes. All interactions counted. |
Impressions measure every instance your post appears on a screen, whether or not the viewer acts on it. A single user scrolling past your post three times in one day generates three impressions, but counts only once toward your reach total.
Let’s run the numbers: You publish one post to 100 followers, 90 of whom are active that day. Your reach is 90. But if each of those 90 users scrolls past your post twice, your impression count climbs to 180. When evaluating impressions vs. reach, remember that impressions always meet or exceed reach—never the other way around.
Engagement goes further than either metric. If that same post earns 36 likes, seven comments and two shares, your total engagement is 45. Every interaction counts, even multiple interactions from the same user. High engagement signals that your content moves people to act, not just scroll.
Impressions also scale beyond your follower count. Each share exposes your post to a new audience, generating additional impressions from users who don’t follow you at all. Notice in the example below how five shares extend the post’s visibility well beyond its original reach.

Engagement is your most strategic metric. Reach and impressions tell you how many people saw your content. Engagement tells you how many people cared enough to respond. Engagement rate—the percentage of people who engaged relative to your reach or impressions—is the metric that ties all three together. A post with 10,000 impressions and 500 engagements has a 5% engagement rate. That number tells you more about content quality than either reach or impressions alone.
According to the 2025 Sprout Social Index™, overall engagement is the primary metric marketing leaders use to measure social media success, and brands that earn it are far more likely to convert viewers into customers.
Reach vs. impressions vs. engagement by social media platform
Each major platform measures reach, impressions and engagement differently. Mastering these distinctions allows you to interpret your analytics with precision and build a strategy grounded in hard data, not assumptions.
| Platform | Reach | Impressions | Key engagement metrics |
|---|---|---|---|
| Organic, paid and viral (unique people) | Organic, paid and viral (total displays) | Likes, comments, shares, clicks | |
| Unique accounts reached (posts, Stories, Reels) | Total times content was seen, including repeat views | Likes, shares, saves, Story replies | |
| TikTok | Unique accounts that watched a video (estimated) | Sum of all video views, including repeat views | Likes, comments, shares, downloads, completion rate |
| Members reached (unique people who saw your content); no separate “reach” label used | Times a post, video or article appeared in a feed | Likes, shares, comments, post clicks | |
| YouTube | No single reach metric; traffic sources available | Times 50%+ of thumbnail was visible for 1+ second | Likes, shares, comments, watch time, subscribers gained |
| X (formerly known as Twitter) | Not natively tracked | Times a post appeared in a feed or search results | Likes, reposts, replies, post clicks |
Facebook: Reach, impressions and engagement
Facebook breaks reach and impressions into three categories each. Facebook reach tracks unique people who saw your content:
- Organic: Unique people who saw your content for free.
- Paid: Unique people who saw your paid content, such as a Facebook Ad.
- Viral: Unique people who saw your post or Page mentioned in a story published by someone else through likes, shares or comments.
Facebook impressions track total displays across the same three categories, viewable in Sprout Social’s Facebook Pages report:
- Organic: Times your content appeared in the Feed or on your Page.
- Paid: Times your paid content was displayed.
- Viral: Times content associated with your Page appeared in a story published by another user.
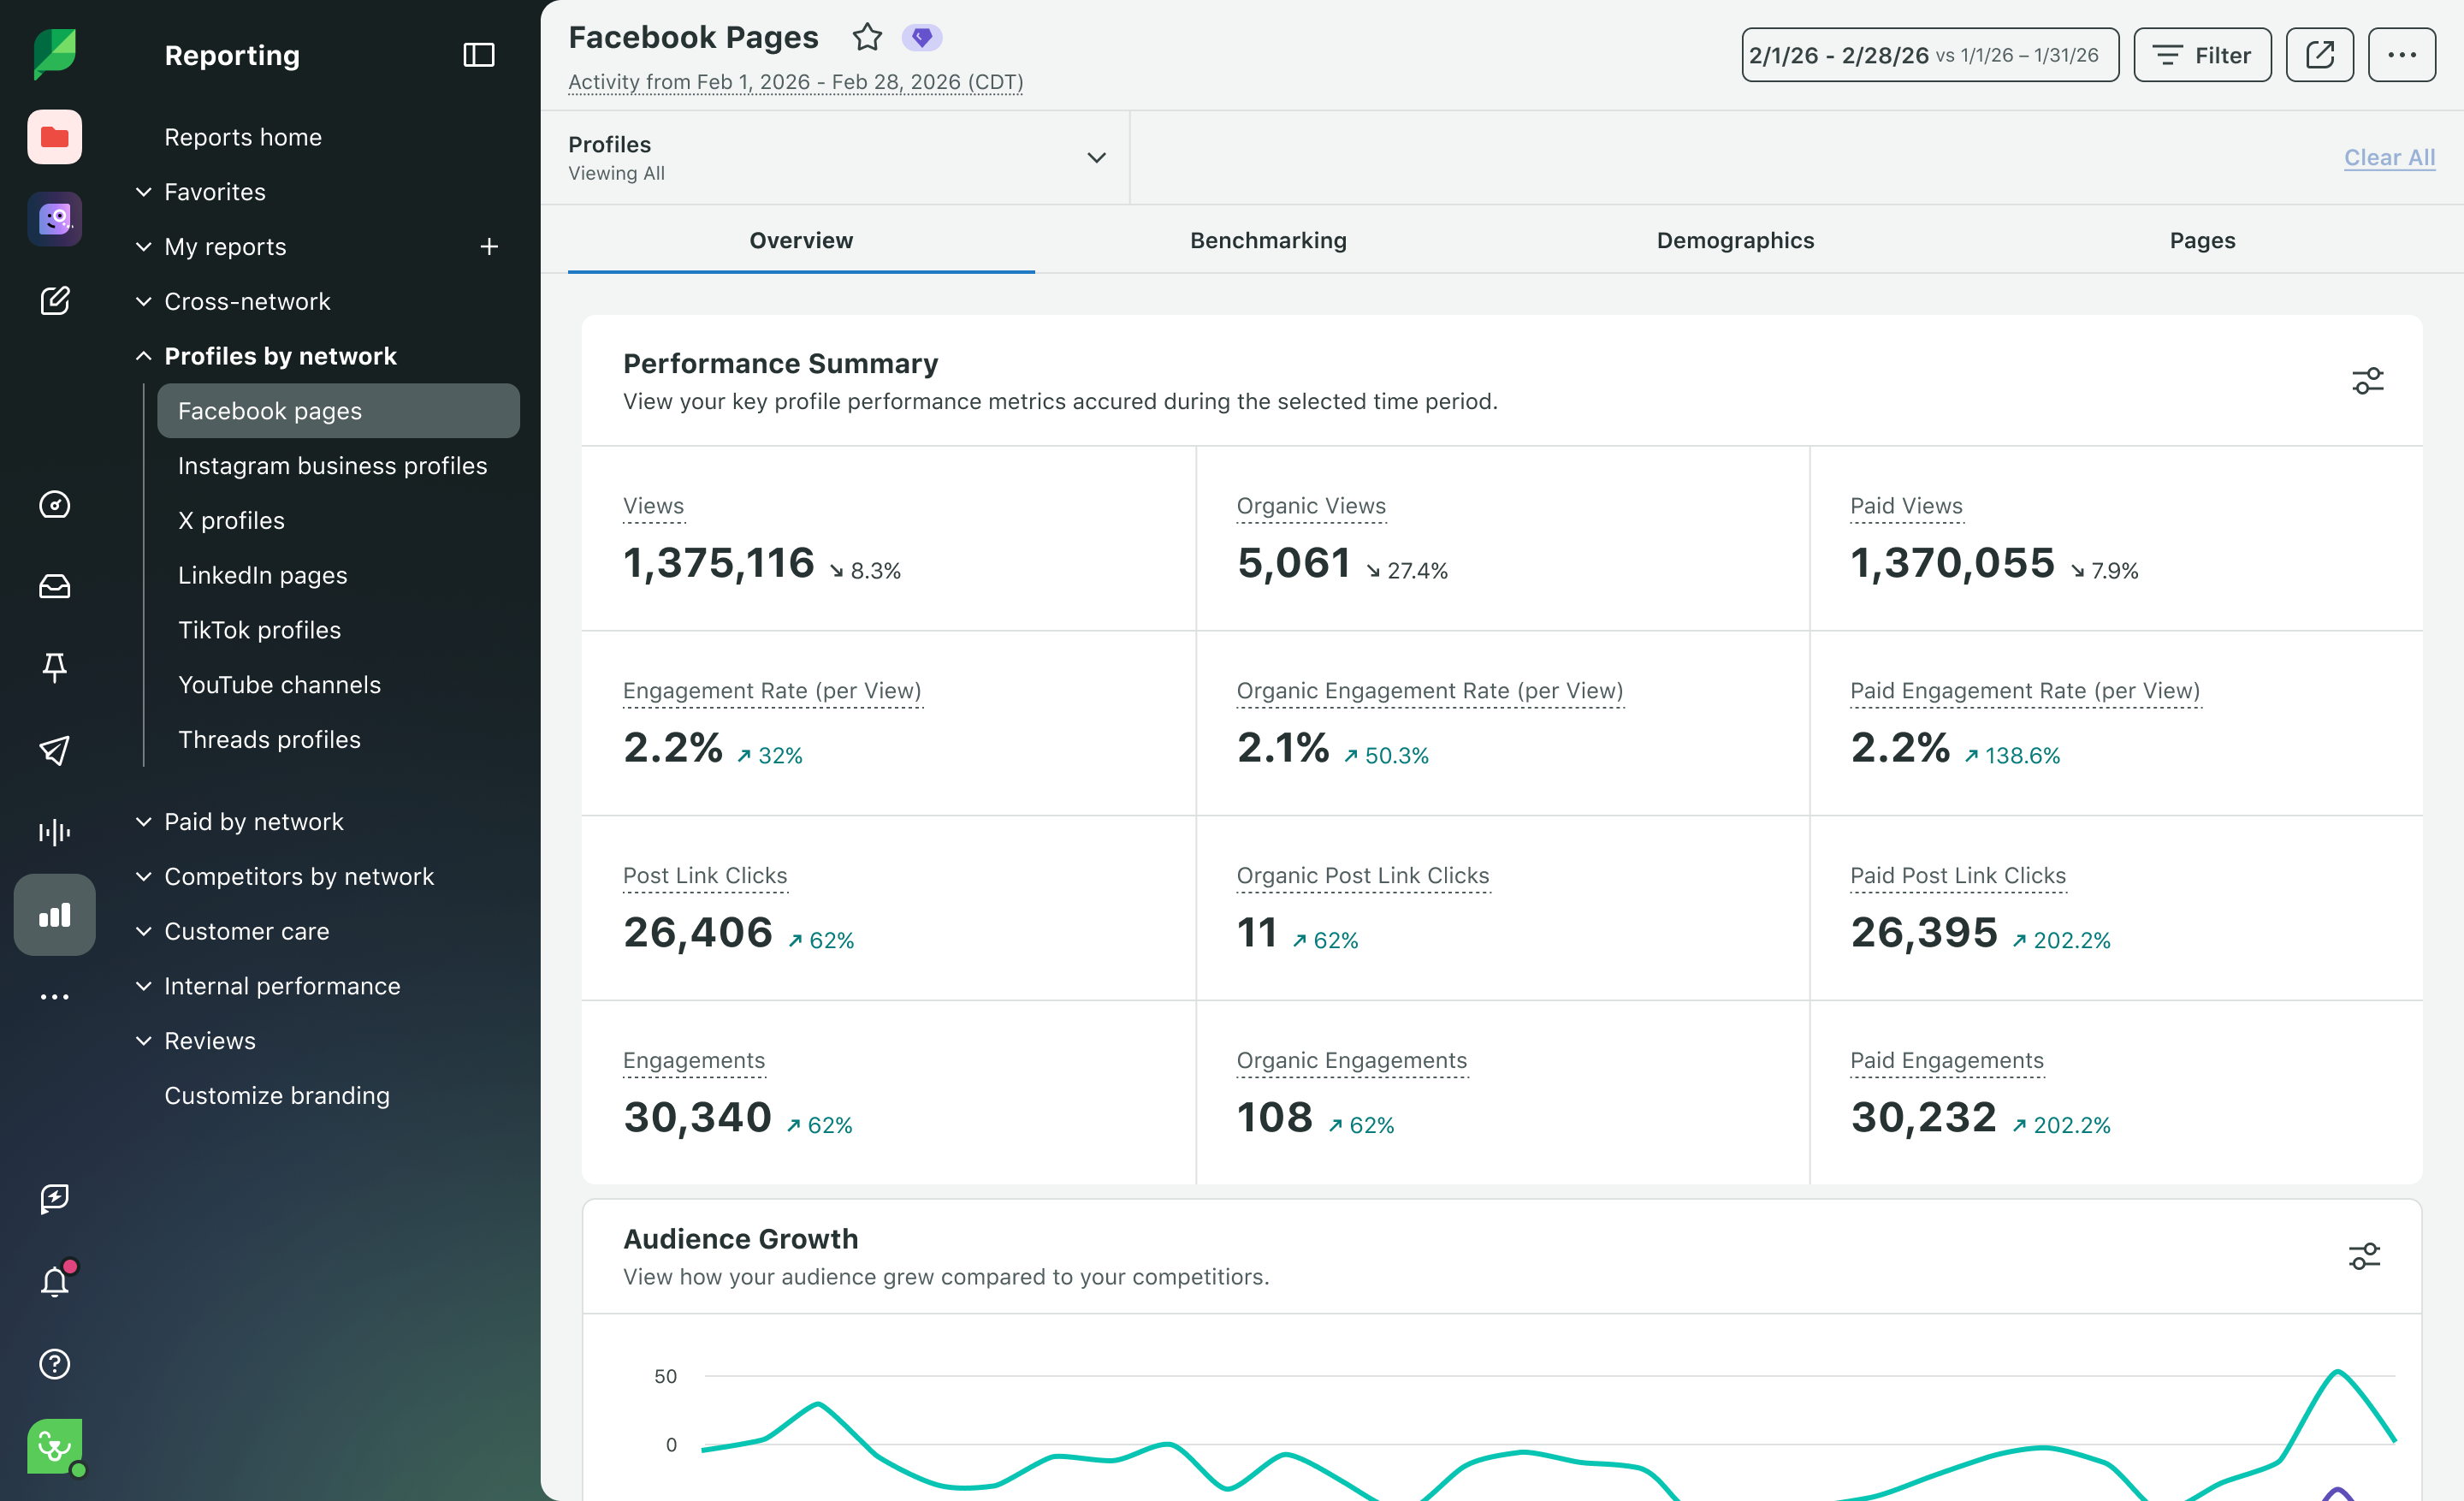
Facebook engagement measures how many users engaged with your content, including likes, comments, shares and clicks.
Instagram: Reach, impressions and engagement
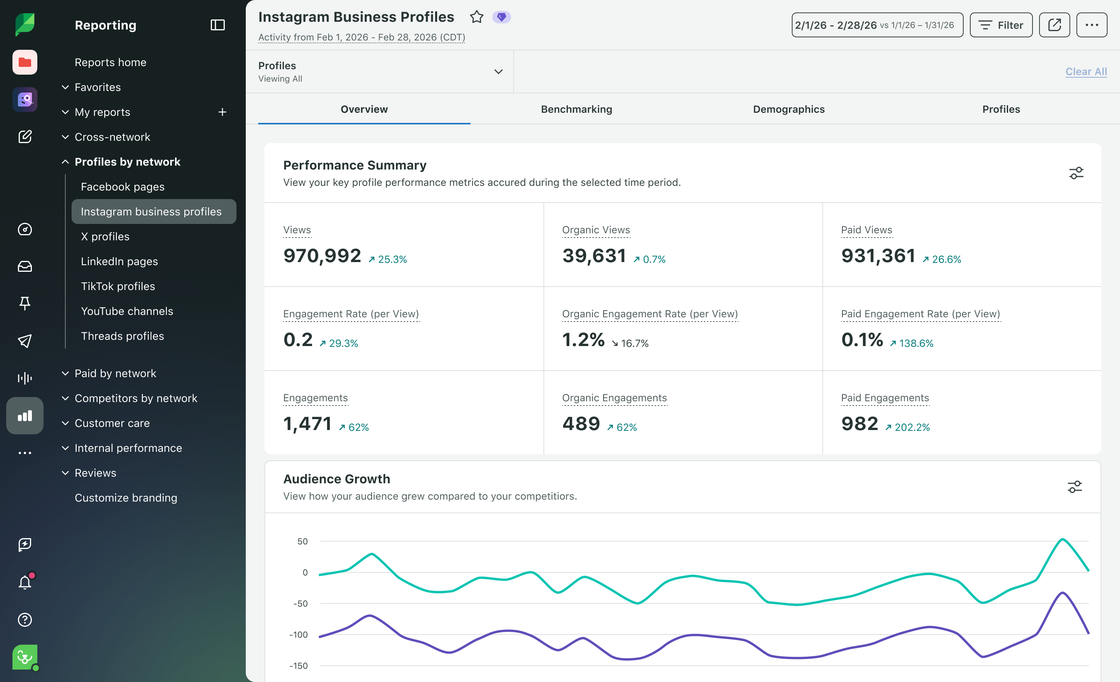
Instagram calls reach “accounts reached,” which is the total number of unique accounts that saw your content at least once. For Reels, accounts reached includes any unique account that had the video appear on screen, regardless of whether they played it.
Instagram impressions count total views, including multiple views from the same account. With Sprout Social or native analytics, you view demographic breakdowns for accounts reached by city, country, age range and gender.
Instagram engagement tracks actions taken on your posts:
- Likes
- Shares
- Saves
- Replies to Stories
TikTok: Reach, impressions and engagement
TikTok defines reach as the total number of unique accounts that watched a video. Impressions are the sum of all video views, including repeat views from the same account. TikTok treats reach as an estimated metric in native analytics, so the number isn’t exact.
TikTok engagement metrics include:
- Likes
- Comments
- Shares
- Downloads
- Video completion rates
LinkedIn: Reach, impressions and engagement
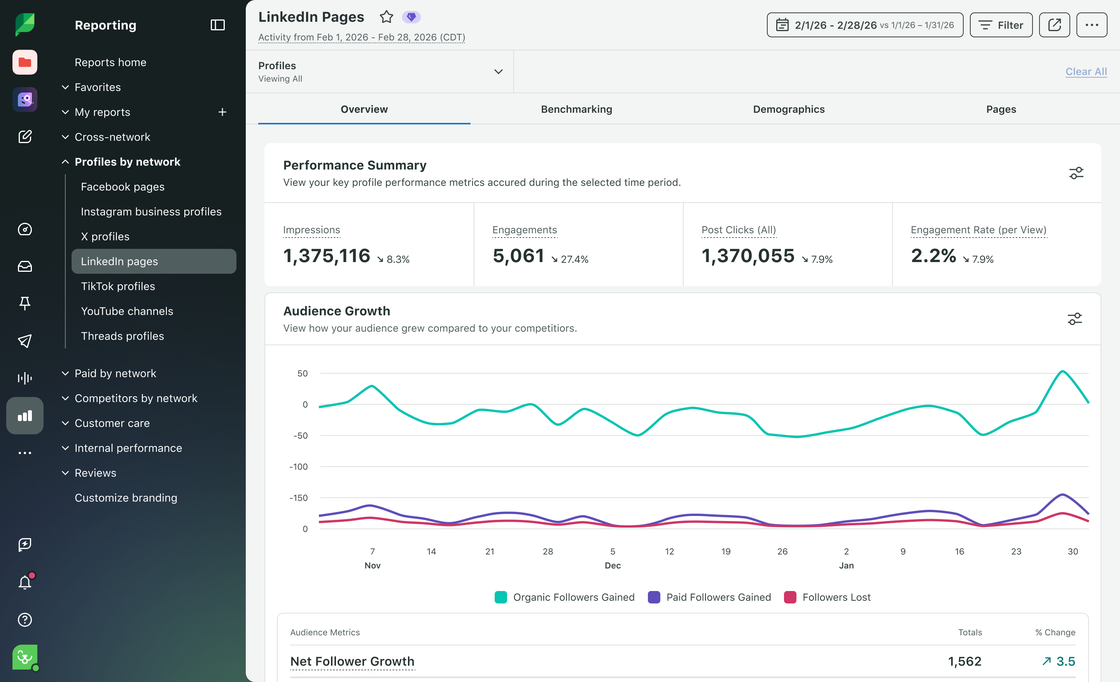
LinkedIn doesn’t use the label “reach” in its native dashboard. Instead, it reports members reached—the number of unique people who saw your content—making it the equivalent of reach on other networks.
LinkedIn impressions count how many times a post, video, article or update appeared in a user’s feed. But LinkedIn’s algorithm rewards engagement—so posts with more likes, comments, reposts and shares naturally earn more impressions.
LinkedIn engagement typically includes likes, shares, comments and clicks on posts or articles.
YouTube: Reach, impressions and engagement
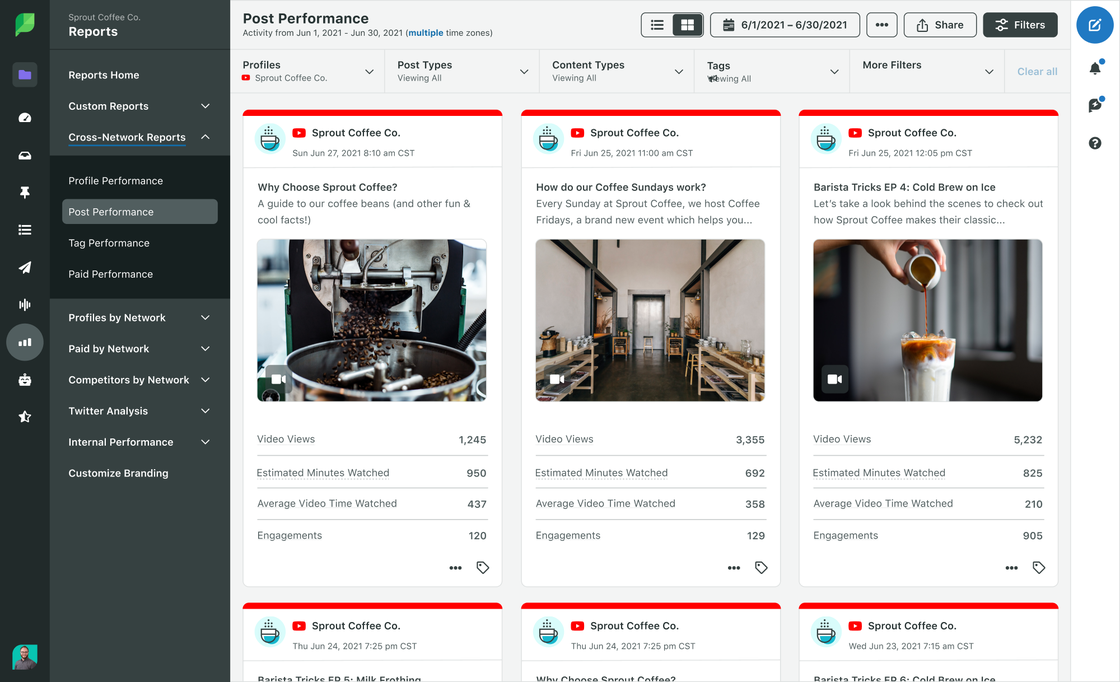
YouTube doesn’t offer a single reach metric. In YouTube Studio, the “Reach” tab surfaces traffic source types, suggested videos, external sources and playlists. YouTube impressions measure how many times at least 50% of your video thumbnail was visible on screen for at least one second—and impression click-through rate shows how often viewers watched after seeing it.
YouTube engagement is measured with:
- Likes
- Shares
- Comments
- Watch time
- Subscribers gained
X: Reach, impressions and engagement
X (formerly Twitter) doesn’t natively track reach. The platform defines impressions as any time a user sees your post in their feed or search results. When native reach data is unavailable, Sprout Social fills the gap by tracking engagement, follower growth, impressions and more in one place.
X engagement includes likes, reposts, replies and clicks on your posts.
Reach vs. impressions and your marketing strategy
Mastering the dynamics between reach and impressions gives you a direct line to your audience’s behavior—and the exact data you need to build a strategy that performs. Here’s how to put both metrics to work.
Know your target audience
Scaling your reach increases brand awareness, but reach without relevance wastes resources. Design your content strategy around your target audience’s interests to grow organic reach and build a loyal community—without depending on paid amplification.
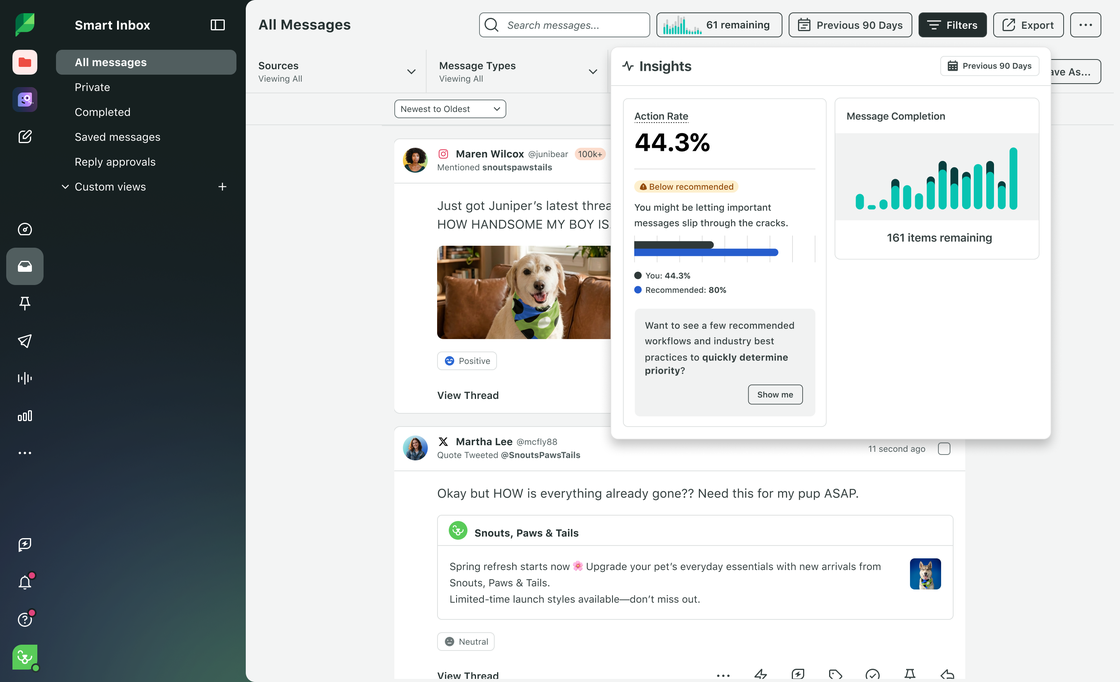
Sprout Social’s Smart Inbox surfaces the content your audience shares, likes and replies to. Tracking these engagements reveals who to target next, extending your reach with precision.
Monitor and analyze engagement metrics
Rising impressions signal that your content is surfacing more frequently in feeds—a direct indicator that your posts are optimized for the platform. If impressions fall short of your goals, audit your content for platform-specific best practices and prioritize shareable formats that spread organically.
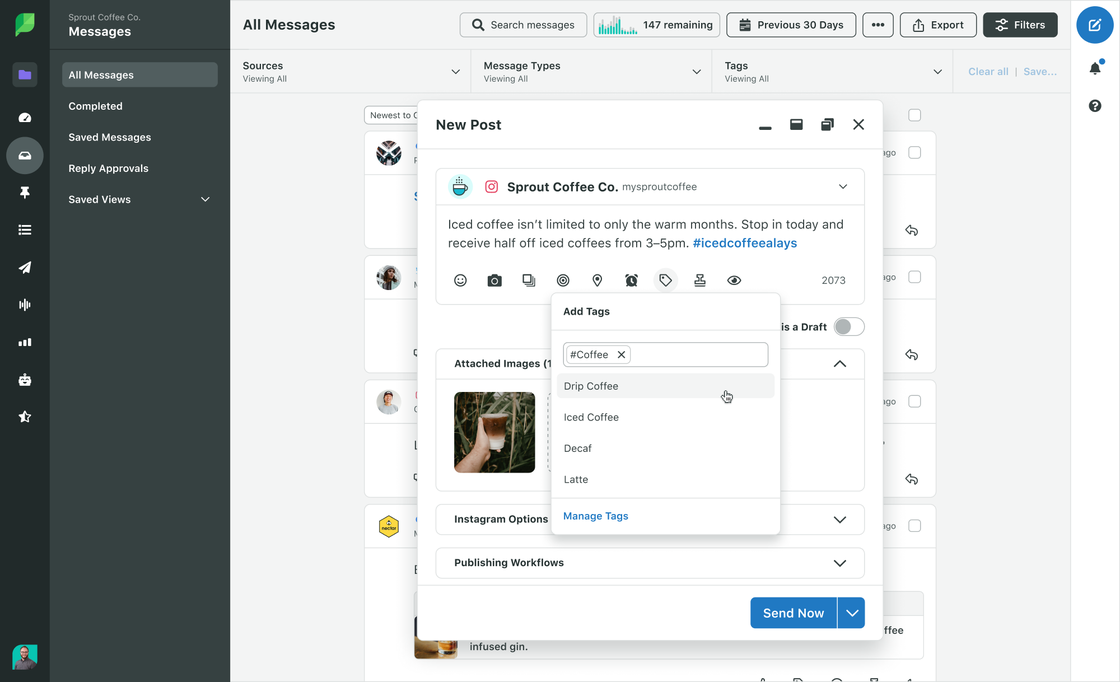
Sprout’s Tag Management makes this analysis precise. Tag posts by campaign, content format or topic, then compare reach and impressions across tags to see which categories are driving performance and which aren’t pulling their weight. When you filter by tag in your reports, optimization stops being a gut call and starts being a data call.
The brands winning on social in 2026 aren’t just tracking metrics—they’re acting on them. Consistent analysis turns reach and impressions data from a scorecard into a forward-looking strategy that compounds over time.
Which metric matters most: Reach, impressions or engagement?
The right metric depends on your specific goals:
| Metric | When it matters most | What it tells you |
|---|---|---|
| Reach | Awareness goals | How many unique people saw your content |
| Impressions | Repetition and recall goals | How often your message appeared in front of audiences |
| Engagement | Action and resonance goals | Whether your content sparked a real response |
High reach with low engagement means your content got seen but didn’t connect. High impressions with lower reach signals the same audience is seeing your content repeatedly. Strong engagement confirms your message landed.
Use reach to measure visibility, impressions to measure exposure and engagement to measure resonance. No single number tells the whole story, but together, they show where to optimize next.
How to track reach, impressions and engagement with Sprout Social
Tracking these metrics natively across multiple platforms slows you down. Each network defines them differently, every dashboard lives in a separate tab and pulling the full picture together drains time your team can’t spare.
Sprout Social consolidates reach, impressions and engagement into one reporting workflow—so you make faster decisions and spend less time chasing data. Here’s how Sprout does the heavy lifting:
- Cross-platform reports: Compare reach, impressions and engagement across Facebook, Instagram, TikTok, LinkedIn, X and YouTube in a single view—no tab-switching required.
- Trellis AI: Ask natural-language questions across your publishing, inbox and reporting data. Instead of building a report, you ask: “Which posts had the highest reach last month?” and get the answer in seconds.
- Tag-based analysis: Apply tags to campaigns, content formats or themes and compare reach and impressions across them. Know which creative approach is driving visibility.
- ViralPost®: Sprout’s AI-powered send-time optimization publishes your content when your specific audience is most active, increasing the reach each post earns.
The result: less manual reporting, sharper clarity and a confident answer when leadership asks what social is driving for the business.
Turn your reach and impressions data into results
Reach, impressions and engagement don’t tell three separate stories. They tell one story, and reading it correctly is what separates brands that grow from brands that guess.
Together, these metrics reveal whether your content expands awareness, reinforces your message or builds genuine connection with your audience. That’s the foundation of a strategy built on evidence, not assumptions.
Again, according to the 2025 Sprout Social Index™, overall engagement is the primary metric marketing leaders use to measure social success—and brands that track reach alongside impressions and engagement make faster, more confident decisions.
Sprout Social gives you one place to measure all three metrics across every social media platform, so you stop reporting on the past and start shaping what happens next. Start your free trial and turn your data into your biggest competitive advantage.
FAQs about reach and impressions
What is a good reach-to-impressions ratio?
A healthy ratio depends on the social media platform, content format and campaign goal. When evaluating impressions vs. reach, look at the gap between the two.. When impressions rise much faster than reach, the same people are seeing your content repeatedly. When the numbers are closer together, your content is reaching more unique viewers.
What does 3+ reach mean?
In paid social reporting, 3+ reach means the same person has seen your ad at least three times. High frequency builds recall, but watch for diminishing returns as ad fatigue sets in.
What is the difference between reach and impressions on Meta?
On Meta platforms, reach counts the number of unique people who saw your content, while impressions count the total number of times your content was displayed. One person generates multiple impressions but counts once toward reach.
What's the difference between impressions and members reached on LinkedIn?
On LinkedIn, members reached describes the unique people who saw your content, making it equivalent to reach on other social media platforms. Impressions still count the total number of times the content was displayed.




Share