
TikTok Analytics
TikTok analytics: data-driven strategies for growth
This guide lays out how to use TikTok analytics to improve your content strategy. Learn what metrics to track—from video views to follower demographics—and how to leverage this data to maximize your ROI.
Read on to master your performance tracking, then launch our free trial to turn these real-time insights into sustainable brand growth.
Reading time 12 minutes
Published on October 23, 2025
Table of Contents
Summary
- TikTok Analytics provides insights on video views, follower demographics and engagement metrics. It's important to track these metrics to understand what content resonates with your audience.
- Use TikTok data to create targeted TikTok content and track its performance over time. Analyze follower demographics (age, gender, location) to tailor content to your target market and see when they're most active.
- Use TikTok data to inform your content calendar, posting times and identify collaboration opportunities with relevant influencers.
- Monitoring your TikTok data alongside other platforms will help you get a holistic view of your performance. Using a social media management tool like Sprout Social centralizes your network analytics in one place.
TikTok is one of the world’s most popular social media platforms. With over 1 billion users, TikTok offers brands a massive opportunity to connect with audiences in authentic, creative ways. TikTok analytics let you see which content resonates with your audience the most.
Beyond content preferences, TikTok analytics reveal where your followers are located, age demographics, their most active times on the platform and relevant metrics like views and impressions. These insights will help you craft content that connects with your target audiences and expands your reach. It also gives you a clear answer into whether your efforts are paying off.
In this guide, we break down how to access and understand your TikTok analytics natively and foundational metrics to measure your success. We’ll also share what to consider when choosing a TikTok analytics tool like Sprout Social and how to use analytics for a better return on investment (ROI).
What is TikTok analytics?
TikTok analytics is the comprehensive data dashboard that tracks your video performance, audience behavior and engagement patterns on TikTok. This includes essential metrics like views, likes, comments, shares, follower demographics, peak activity times and content reach across different regions. These insights transform guesswork into strategy, enabling you to create content that drives real business results through your TikTok marketing efforts.
Why is TikTok analytics important for your business?
Social media moves fast and TikTok moves faster. TikTok business analytics eliminates the guesswork by revealing exactly what drives TikTok engagement and growth. Beyond surface-level trends, analytics uncover the behavioral patterns that separate viral content from forgotten posts.
TikTok analytics delivers measurable business impact through these core advantages:
- Strategic Content Creation: Identify your highest-performing content types and optimal posting times
- Audience Intelligence: Understand demographics, behaviors and engagement patterns of your target market
- ROI Validation: Present concrete data that justifies social media investment to stakeholders
Stop guessing what works and start scaling your TikTok ROI with centralized data.
Gaining full visibility into your data is just the first step. Here is how that clarity translates into real business growth:
1. Create a data-driven content strategy
TikTok analytics will help you create a data-driven TikTok marketing strategy by pinpointing your most engaging videos and uncovering information about your audience. Learn when they’re the most active and what regions they’re from so you can tailor content to their preferences. The insights you receive can inform your content topics, best posting times, relevant trends, potential content creators and influencers to collaborate with and more.
2. Connect with your target audience
The community-oriented nature of TikTok allows brands to cater to their niche and target audience. TikTok analytics give you the insights needed to create content that resonates and engages your target audience. You can also optimize your conversion strategy. For example, you can view TikTok hashtags to determine relevant trends or to inspire TikTok challenges and campaigns.
3. Prove return on investment
TikTok analytics provides the evidence you need to prove your return on investment. If you’re able to create a compelling data story, it’ll be easier to justify a need for more resources for your campaigns.
TikTok analytics requirements and account setup
Accessing TikTok’s full analytics suite requires a Business Account. Switching over takes only seconds and serves as your first step to leveraging TikTok for business, unlocking the essential data foundation needed for strategic growth.
Whether you have ten followers or ten million, you get access to the same foundational analytics once you have a Business Account. This levels the playing field and gives every brand the power to grow with data from day one.
How to access native TikTok analytics
Want to see how to check TikTok analytics natively? Here’s how to see TikTok analytics via mobile and desktop, step-by-step.
How to access TikTok analytics from mobile
- Tap the profile icon in the bottom right-hand corner.
- Tap the three vertical lines in the upper right and click TikTok Studio or Business Suite. Tap Analytics.

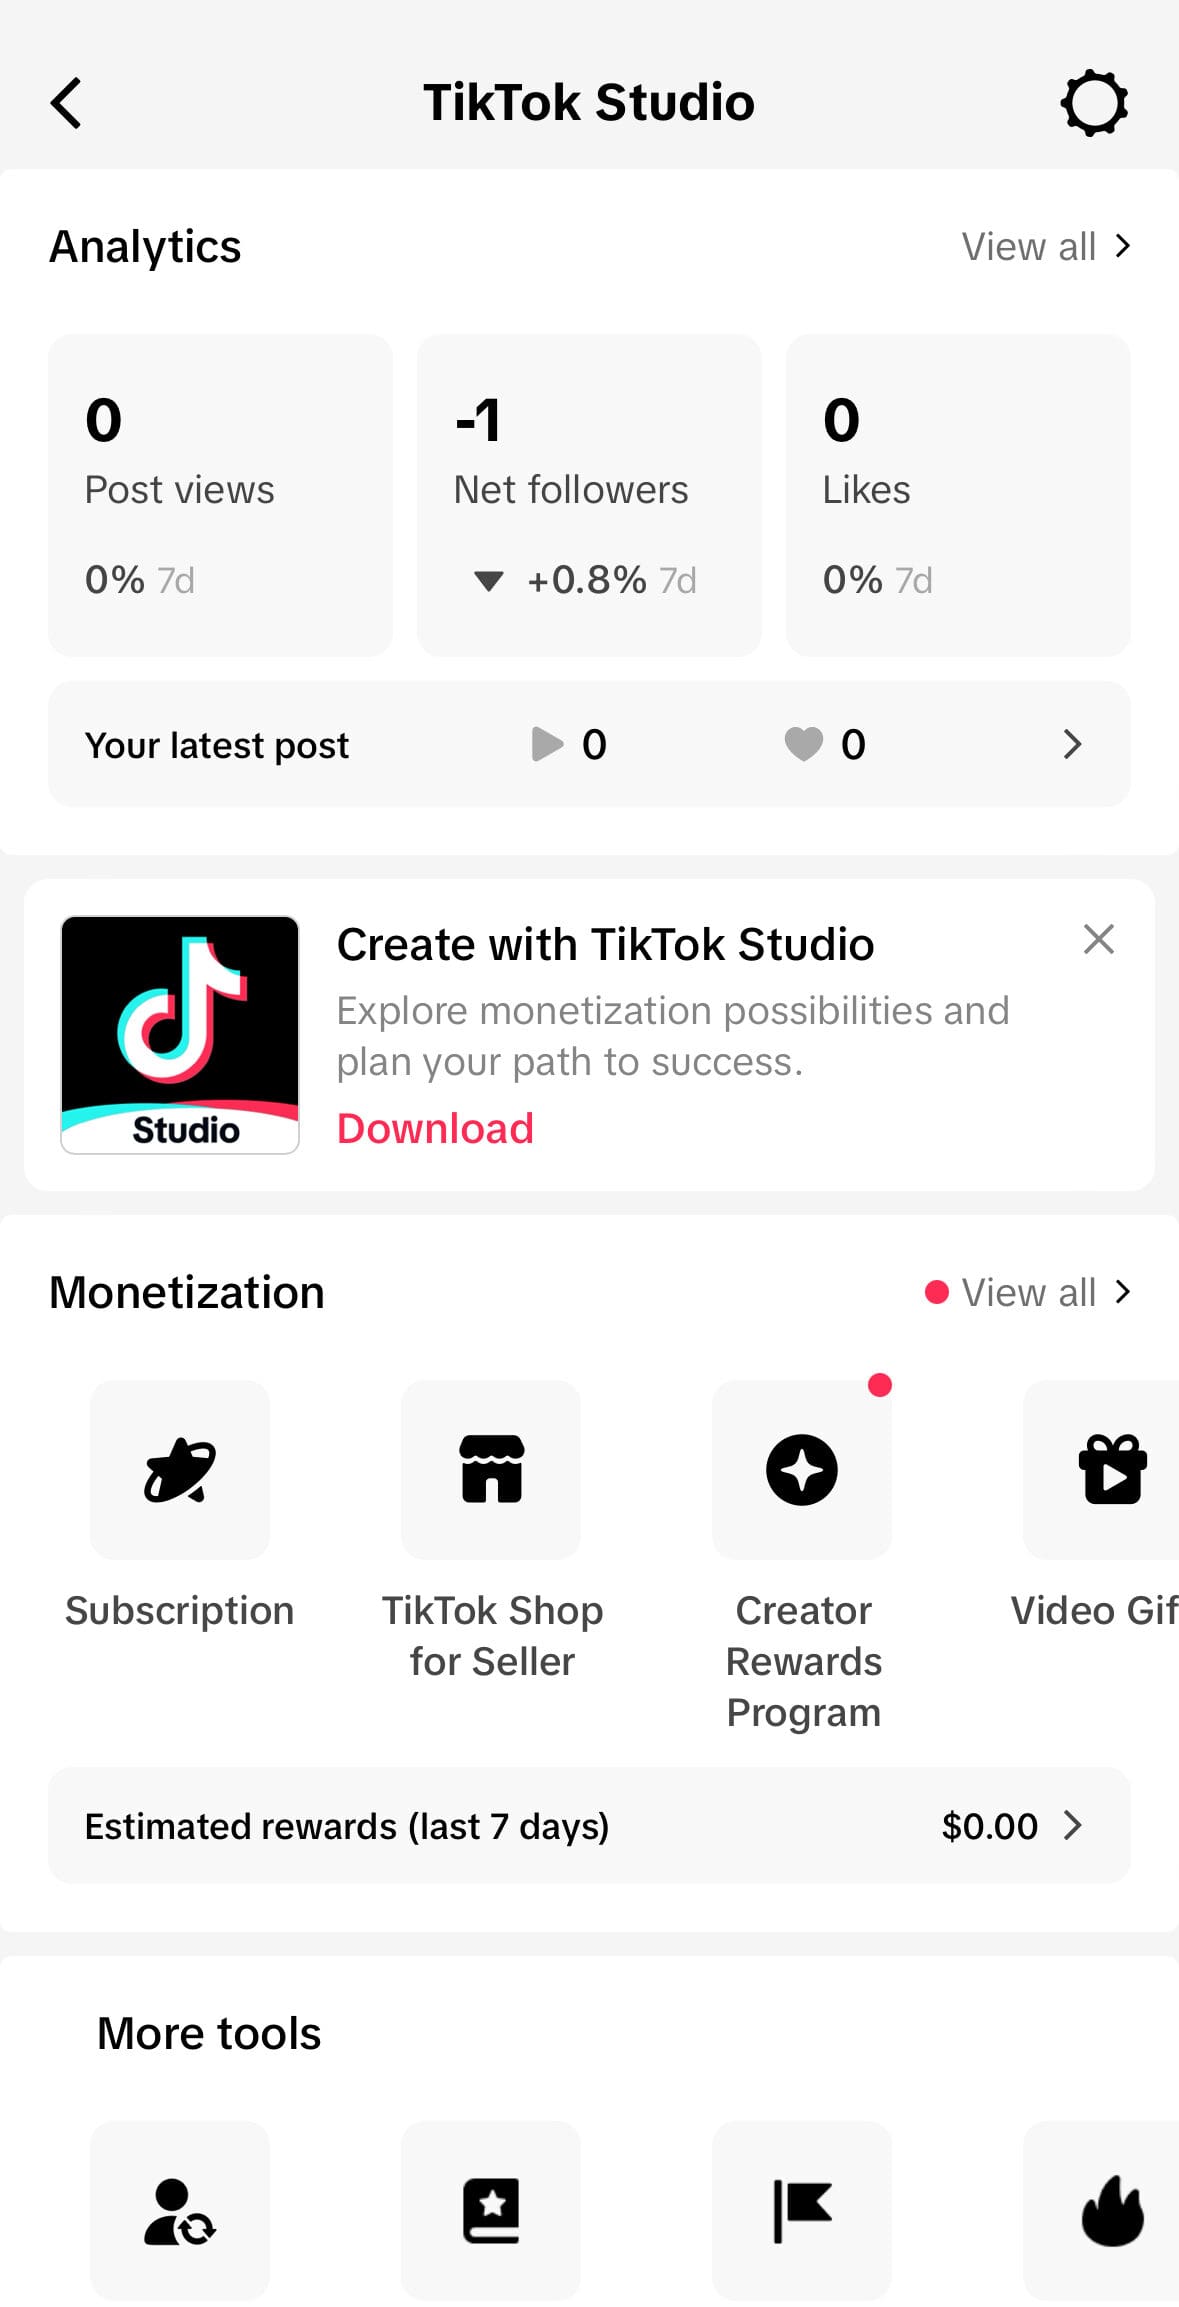
3. In TikTok Studio, you can see post views, net followers and Likes. You can also see engagement metrics for your latest post in the Analytics section at the top of the screen. Tap View all to see more metrics.
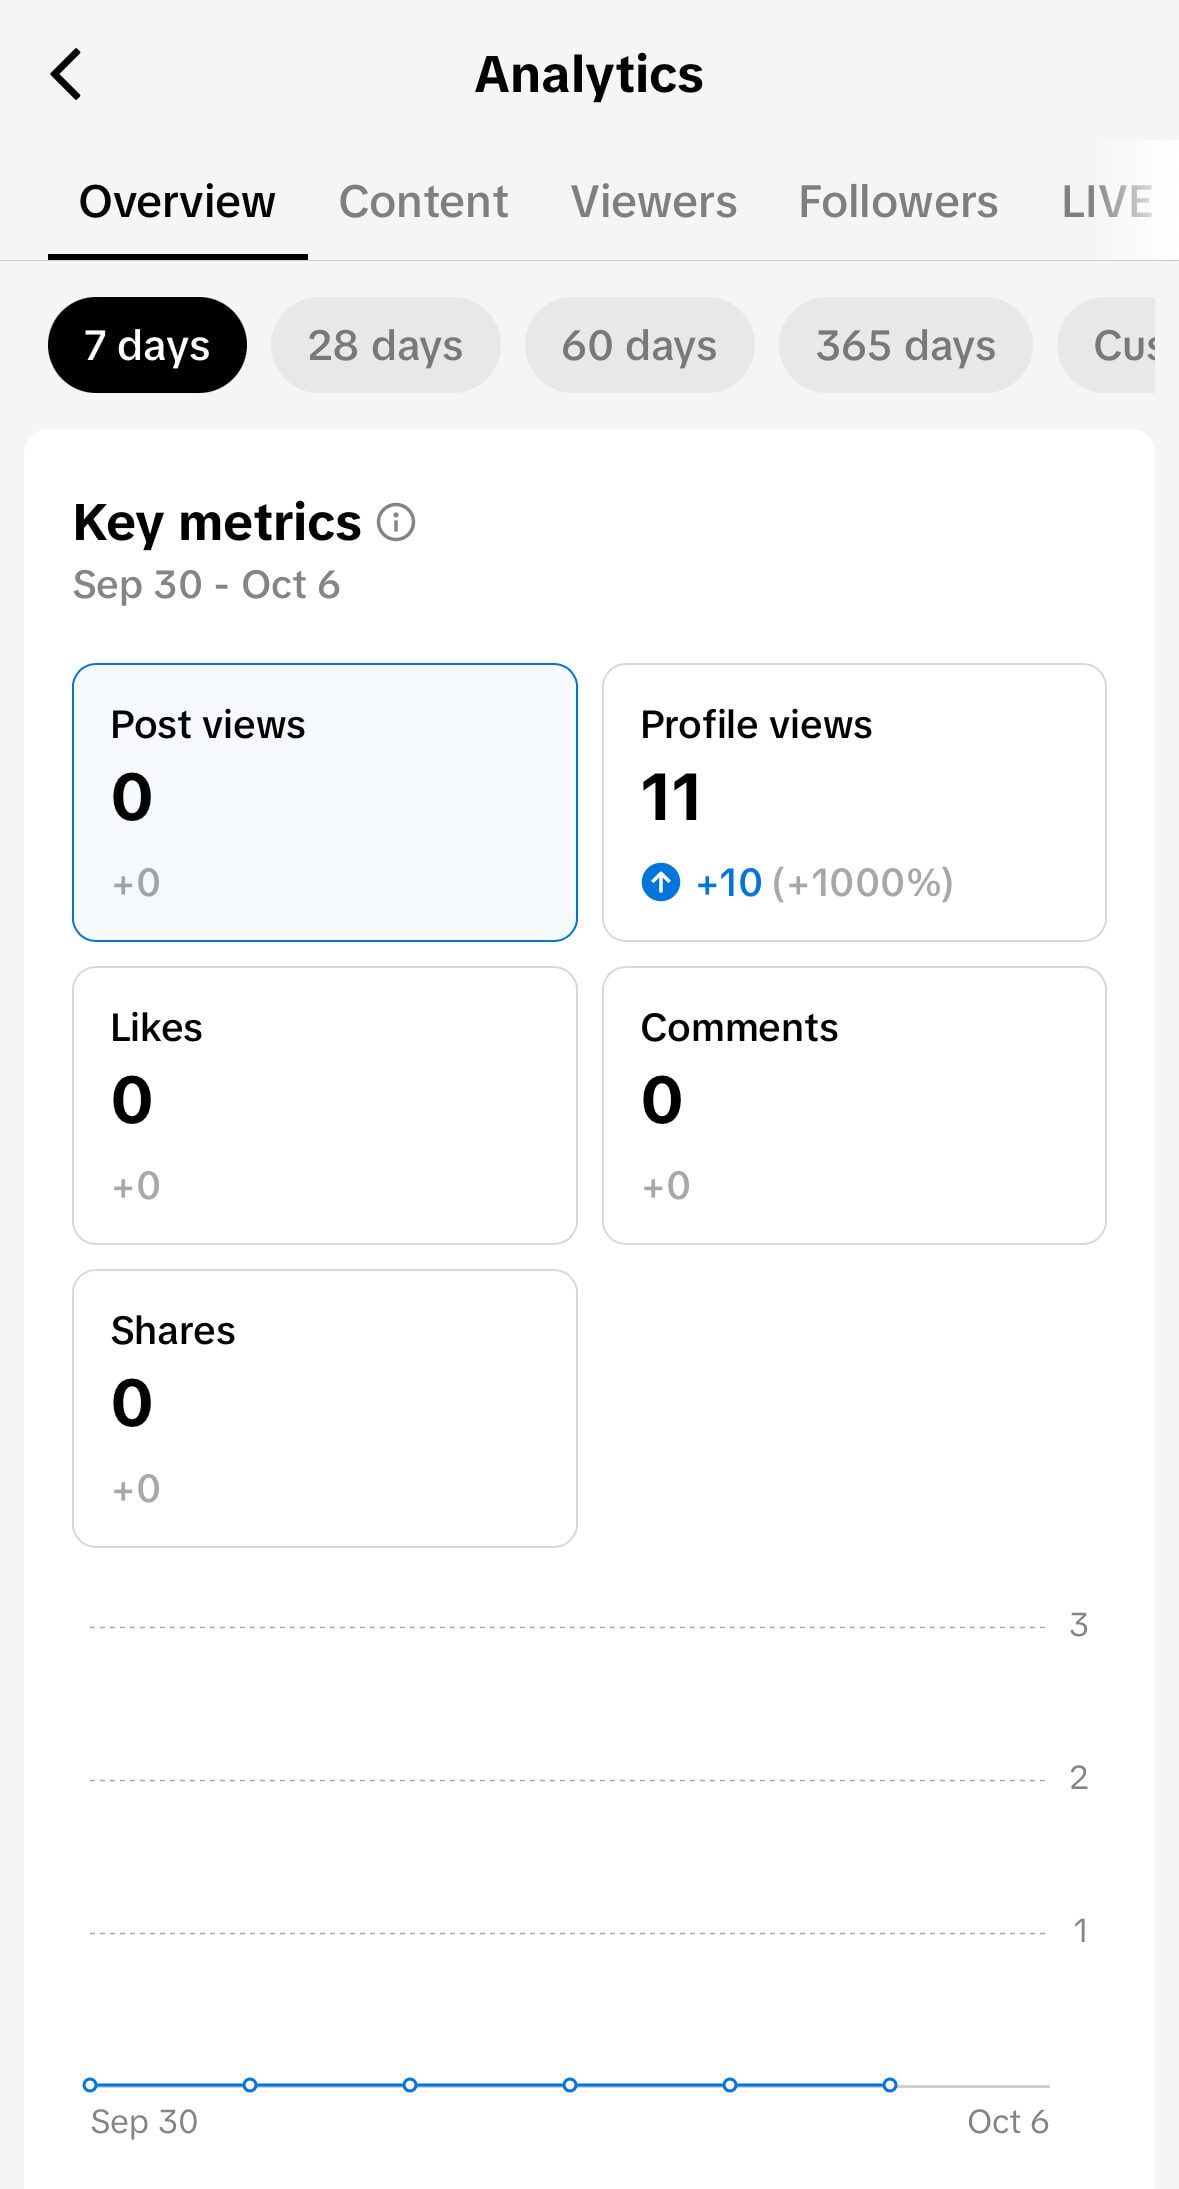
- Tap the Overview, Content, Viewers, Followers or LIVE tabs to see more metrics.
How to access TikTok analytics from desktop
- Log into your account by going to TikTok.com. (You can also go to tiktok.com/tiktokstudio/analytics if you are already logged in).
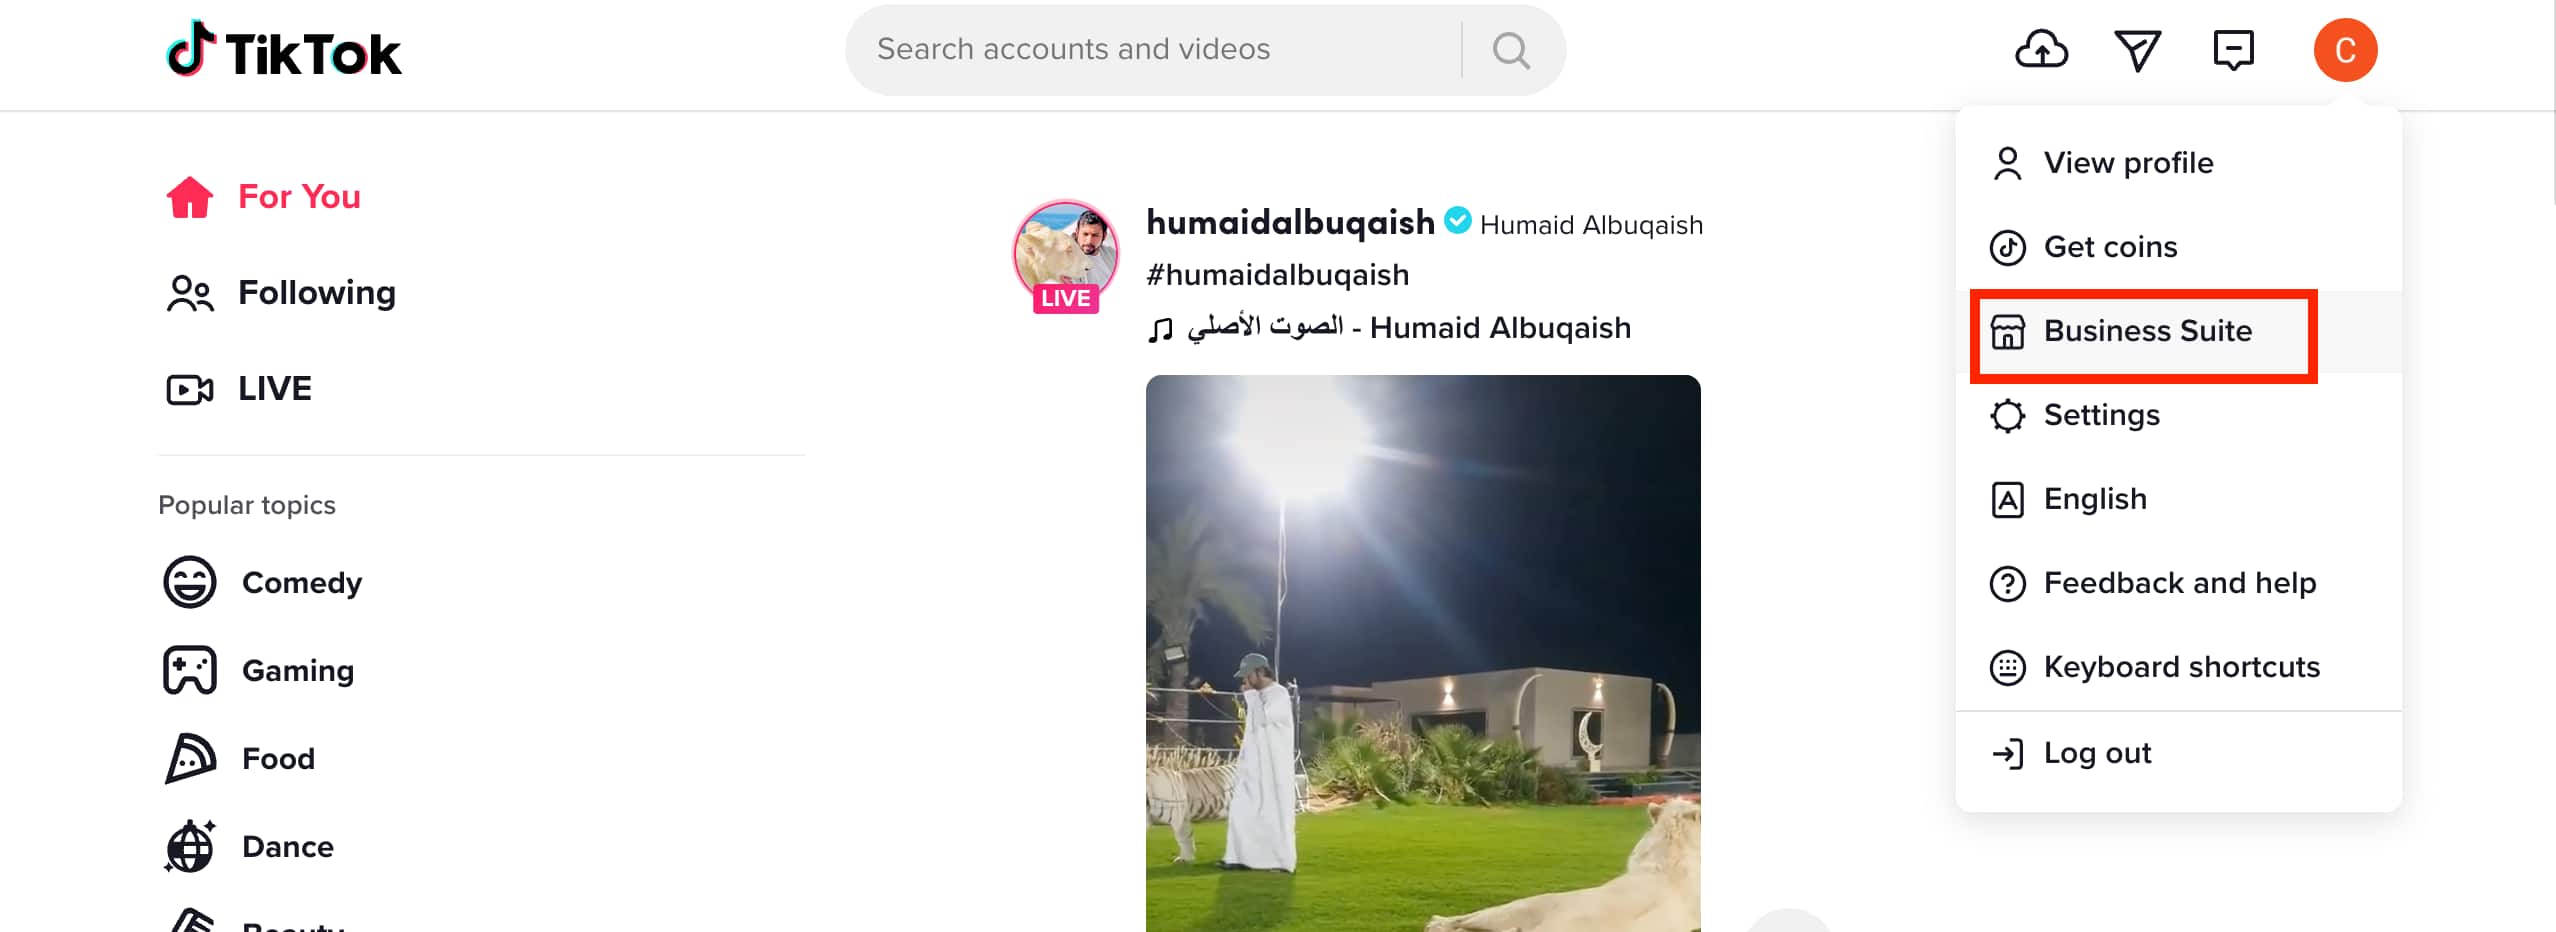
- Hover over your profile icon, then select View Analytics.
- On the TikTok homepage, hover over your profile icon and select Business Suite.
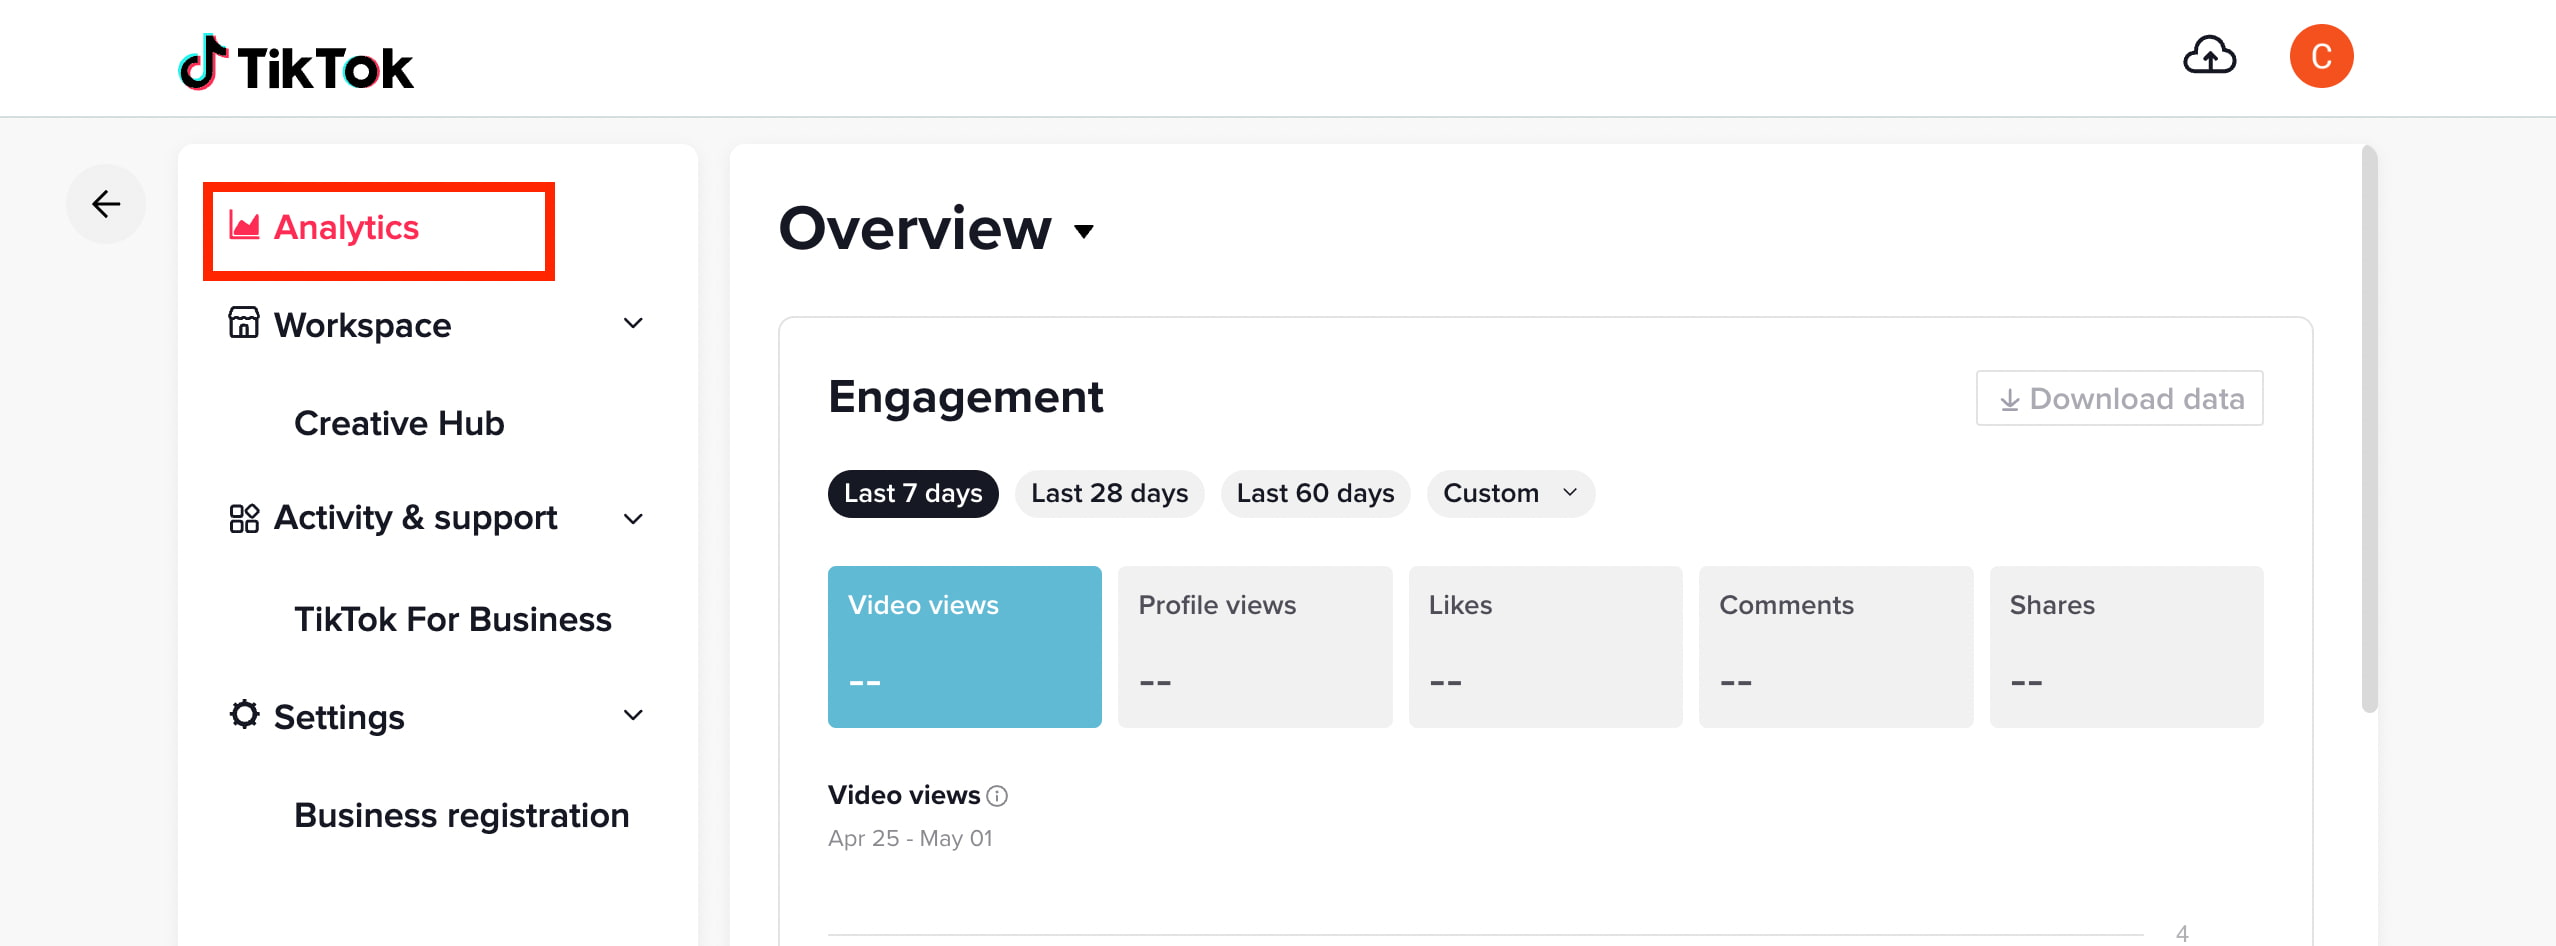
- This will take you directly to the Analytics section of your account.
26 TikTok insights and metrics to monitor
Want to know how to see video analytics on TikTok and what to expect when you’re checking natively? What exactly are unique viewers on TikTok? Here’s a breakdown of TikTok insights and metrics to monitor.
TikTok account overview
TikTok has four primary analytics tabs: Overview, Content, Followers and LIVE. Within each of those categories are sub-categories of analytics. The account Overview section shows these key metrics: post views, profile views, Likes, comments and shares.
You can also view traffic sources and search queries in the Overview section. The Overview area shows you a bar graph of how many views your videos have received in the last seven days. You can view video engagement metrics for the last seven, 28 days, 60 days or set a custom date range to get a better understanding of your growth and any fluctuations of TikTok trends.
Post views
The number of times your post was viewed.
Profile views
The number of times your profile was viewed compared to a set date range (last seven, last 28, last 60 days or a custom date range).
Likes
The number of times viewers liked your posts.
Comments
How many comments your posts received.
Shares
The number of times your posts were shared.
TikTok Followers analytics
The fourth tab in your TikTok analytics is all about your follower stats. Seeing exact followers on TikTok and in-depth information about audience demographics is always helpful to ensure your content is resonating with your target audience and supporting follower growth.
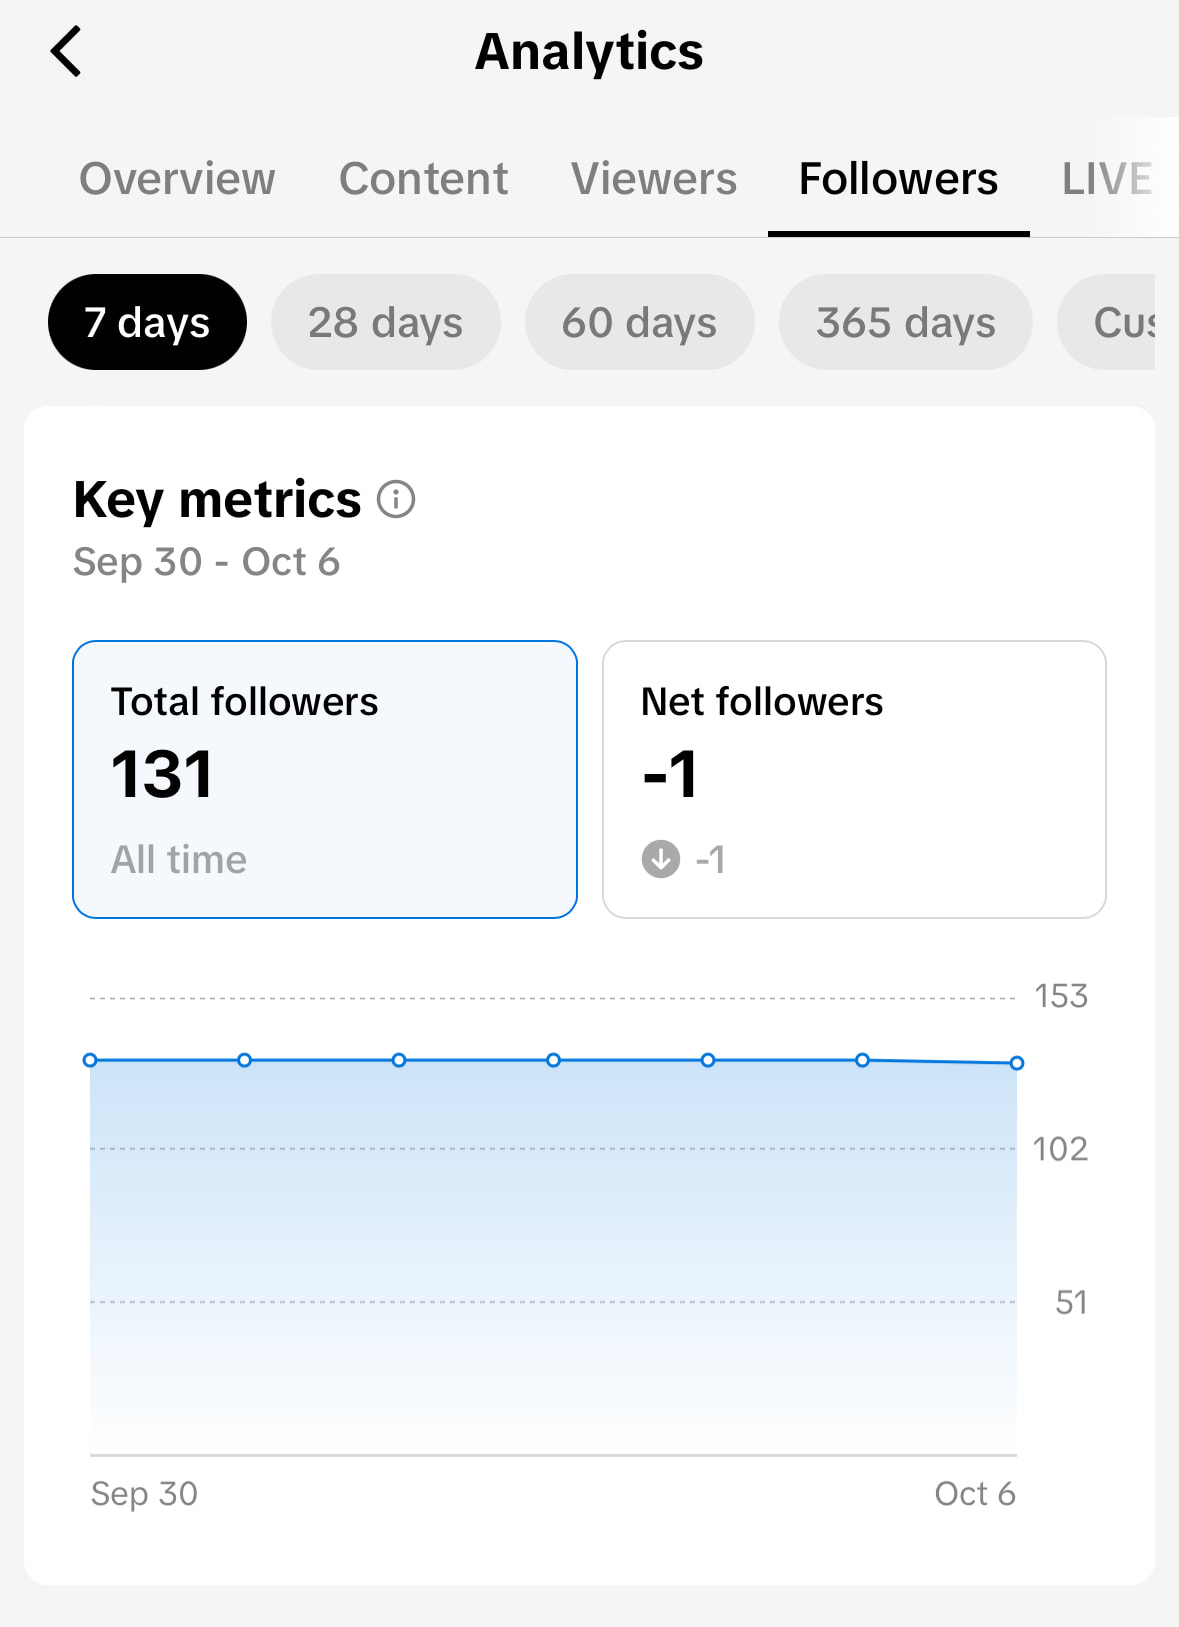
Total followers
The total number of followers you have since you joined TikTok. Note: This number doesn’t change when you select different time periods.
Net followers
The number of new followers you gained in a selected time period compared to the previous period.
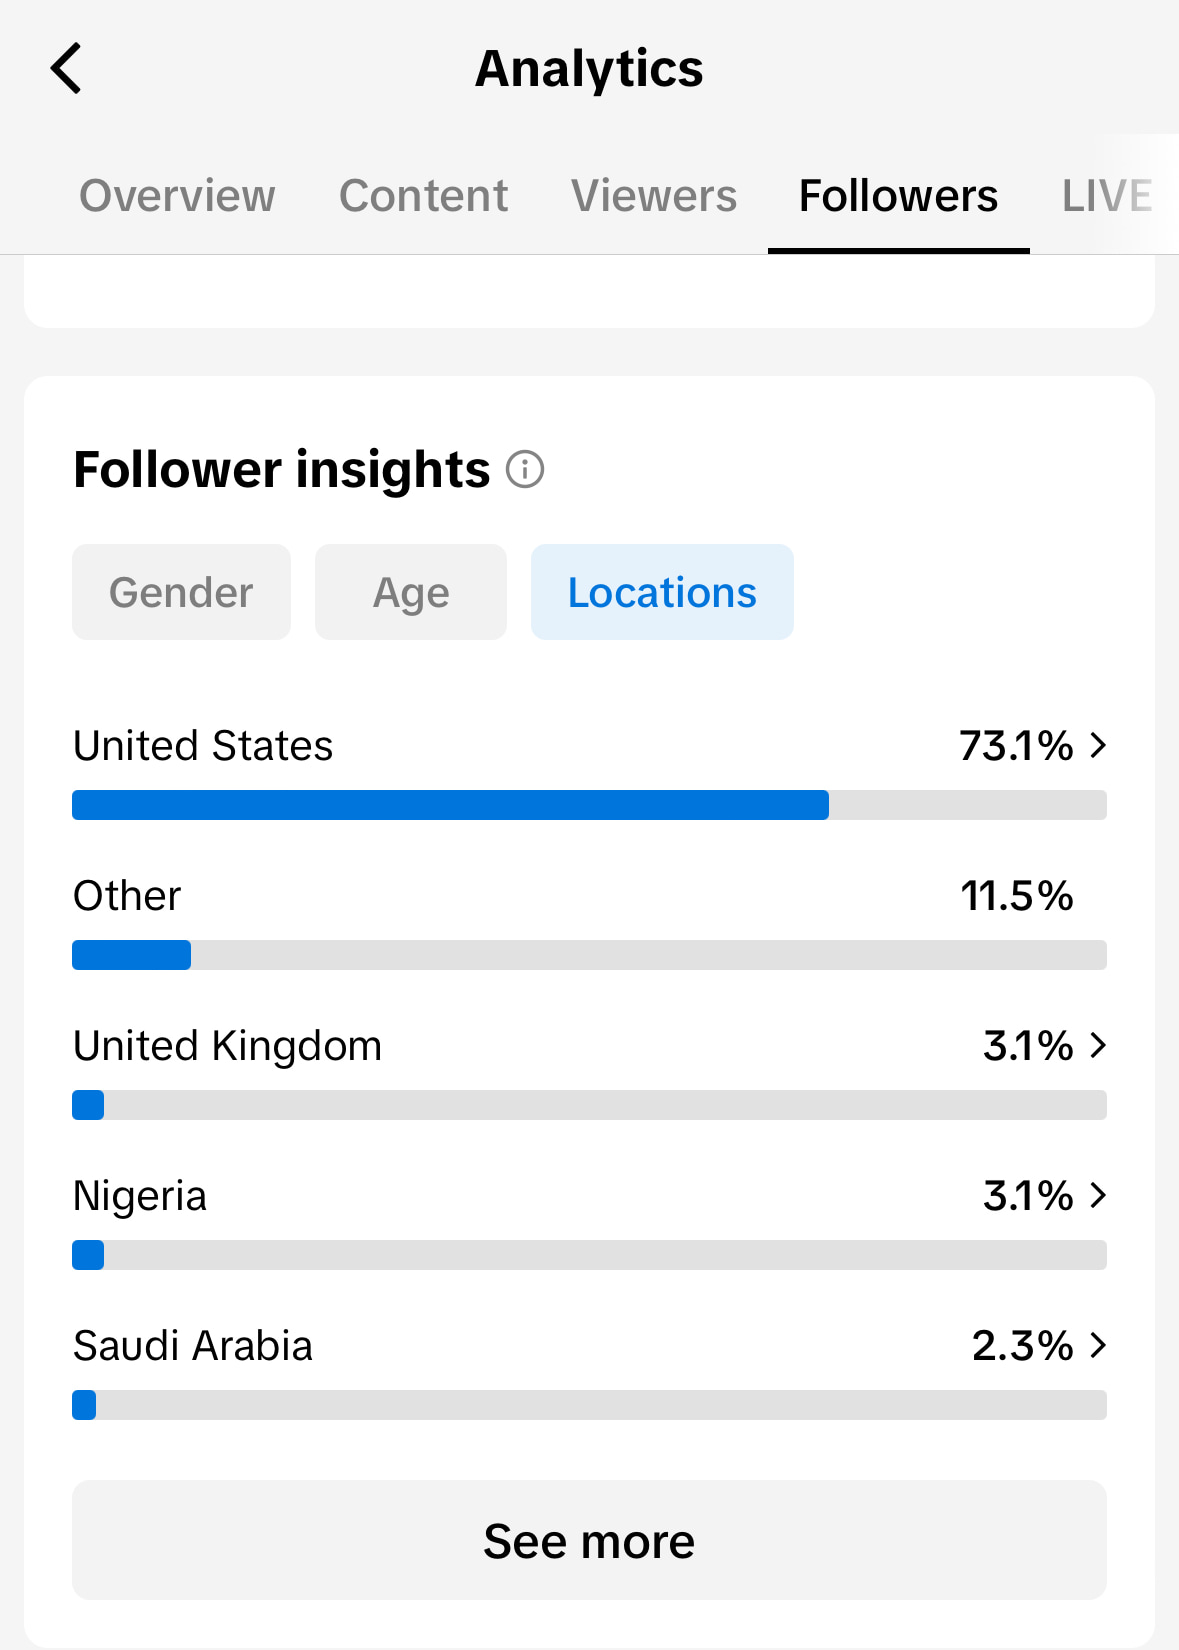
Follower insights
This section within the Followers tab shows you information about the accounts that follow you.
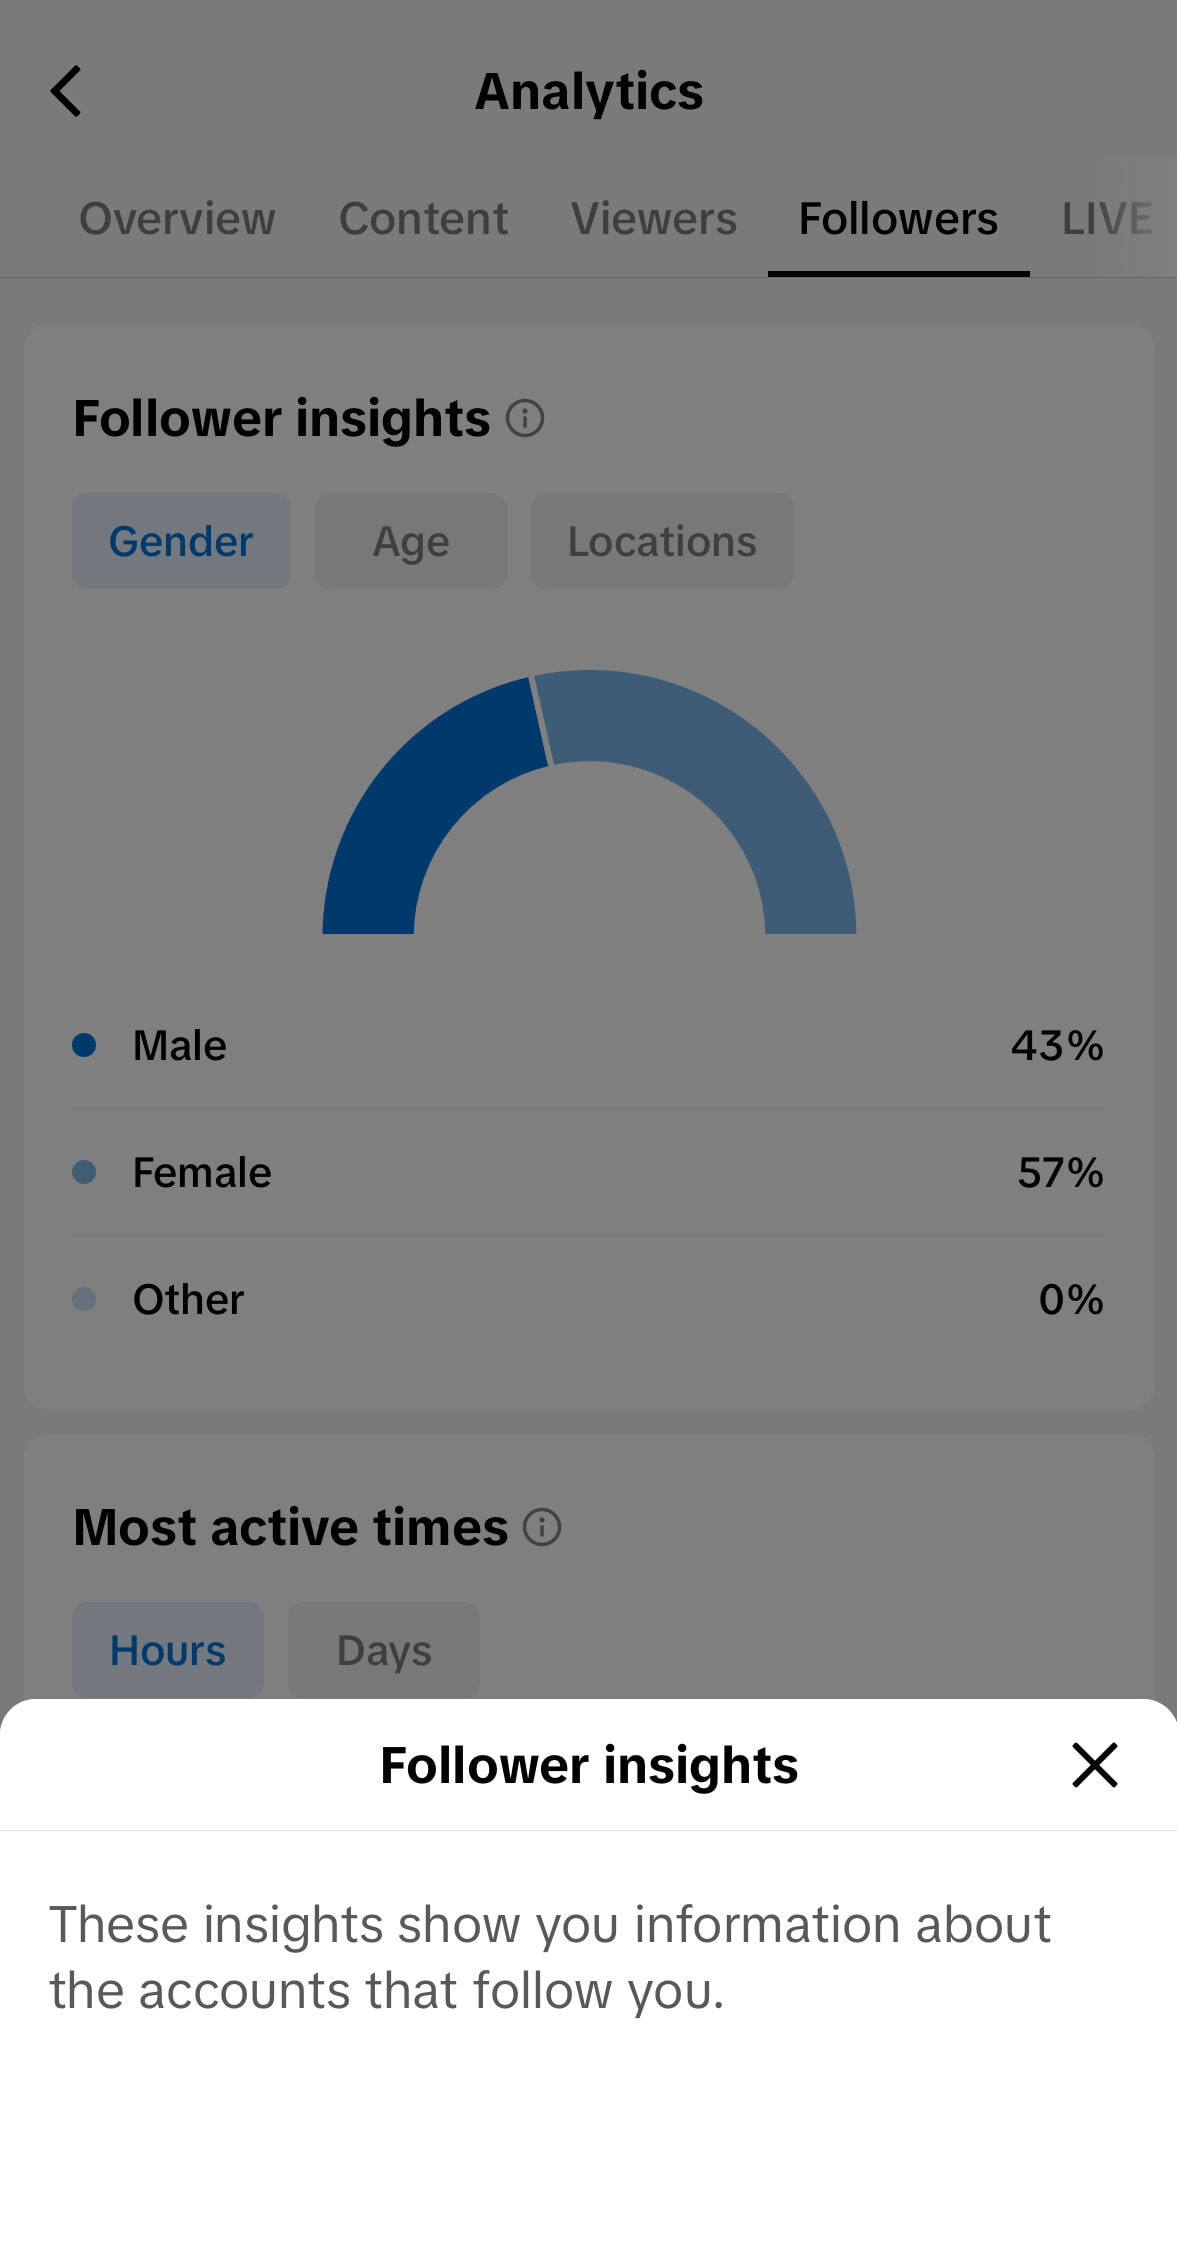
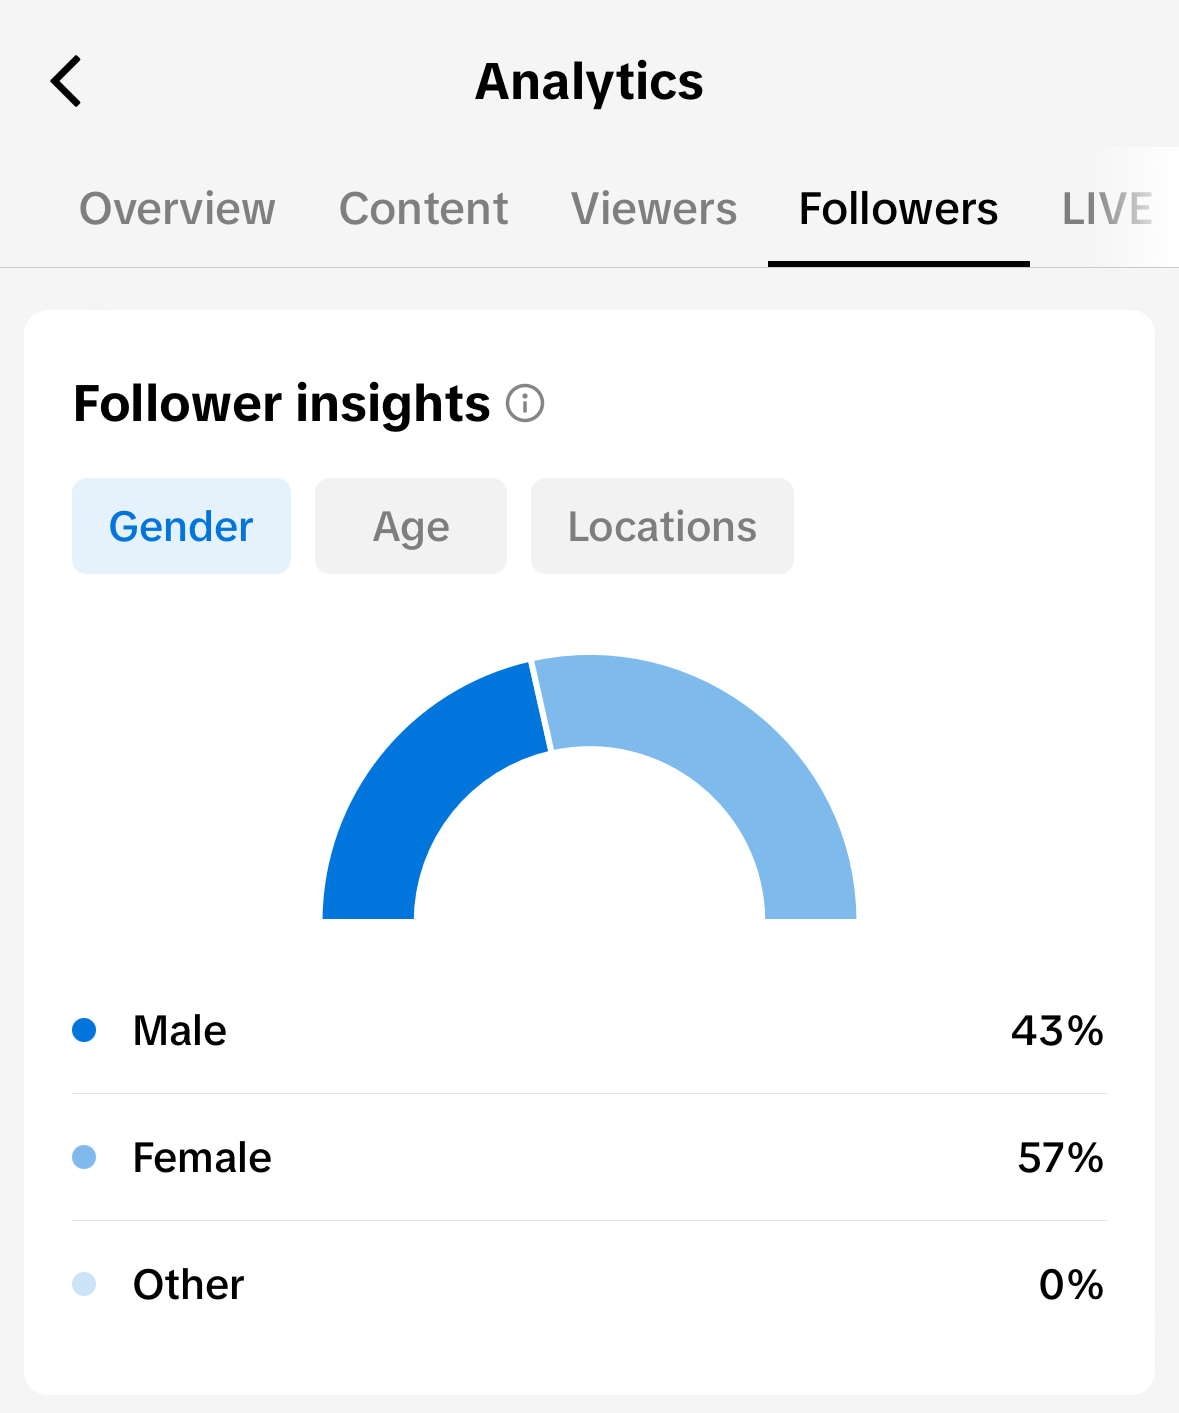
Gender
A bar chart with the percentage of your followers by gender.
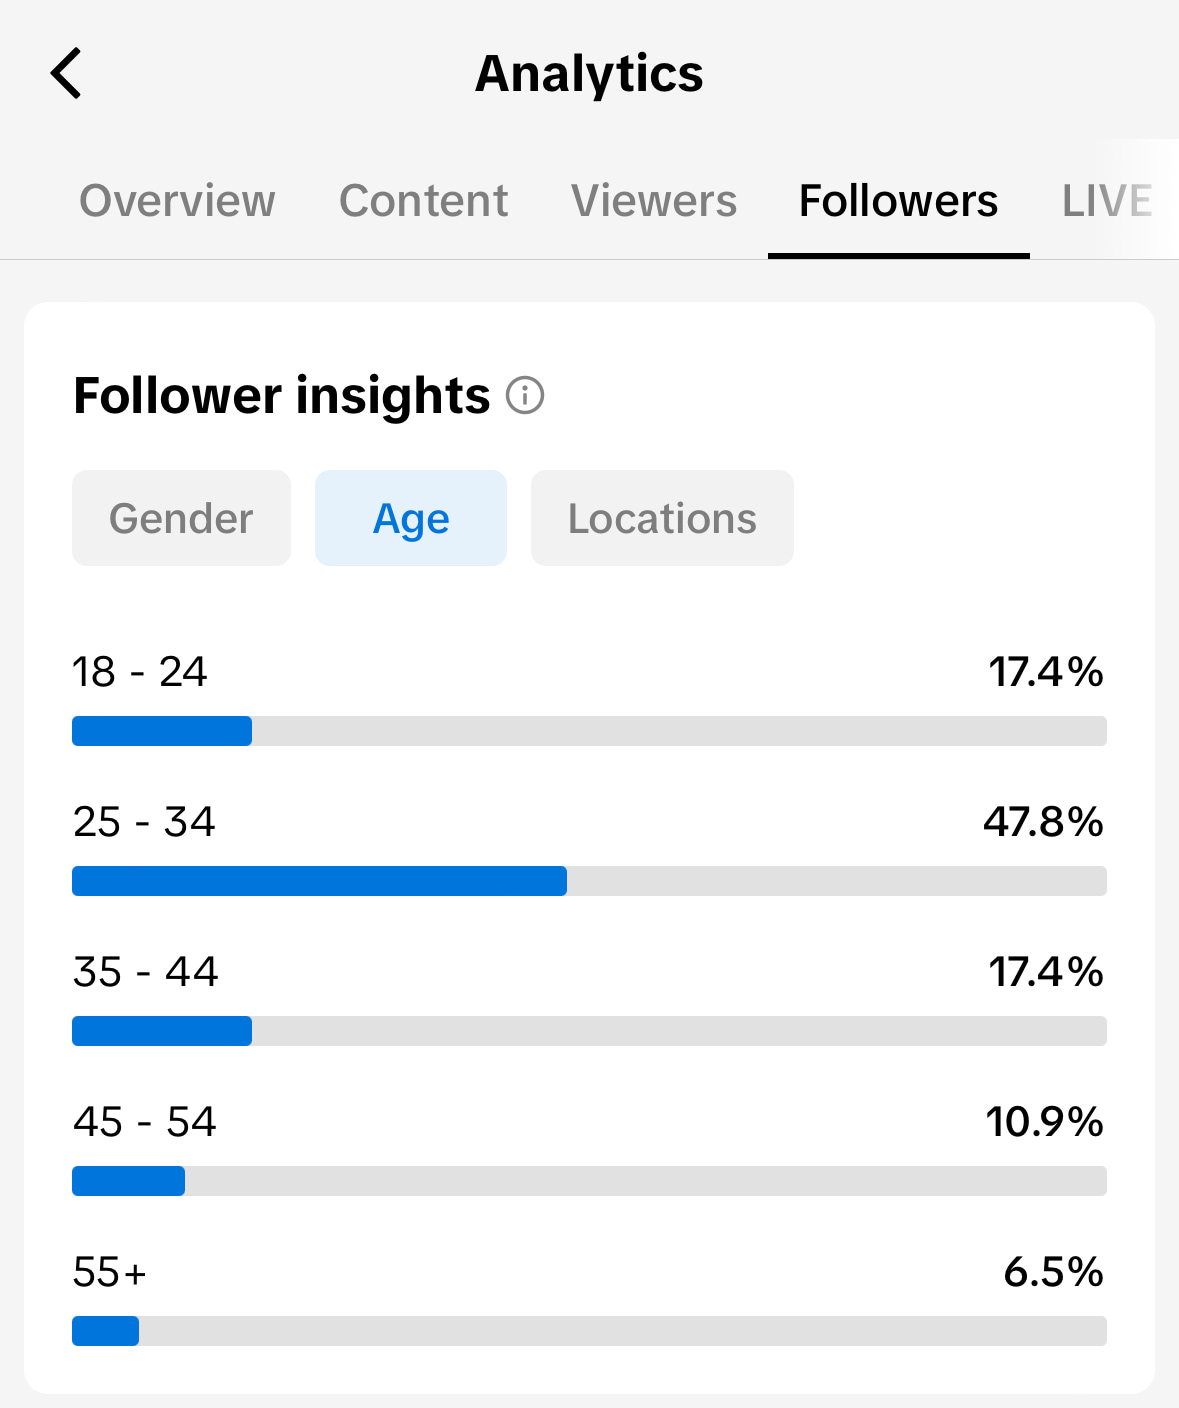
Age demographics
This section breaks down your followers by age group and gives you percentages for each group.
Locations
This section highlights the top countries where your followers are located.
Most active times
The average times your followers are active on TikTok. You can view these times by hours and days. Ideally, you’ll want to post your content before daily user activity peaks.
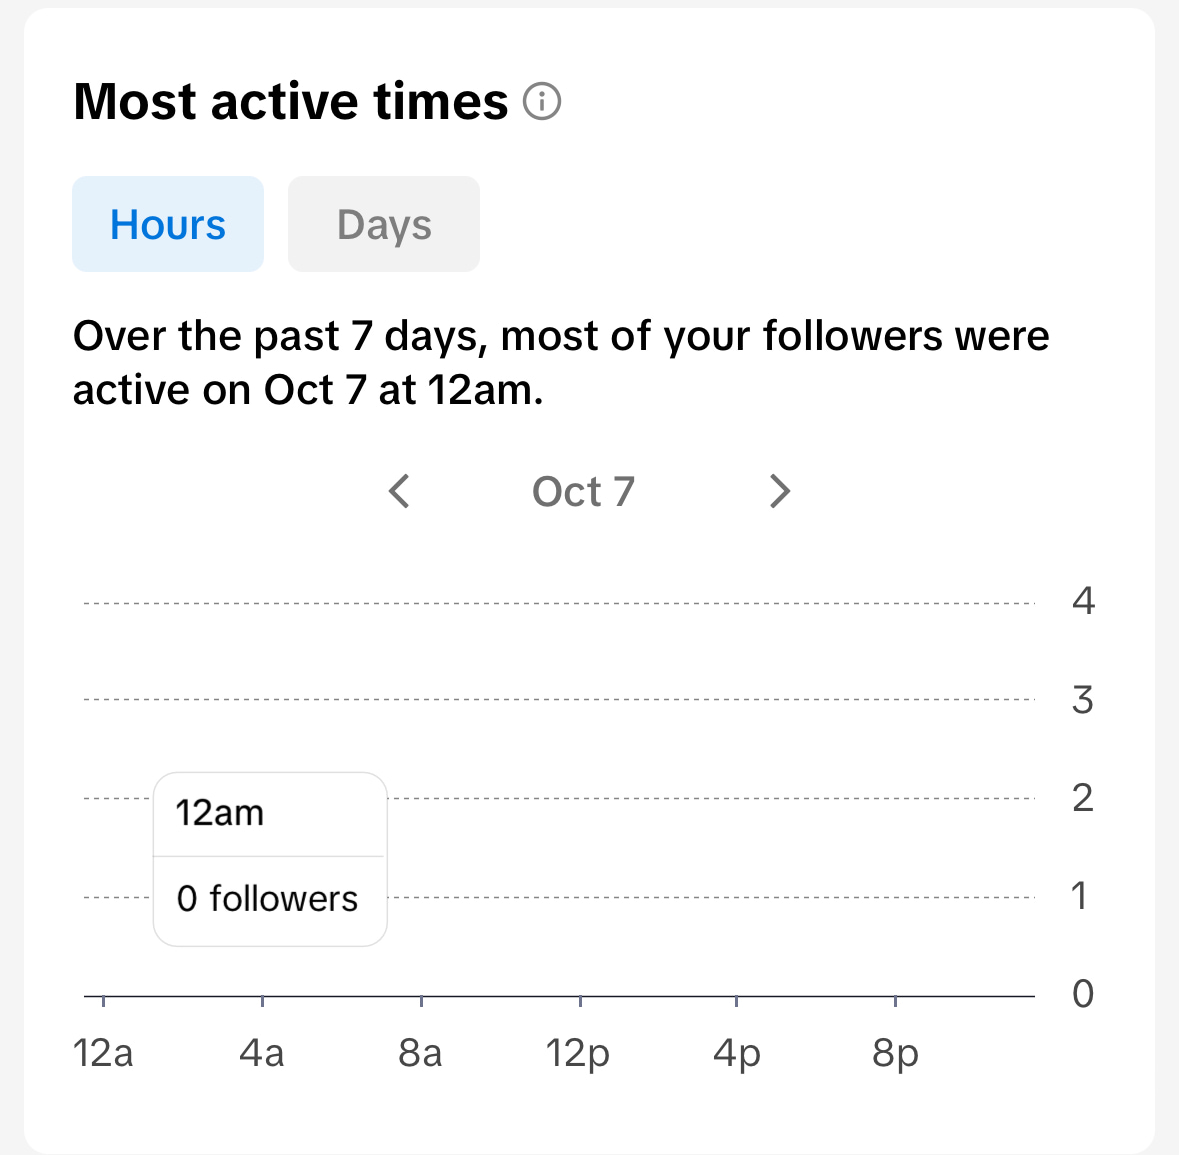
Using this information strategically will help you determine the best times to post on TikTok to reach the most followers. Pay attention to the tallest bars in the graph to see when most of your followers are online, then base your TikTok posting schedule around that.
TikTok Content analytics
The next tab in your TikTok analytics is the Content tab. This section shows more specific information about the actual TikTok content you’re publishing, including your most viewed videos. All content metrics are available for the previous seven, 28, 60 and 365 days.
You can also select a custom range. Your top-performing posts are ranked according to views, likes, new viewers and new followers gained.

Trending videos
This section shows the top nine videos with the fastest growth in view numbers over the past seven days.
Video views by section
In this section, you can see how people found your video, whether directly from your profile or if it appeared on their For You feed.
Video views by region
This section gives you insight into the regions your video reached and where viewers are from so you can see exactly where your content performs best.
Average watch time
This is the average length of time people watched your videos—a good indicator of whether your videos are engaging to audiences. You’ll also see how often users stayed until the end to watch your entire video.
Total play time
This is the cumulative watch time for all users who viewed your video, a helpful metric for comparing the performance of your videos.
TikTok LIVE analytics
If you click on the TikTok LIVE tab, you’ll be taken to the LIVE Center. If you’ve hosted live videos in the past 28 days, in LIVE Center you can see insights such as:
- Total views: The number of viewers for your live videos within your selected date range.
- Total time: The time you’ve spent hosting live videos within your selected date range.
- New followers: TikTok users who began following you while you were hosting a live video within your selected date range.
- Top viewer count: The highest number of live video viewers at one specific time within your selected date range.
- Unique viewers: Viewers who watched your live video at least once (even if a viewer replays your video, they’re counted only once).
- Diamonds: Virtual gifts that users may send you—you can exchange these for money through TikTok.
- Viewer ranking: The viewers with the highest gift count and watch time.

Also, consider checking out the LIVE Academy to learn tips and tricks for livestreaming on TikTok. Hopefully with this overview, you know how to see TikTok analytics natively. But you should also consider how to check TikTok analytics using a third-party tool.
Why to consider a third-party TikTok analytics tool
Native TikTok analytics only scratch the surface. Third-party platforms like Sprout Social deliver the advanced metrics and cross-platform insights that drive strategic decision-making and prove social ROI to stakeholders.
TikTok analytics tools have extra capabilities that provide insights to help your overall TikTok strategy, such as:
- Cross-platform comparison: A third-party analytics tool enables you to track your TikTok analytics alongside your other top social media platforms so you have a holistic view of performance in one place without having to toggle between multiple platforms. This allows you to understand where your content performs best so you can iterate on strategies.
- Access lifetime data: TikTok offers native performance metrics for up to a year, but an analytics tool enables you to compare data year-over-year (YoY), giving you a wider view on your historic performance.
- Engagement metrics: These tools tend to offer more advanced engagement metrics like reach and impressions. You can also monitor hashtags and trendspot through social listening.
- Centralized inbox: As your account grows, it’ll be nearly impossible to address and view inbound messages natively. TikTok analytics tools give you the ability to view messages and comments in a singular inbox alongside other platforms.
How to see analytics on TikTok
Want to see the benefits of a TikTok analytics tool using your brand’s TikTok data? It’s easy:
Step 1. Start a free Sprout Social trial by setting up an account with your business email.
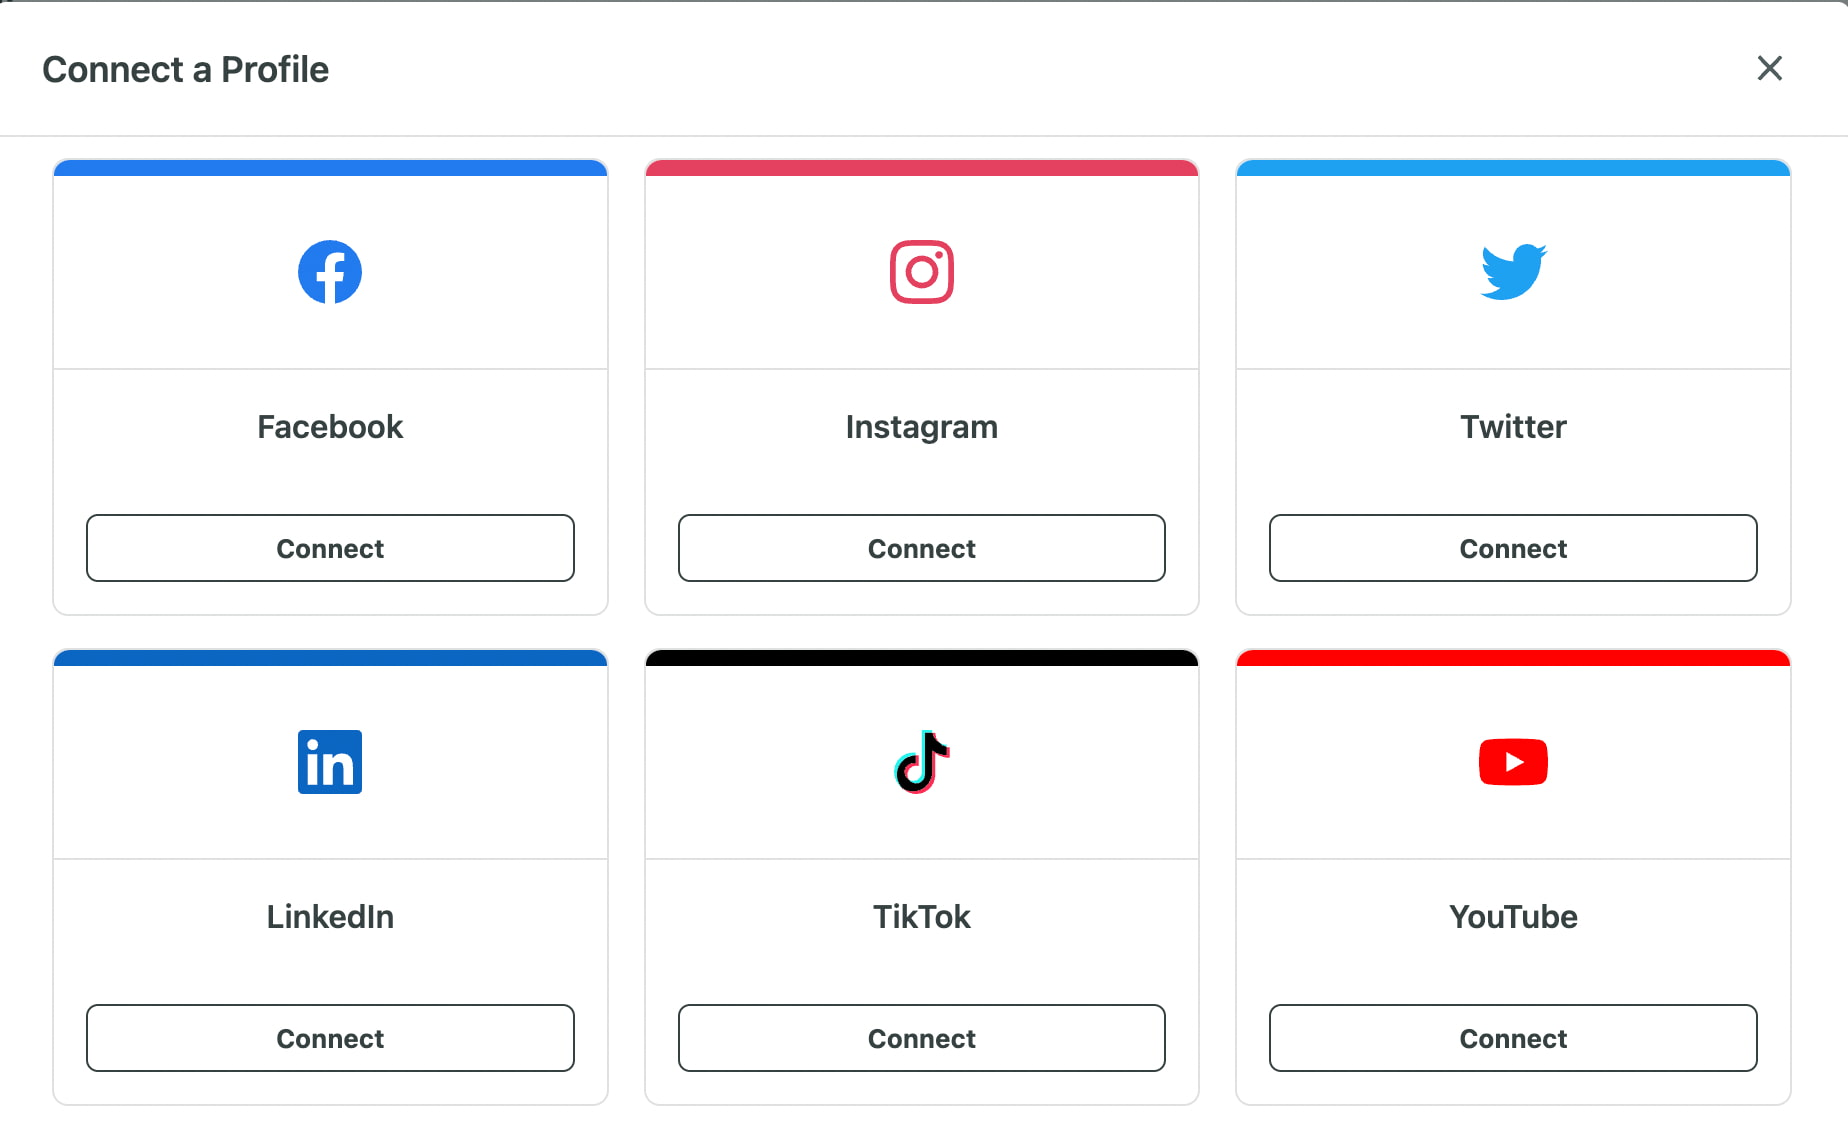
Step 2. Once you are logged in, navigate to Account > Settings, then click on “Connect a Profile”.
Step 3. From the “In Group” dropdown, choose the Group you wish to link your TikTok profile with.
Step 4. To connect with Sprout, select “Connect” on the TikTok page and follow the authorization process.
After allowing 24 hours for the data to populate you can start analyzing your performance using the TikTok Profiles Report.
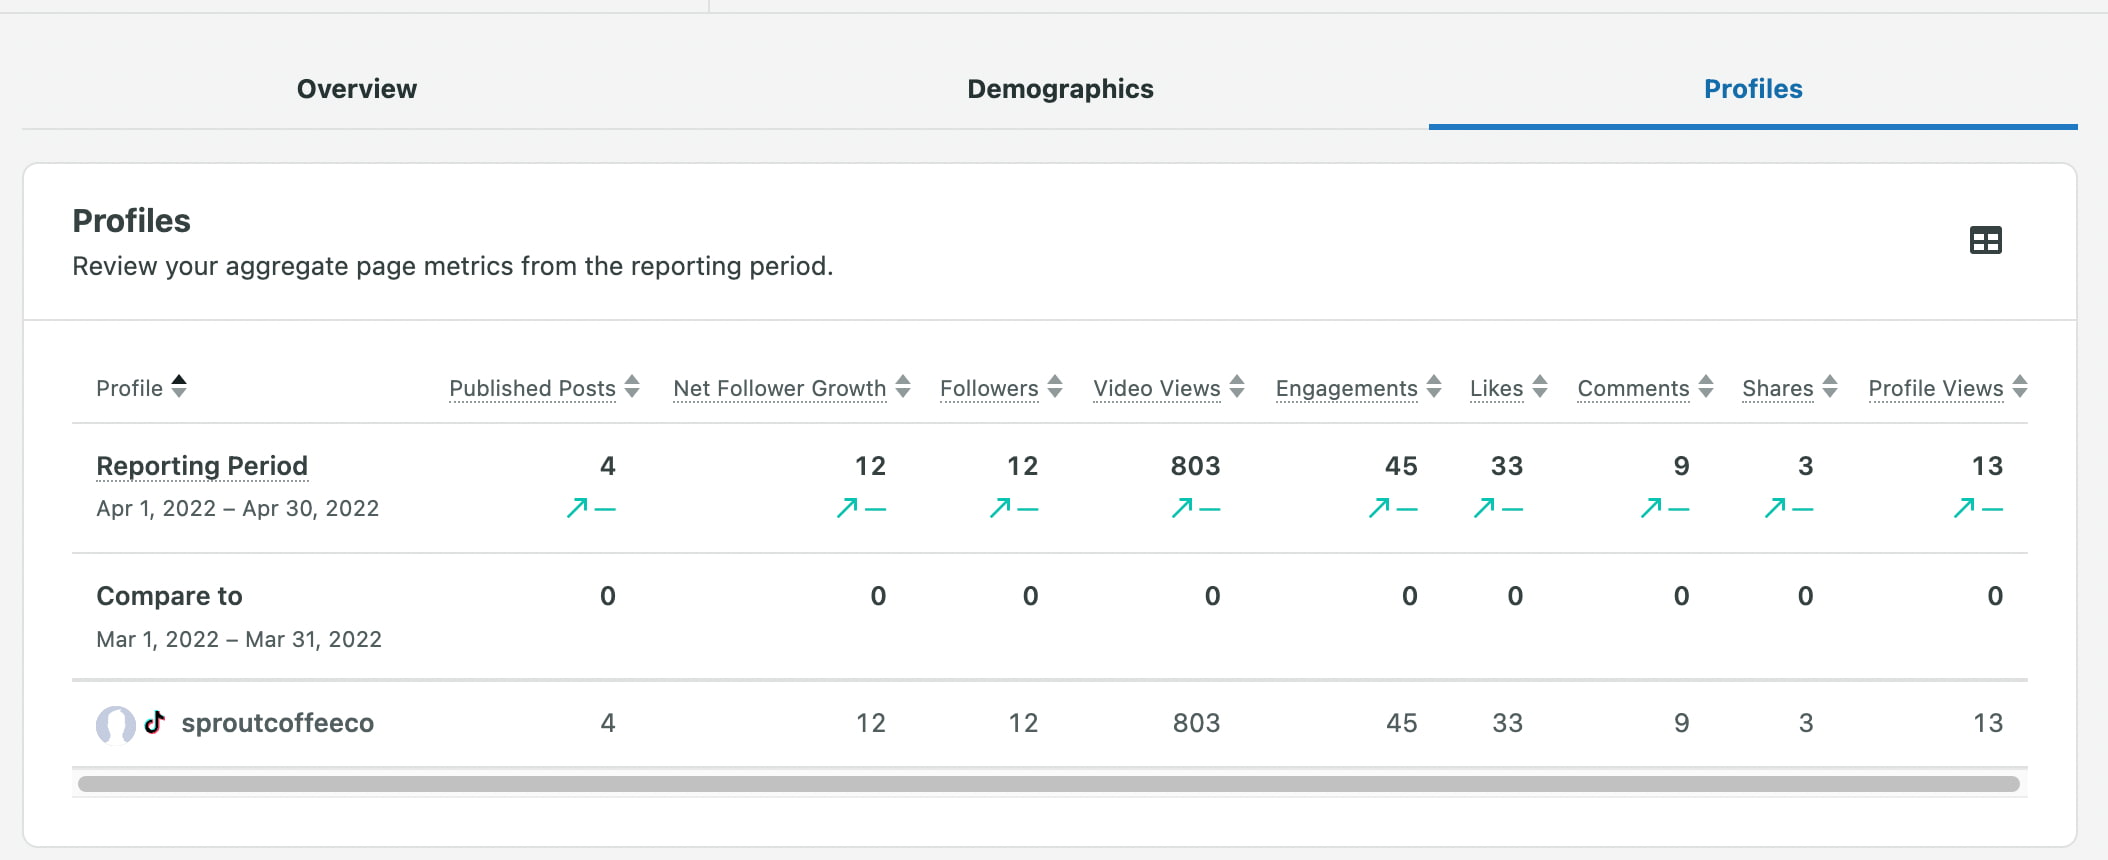
TikTok Profiles Report
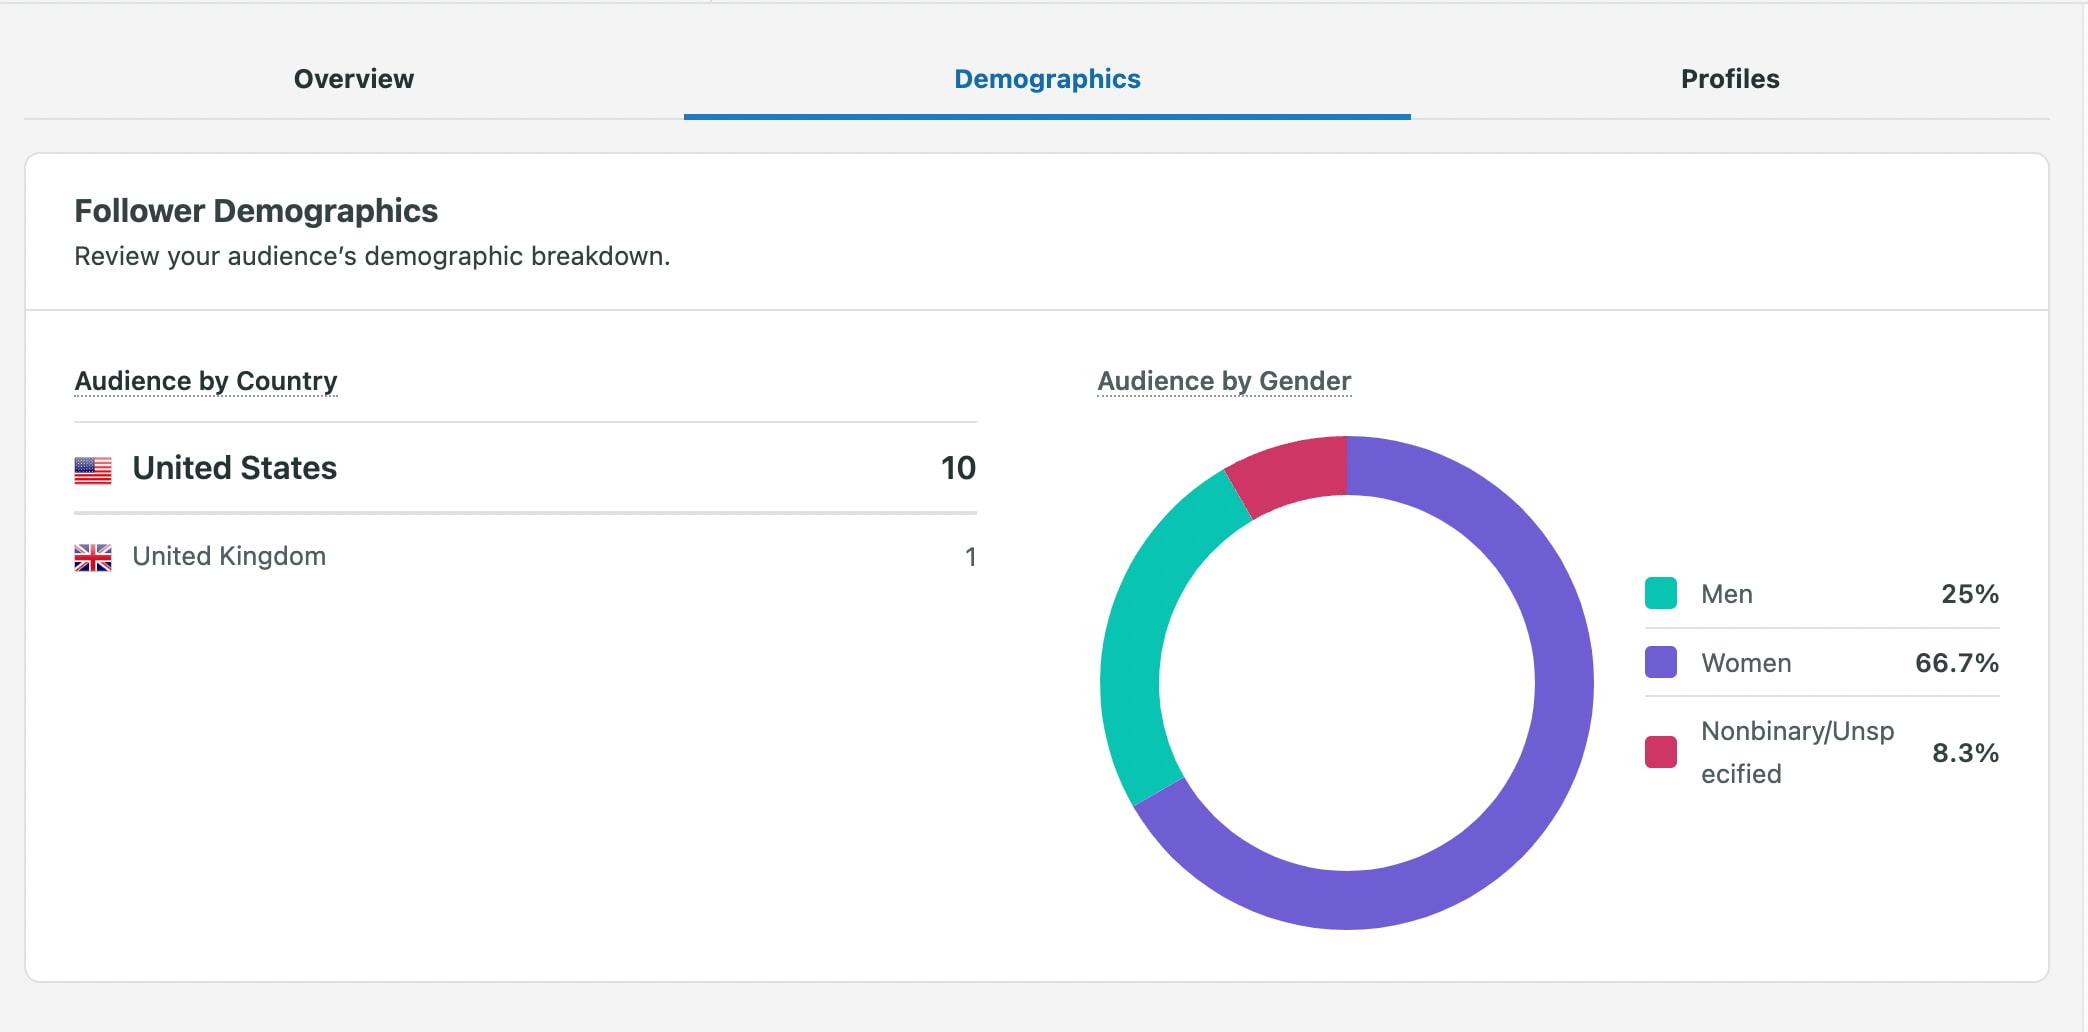
The TikTok Profiles Report is divided into three tabs: Overview, Demographics and Profiles.
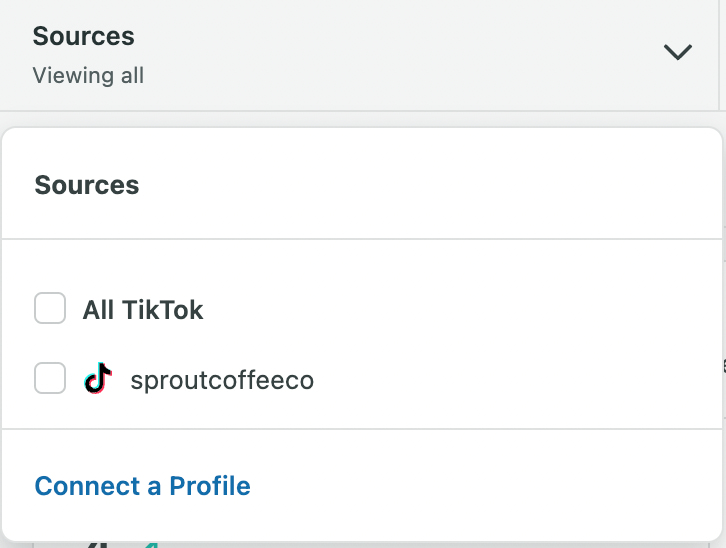
Customizing the Report
Use the Sources menu to pick the specific profiles you’re interested in analyzing.
Overview The overview tab provides insight into your Performance Summary, Video Views, Engagement, Audience Growth and Top Posts.
Performance Summary
The Performance Summary displays an overview of your performance metrics.
Track your content’s reach: See how many people are actually watching your videos with “Video Views” and “Reach” metrics. Understand the total audience your content is reaching, including both organic viewers and those reached through paid campaigns.
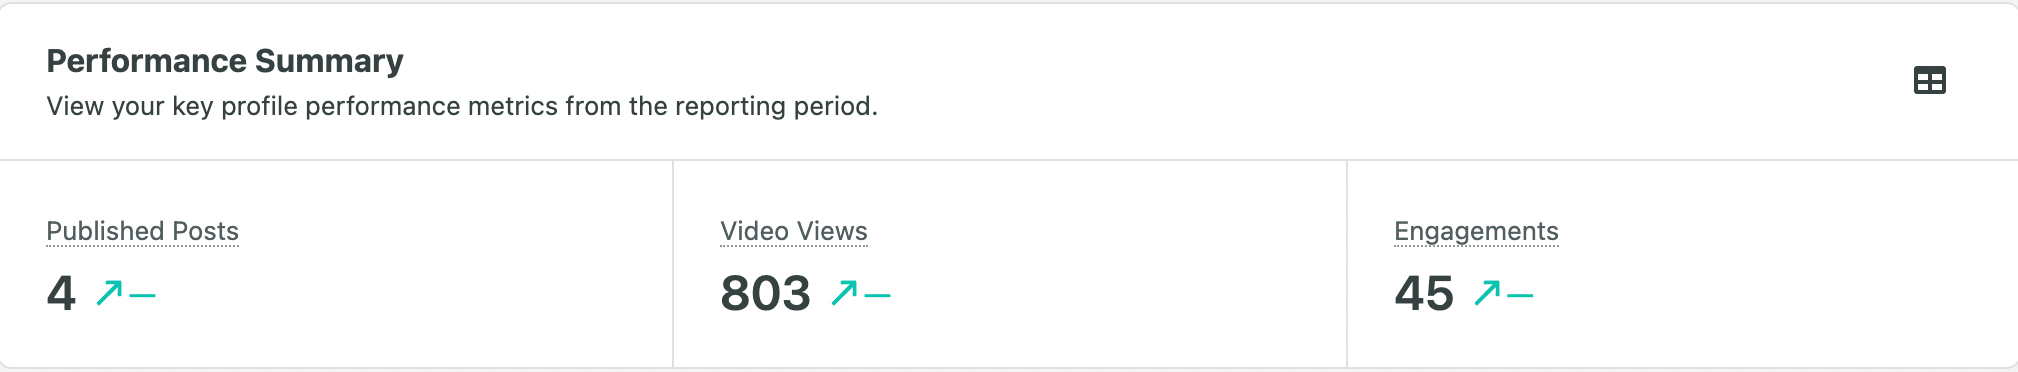
Analyze audience engagement: Go beyond just views. “Engagements” shows you how your audience interacts with your content – likes, comments and shares. Identify what resonates and sparks conversation.
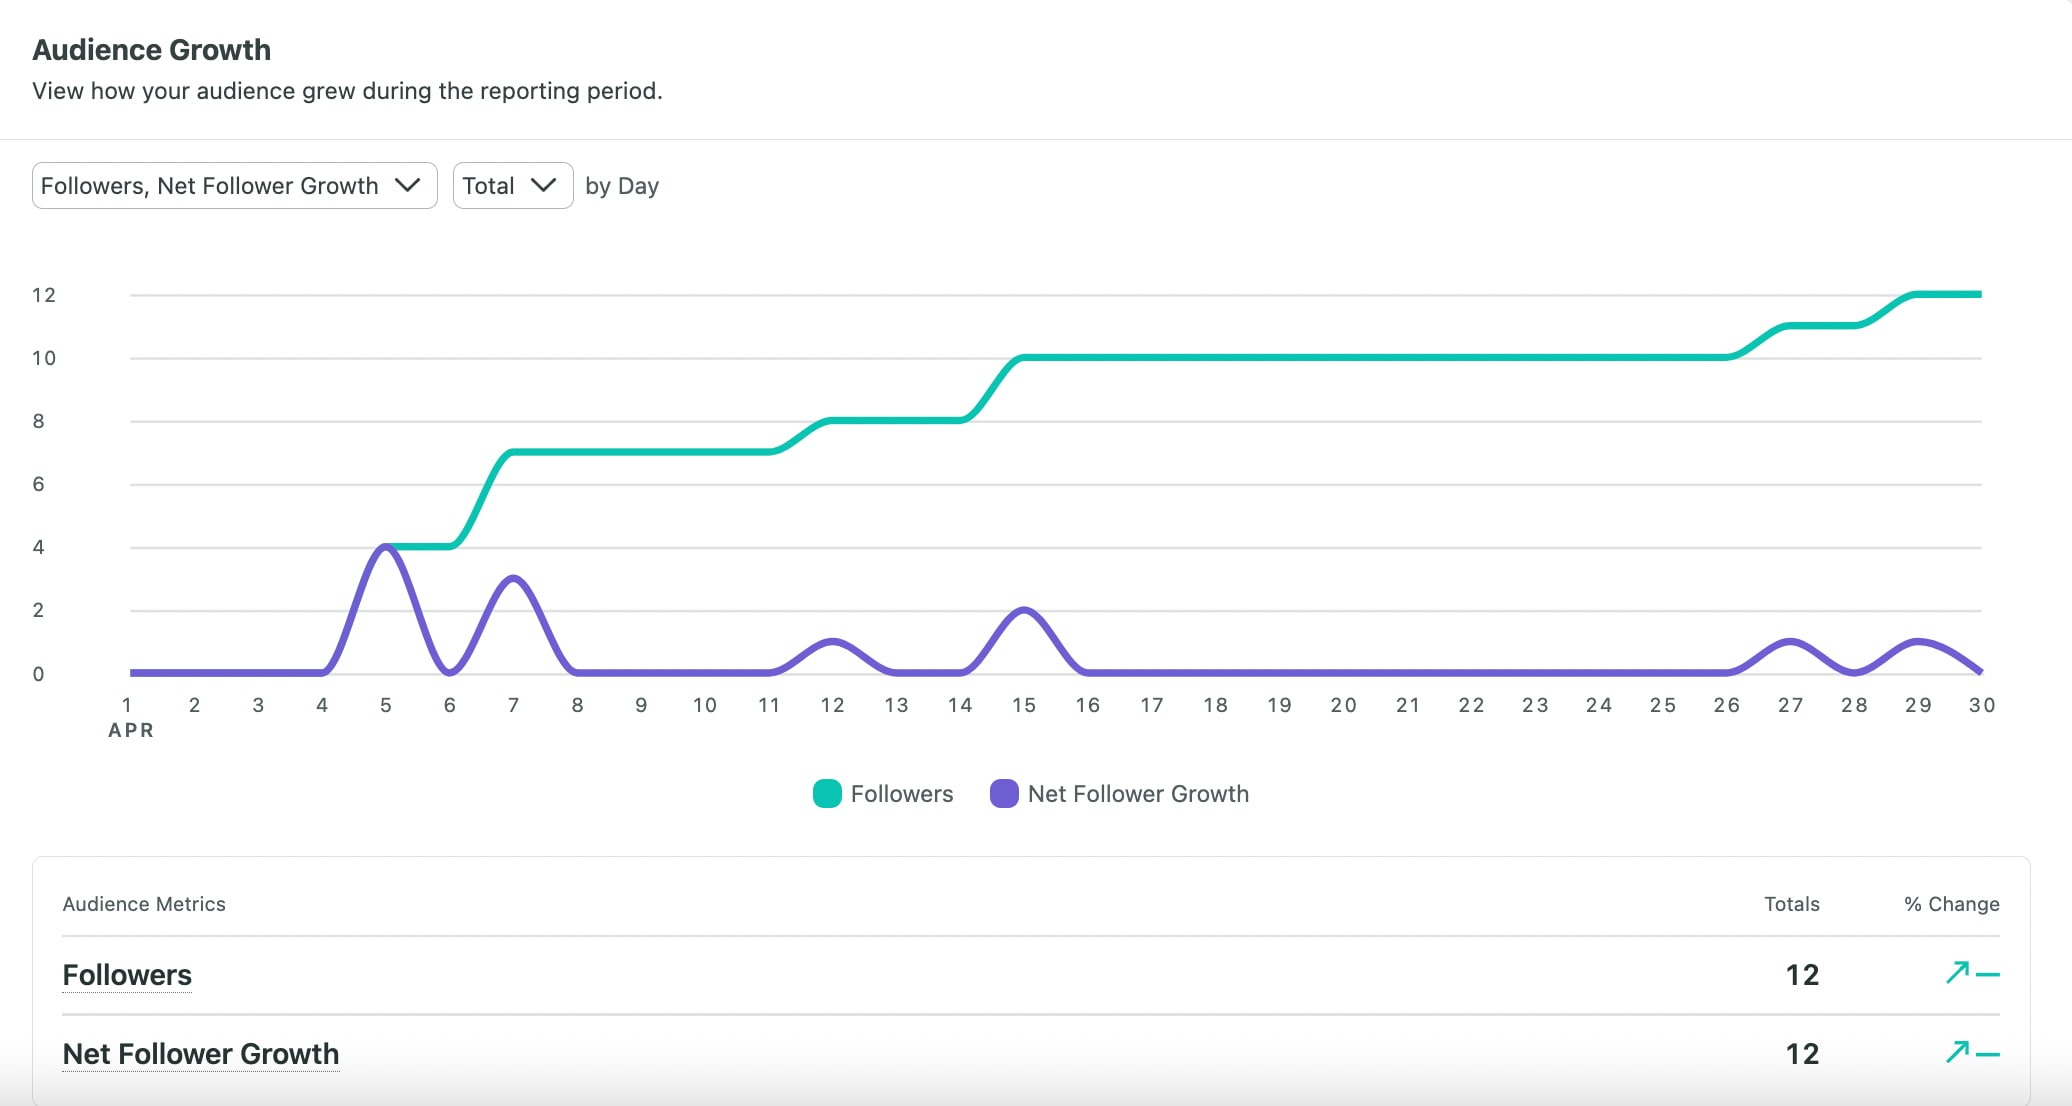
Monitor audience growth: See how your follower base evolves over time with “Audience Growth” and “Net Follower Growth.” Track your progress and identify trends across your different TikTok profiles.
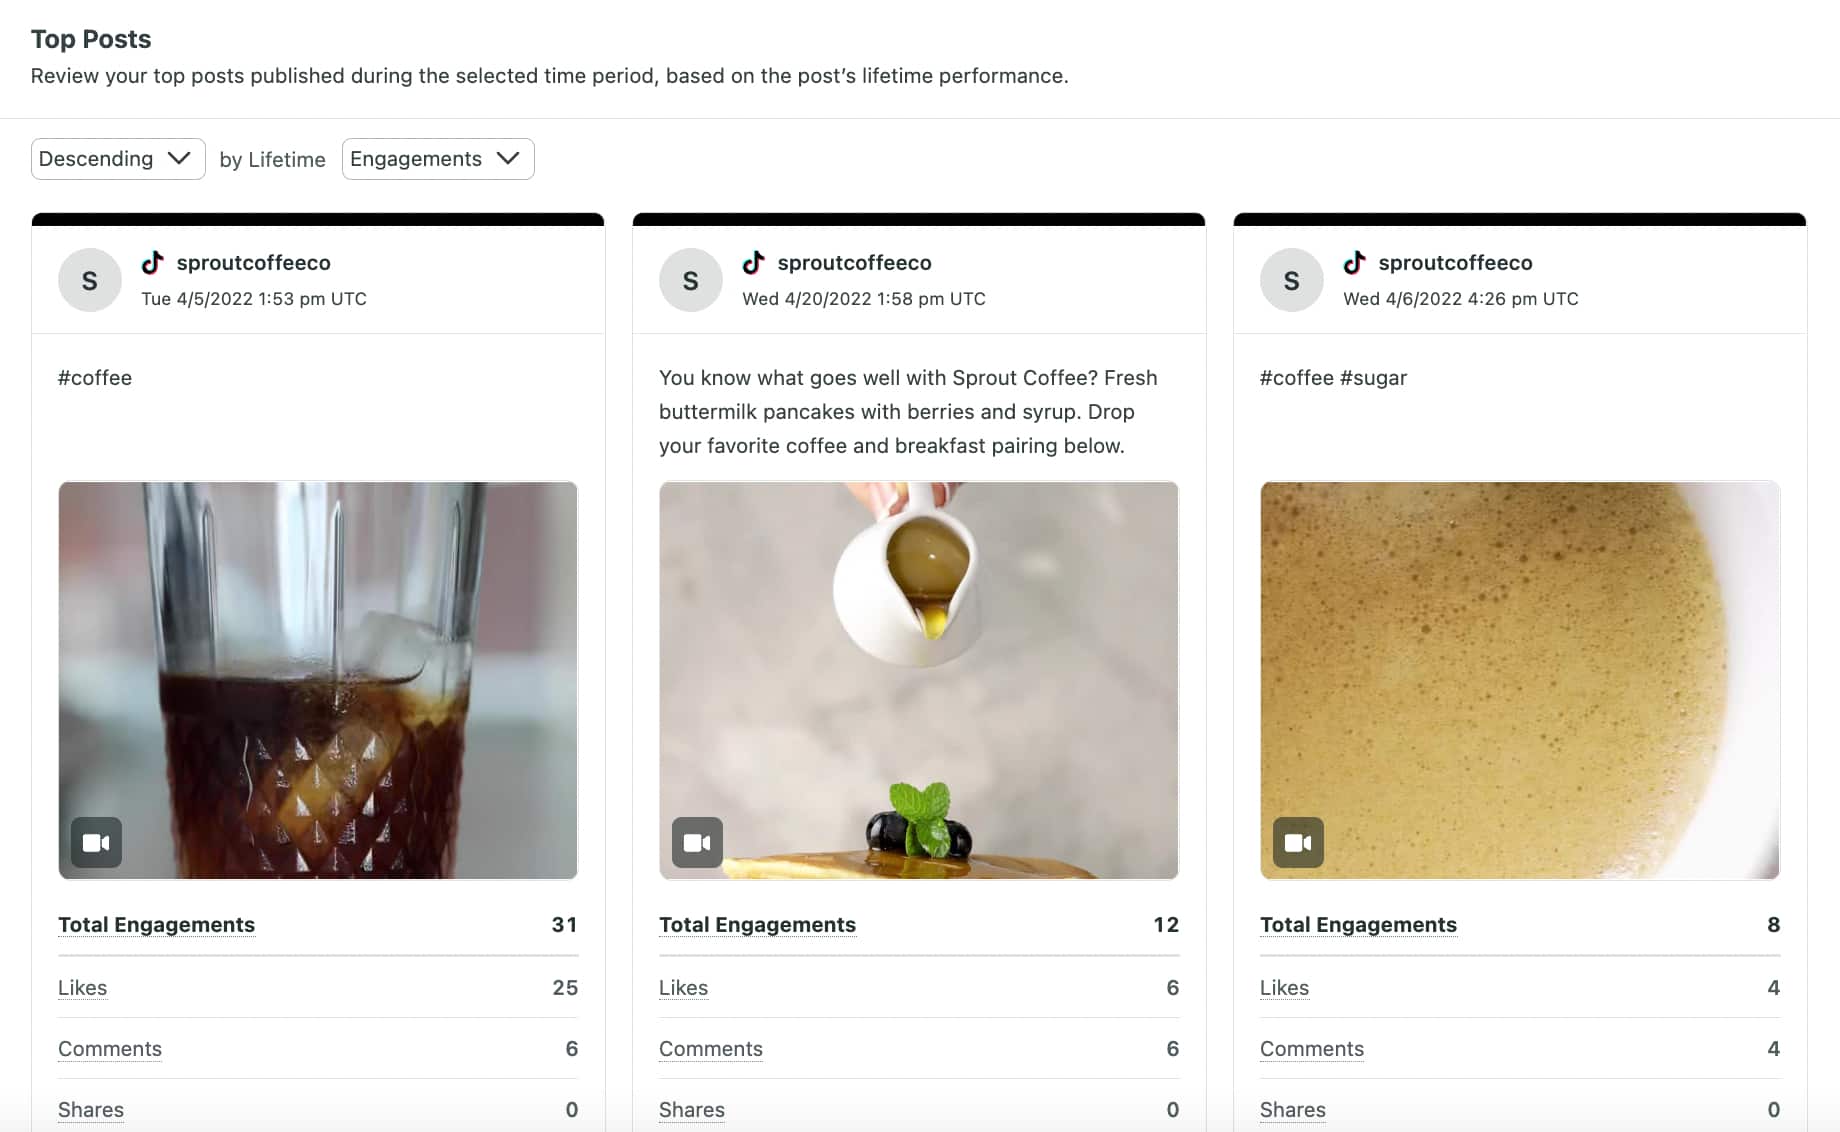
Identify top-performing content: “Top Posts” helps you quickly see which videos are resonating most with your audience. Use this information to understand what works best and create more of it.
Understand your audience: “Demographics” provides valuable insights into who your followers are, including their location and gender. Tailor your content to their interests and preferences.
Compare profile performance: Manage multiple TikTok accounts? The “Profiles” tab lets you compare their performance side-by-side, revealing which strategies are most effective.
Harnessing the power of analytics is a powerful way to show the business value of TikTok to your stakeholders. For even more insight on how to do this, watch our on-demand webinar on “how to show the business value of TikTok to your boss“.
How to use TikTok analytics for greater ROI
TikTok analytics transforms social media from expense to investment. Data-driven strategies deliver measurable results: higher engagement rates, expanded reach and clear proof of business impact that stakeholders understand and support.
Follow this step-by-step breakdown to help you use TikTok analytics for greater ROI.
1. Define your target audience
The TikTok algorithm is complex and changes frequently, but your audience will always be your foundation. Start by identifying your target audience on TikTok. Use demographic and behavioral data from TikTok analytics to determine who your content should be targeting.
Also consider how they engage with your content, especially in the comments. This step is crucial for tailoring your video content strategy to meet your audience’s needs and preferences.
2. Set objectives and key performance indicators
Clearly define what you want to achieve with TikTok. Set specific, measurable goals and identify key performance indicators (KPIs) that’ll help you track your progress and determine if your efforts are paying off. This includes metrics like engagement rate, views or follower growth, but the KPIs you choose will depend on your goals.
For example, if your goal is brand awareness, then reach, impressions and engagements would be your metrics.
3. Track and analyze performance regularly
Regularly monitor TikTok analytics to assess the performance of your content and campaigns. Establish a cadence for your reporting process, whether it’s monthly, quarterly or biannually. Use these insights to understand what works and what doesn’t, along with any trends to gauge the overall effectiveness of your efforts.
4. Experiment and optimize content based on data-driven insights
Use the data from your analytics to test different types of content, posting schedules and other factors. Analyze results and refine your approach based on what the data tells you. For example, you discover your audience enjoys collaborations with people in the TikTok Creativity Program and increase the amount of creator activations.
This continuous loop of experimentation and optimization will help you maximize your content’s impact.
5. Engage with your community
Engagement is part of the culture on TikTok. Use analytics to learn more about who your audience is and what they like. Respond to comments, participate in trends that align with your brand and ask for feedback to create content that resonates with your viewers.
Building a strong community will enhance user interaction and loyalty.
6. Measure success and share results to stakeholders
Compile and review the data of your TikTok campaigns against the objectives you set. Prepare detailed reports to share these results with stakeholders. Clear communication of successes and learnings will support ongoing investment and strategy refinement.
For example, if you share which TikTok Ads led to conversions or total conversions for your campaign, it helps establish a case for more resources.
7. Stay agile and iterate on your strategy
The TikTok landscape is ever-changing, so agility is essential. Stay flexible and be ready to adapt your strategy based on new trends, platform updates and evolving audience preferences. Regularly revisiting your strategy based on fresh analytics will keep your campaigns effective and relevant.
By following these steps, you harness the power of TikTok analytics to drive greater ROI for your social media campaigns.
Advanced strategies for data-driven TikTok growth
Once you master the basics, it’s time to turn data into a competitive advantage. Use your analytics to perform competitive analysis. See what resonates with your shared audience and identify the content gaps your brand is uniquely positioned to fill.
Go beyond surface-level demographics. Use performance data to refine your audience personas. Understanding not just who they are but how they behave on the platform transforms your content from generic to indispensable.
Scale your TikTok strategy with comprehensive analytics
It’s challenging and time-consuming to combine data from multiple native analytics reports across every social platform. Add in the task of keeping up with trends on top of making creative content and you’ve added significant responsibility to your plate.
That’s where Sprout Social comes in. Our social media management platform helps you keep track not just of TikTok, but other networks too, like Instagram, Facebook and YouTube. Our platform’s advanced analytics and AI-powered tools will save you time, so you have more space to be creative and experiment. Keep up with what consumers most want out of short-form video with our TikTok integration.
Start your free trial and discover how comprehensive analytics accelerate your social strategy.
TikTok analytics FAQs
Do I need a TikTok business account to access analytics?
Yes, TikTok’s full analytics suite requires a free Business Account. The switch is instant and unlocks all performance metrics and audience insights.
How far back does TikTok analytics data go?
TikTok’s native analytic’s data is limited to ~60 days for many metrics. Comprehensive platforms like Sprout Social provide unlimited historical data for year-over-year analysis.
Can I export TikTok analytics data for reporting?
TikTok’s native tool does not offer a direct export feature for its analytics dashboards. To create comprehensive, shareable reports for stakeholders, you’ll need a social media management platform that provides advanced reporting and export capabilities.
How often does TikTok update analytics data?
TikTok analytics data typically updates once per day. Keep in mind there is a delay, so the metrics you see today reflect the performance from the previous day.
What's the difference between TikTok reach and impressions?
Reach is the total number of unique users who saw your video. Impressions are the total number of times your video was displayed, which means a single user accounts for multiple impressions. Reach tells you how wide your audience is, while impressions indicate your content’s total visibility.
Additional resources for TikTok Analytics

What TikTok metrics you need to track for TikTok marketing in 2026

14 TikTok analytics tools to boost your strategy in 2026
TikTok analytics: data-driven strategies for growth

7 steps to successful TikTok hashtag analytics

TikTok monitoring tools to protect your brand and scale your social strategy

Share