August 23, 2019
Access 30-Day Volume Preview when Creating a Listening Topic
Advanced Listening users will now be able to see a full 30-day volume snapshot when previewing a Topic in the Query Builder.
Note – this preview data is built upon Twitter data only, so if the Topic contains other networks the actual volume count is likely to be higher.
- HOW-TO:
- Once you preview your Topic and the data populates, click the blue “spark line” under the Topic Preview header (it will show a number and a mini-chart line).
- A new chart will appear, which shows the Topic volume for the past 30 days (across Twitter only).
- Hover your mouse across any point of the chart line to see a daily volume snapshot.
- Click the green “Start Listening” button to begin listening to the Topic in Sprout.
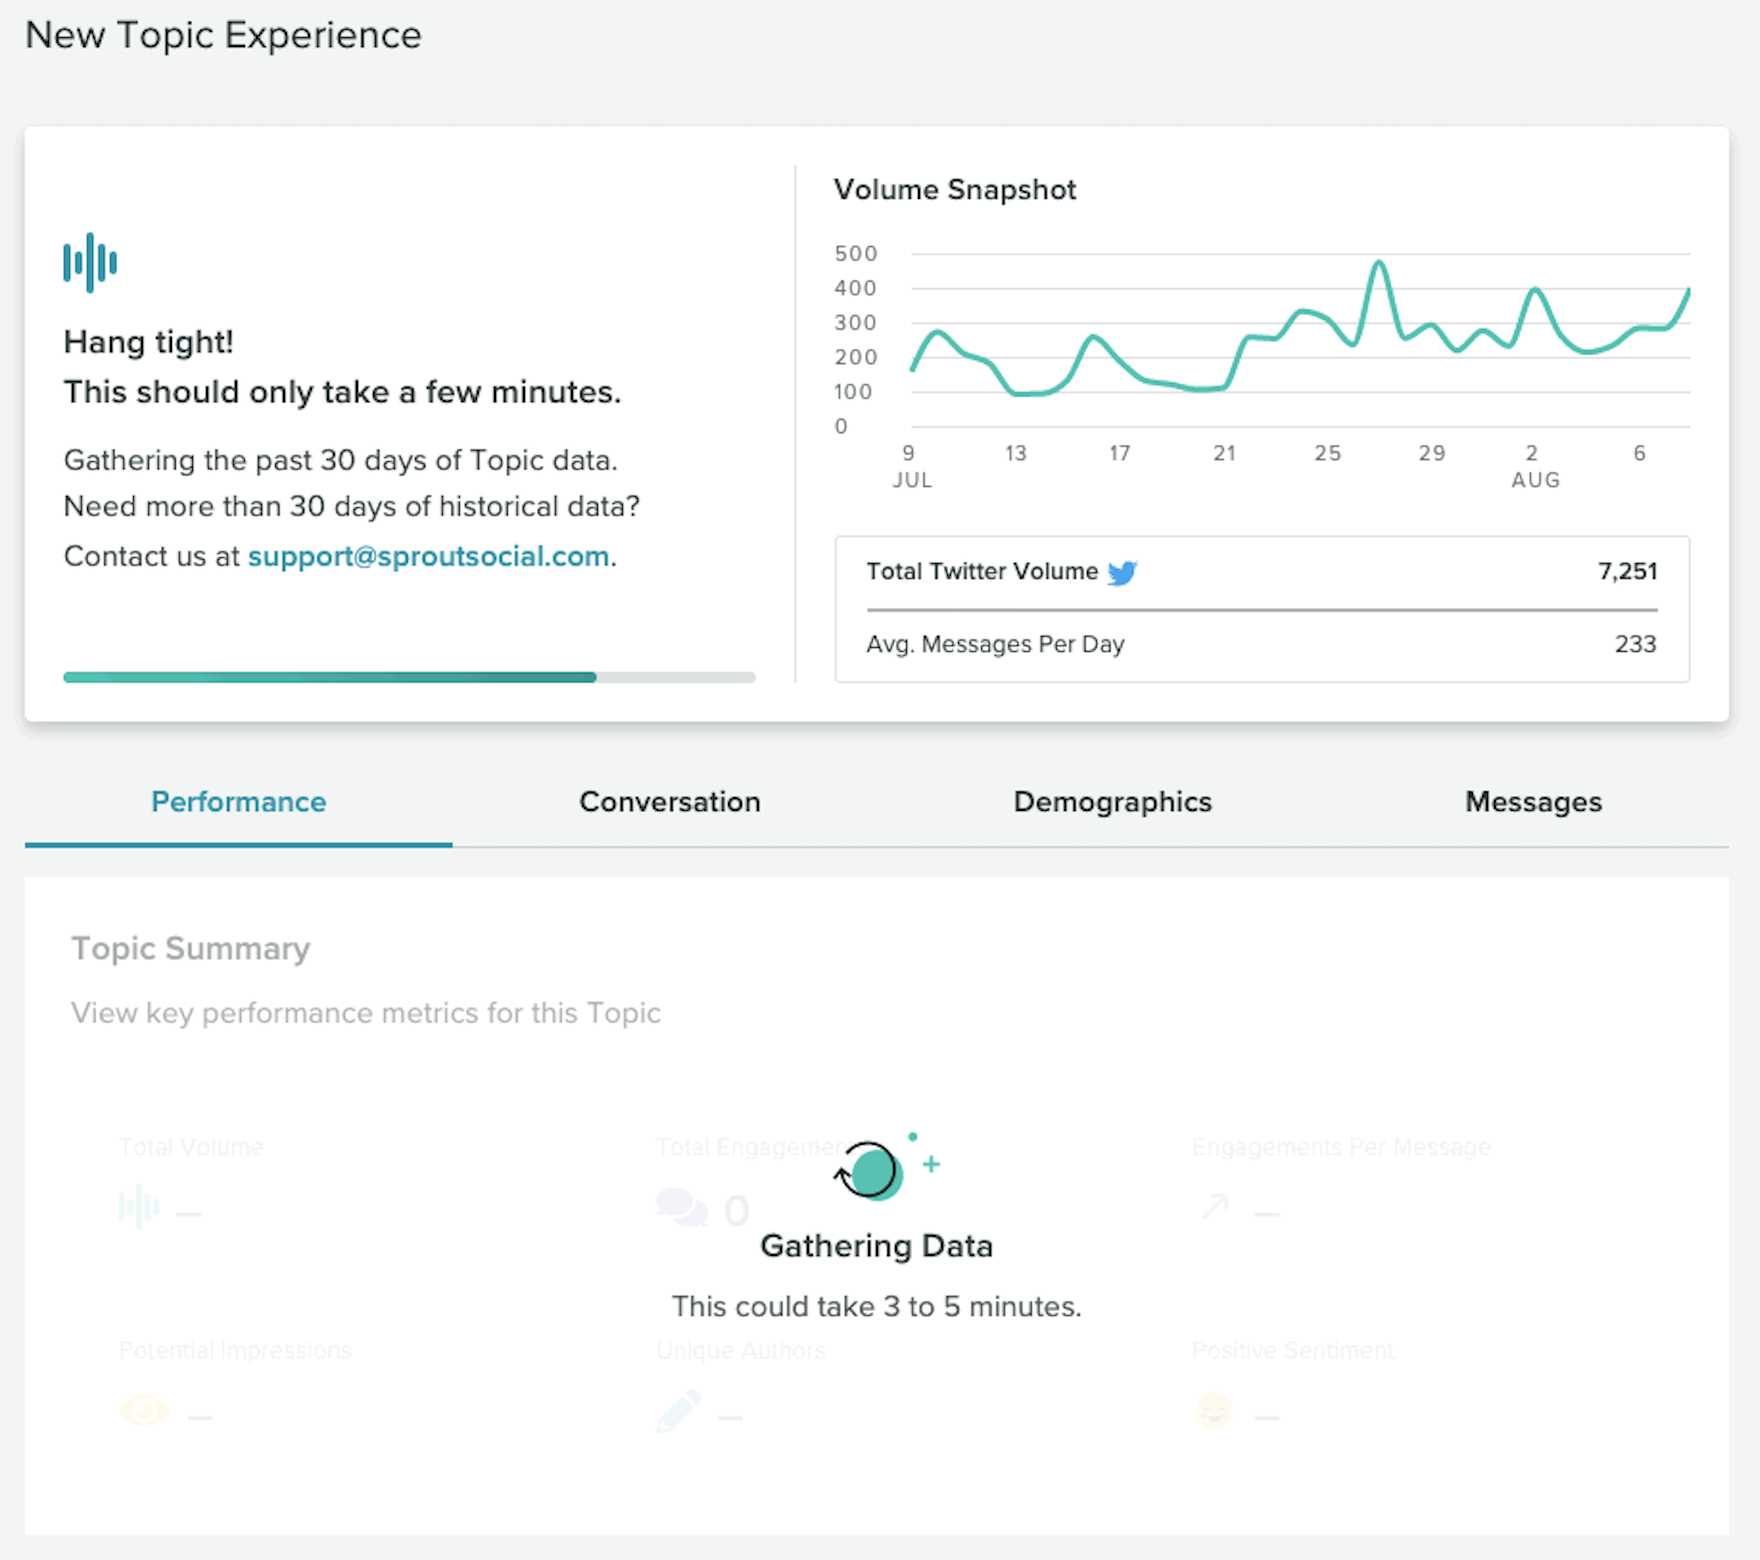
Progress Indicator for 30 Day Backfills
Advanced Listening users will now be able to track the data gathering process after they create a new Topic in the Topic Builder.
- HOW-TO:
- Once you’ve clicked “Start Listening”, a new panel will appear at the top of the Insights view that shows a progress bar for the data gathering process (can take 3-5 minutes).
- Once the data has been successfully gathered and processed, click the “Refresh” button to refresh the data.

Share