How to create Twitter reports with Sprout Social

Your social strategy means more with numbers—whether it’s looking at your share of voice or tracking your audience engagement, reporting is essential. Sprout took a wealth of information and broke it down to provide you with a handful of intuitive reports. Take a look at your Twitter (rebranded as “X”) Profiles, Post Performance, and Twitter Comparison Reports in Sprout to gain insight into how your brand is performing and to help guide your social media presence on Twitter.
Start a free trial of Sprout Social to follow along with this guide and test out these reports for yourself!
Getting Started with Sprout’s Twitter Reports
Take a look at Sprout’s Twitter reports to gain an understanding of your analytics on Twitter. Determine what types of content get negative feedback. Or, focus on the posts that create the most likes, comments, and shares. Then, take this information to build a content strategy that includes more of the posts that your audience wants to see.
Running the Trends Report
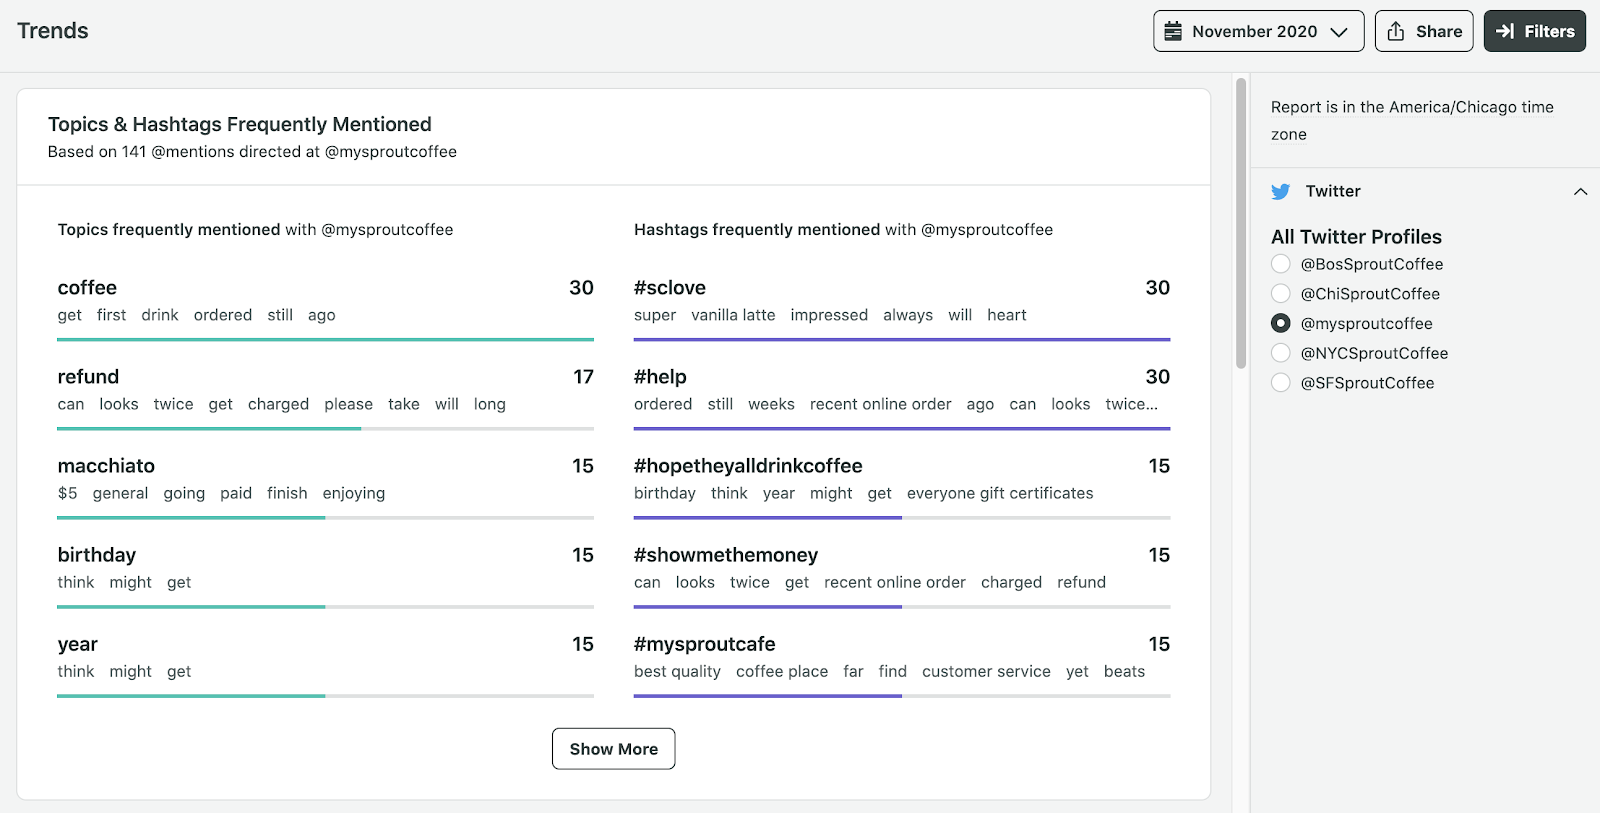
See the hashtags and topics that are most commonly mentioned with your connected profiles. You’ll also see the people and brands that are most frequently talking about and mentioned with your profiles. Sprout automatically analyzes all of your @mentions for the selected Twitter profile and surfaces popular topics and hashtags for the selected date range.
To run the Twitter Trends Report:
- Navigate to the Reports tab
- Click Trends Report
- Select the appropriate date range & profiles.

Understanding the Trends Report
Your Trends Report provides data for the dates you’ve selected, including:
- Topics Frequently Mentioned: The terms and phrases frequently used in your inbound @mentions for the selected Twitter profile. You’ll also see popular items around these terms and phrases.
- Hashtags Frequently Mentioned: The hashtags that are frequently used in your inbound @mentions for the selected Twitter profile. You’ll also see popular items around these hashtags.
- Topics Frequently Mentioned, by day: The top topics and the number of times they were included in @mentions for the selected Twitter profile by day.
- Hashtags Frequently Mentioned, by day: The top hashtags and number of times they were included in @mentions for the selected Twitter profile by day.
- People & Brands Frequently Talking About You: People or brands (superfans & passionate customers) who frequently mentioned this profile.
- People & Brands Frequently Mentioned with You: The people and brands (think peers & competitors) who are frequently mentioned along with your brand.
Running the Twitter Profiles Report
To get an at-a-glance view of everything that is going on with your Twitter profile, run the Twitter Profiles report.
- Take a look at the number of @mentions you get as well as more specific details about your followers, including total number, age, gender, and the most active day of the week.
- See how your audience is interacting with your content–then, build an engagement strategy that speaks to your brand’s demographics and drives performance.
- Get a glimpse at how your content is traveling across Twitter by looking at how information is shared. This includes the number of retweets (or users posting your content).
To run the Twitter Profiles Report:
- Navigate to the Reports tab.
- Click Twitter Profiles.
- Select the appropriate date range.

Understanding what’s on the Twitter Profiles Report
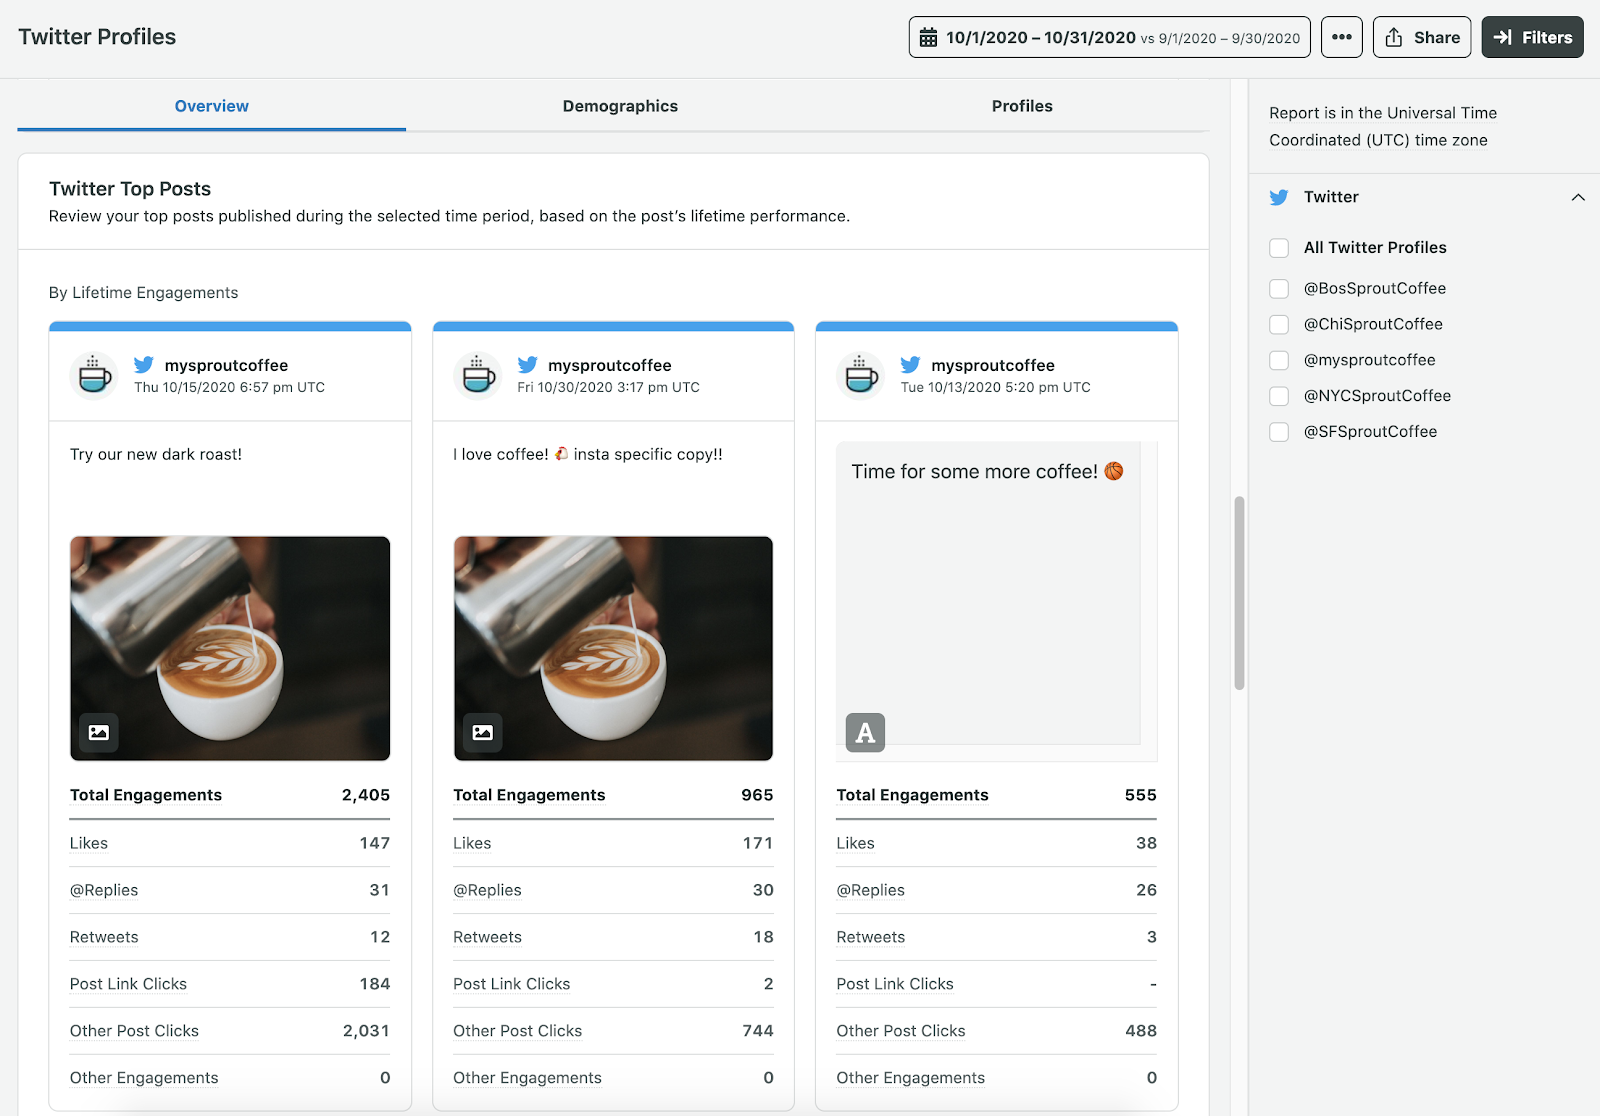
Your Twitter Profiles Report contains three tabs that show your key Twitter performance for the time period and Twitter profiles you select.
The Overview tab provides a performance summary breakdown with insights into your impressions, engagements and post link clicks. You also get an interactive chart for your audience growth, publishing behavior, top posts, engagement and impressions.
The Demographics tab gives you a complete breakdown of your audience by age and gender of the last day of your reporting period. This gives you an idea of who is consuming your content the most and can give you direction on the types of content you should post to cater to this audience.
The Profiles tab gives an aggregate of profile metrics in a table to quickly compare and contrast your performance across Twitter profiles.
Running the Report on Post Performance for Twitter
While the Twitter Profiles Report helps you understand overall profile performance, the report on Post Performance can help you understand the performance of individual Twitter posts.
To run the report:
- Navigate to the Reports tab.
- Click Post Performance under Cross-Network Reports.
- Select the Twitter profiles you want to see.
- Select the appropriate date range.

Understanding the your Post Performance on Twitter
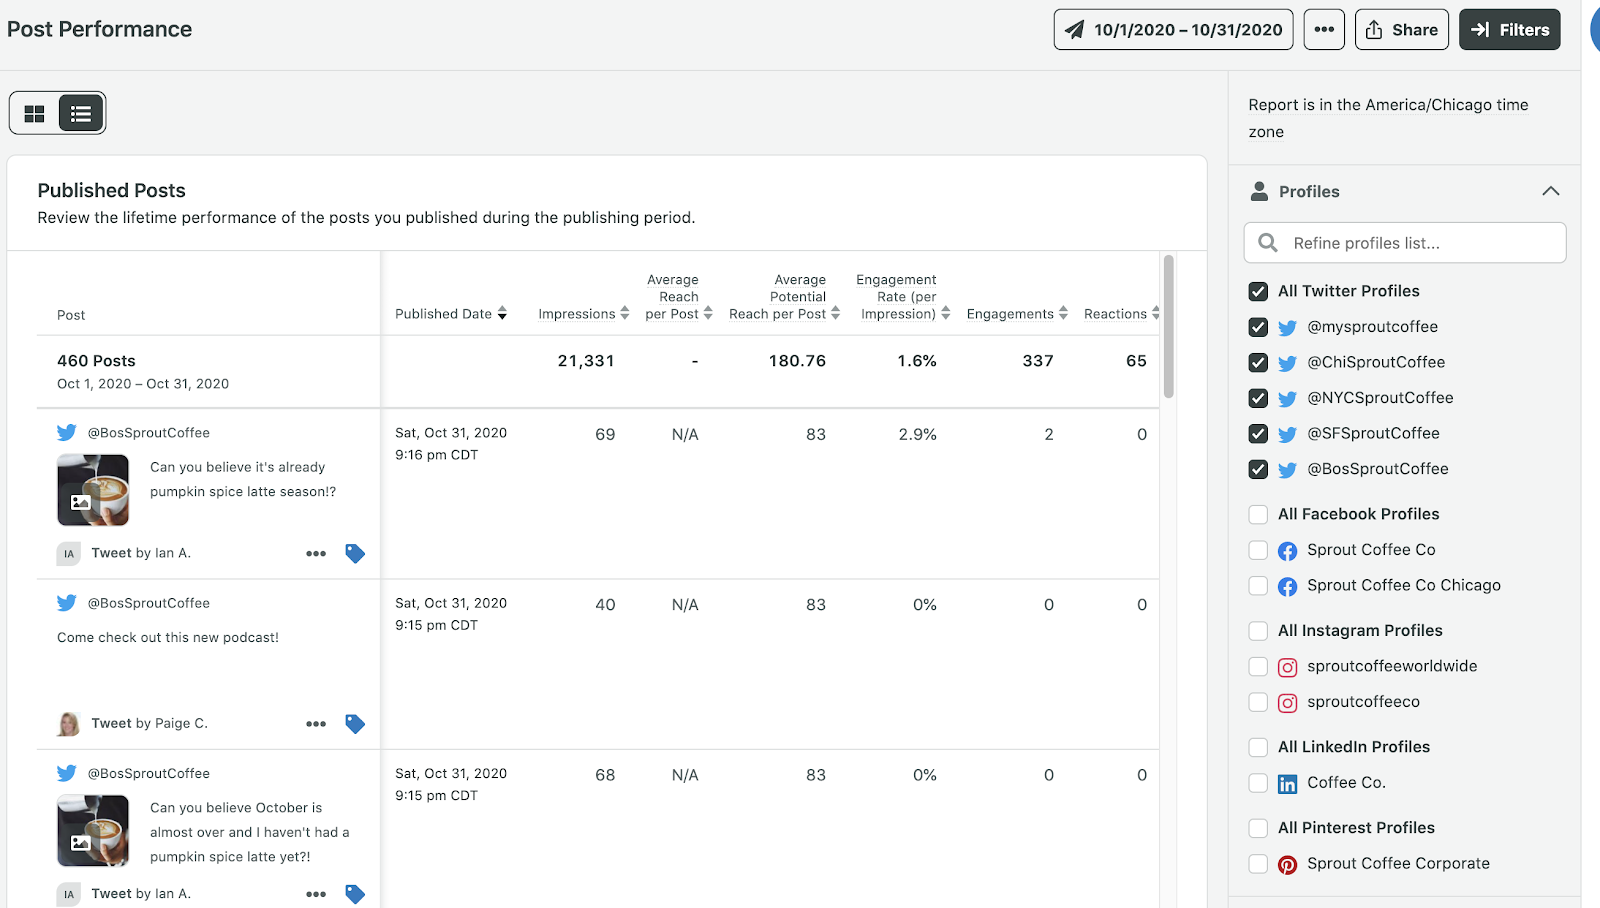
Your report on Post Performance has a number of columns and data–here’s a breakdown of what shows on your report. The chart provided in this report shows the lifetime performance of your posts during the time period you selected. You can see information such as the published date, average reach, and comments and shares. You can narrow your focus to hone in on Quote Tweets or @Replies from the right-bar. Or, analyze a Sprout author’s performance on the content they publish.
Running the Twitter Competitors Report
Gain some insight on the Twitter usage of your brand compared to that of your competitors with this report.
Keep in mind that the Twitter Competitors Report may not be available for up to 24 hours as Sprout needs time to access that profile data from Twitter.
To run the Twitter Competitors Report:
- Navigate to the Reports tab.
- Click Twitter Competitors.
- Select the profiles you want to see in the report.
- Select the appropriate date range.

Understanding the Twitter Competitors Report
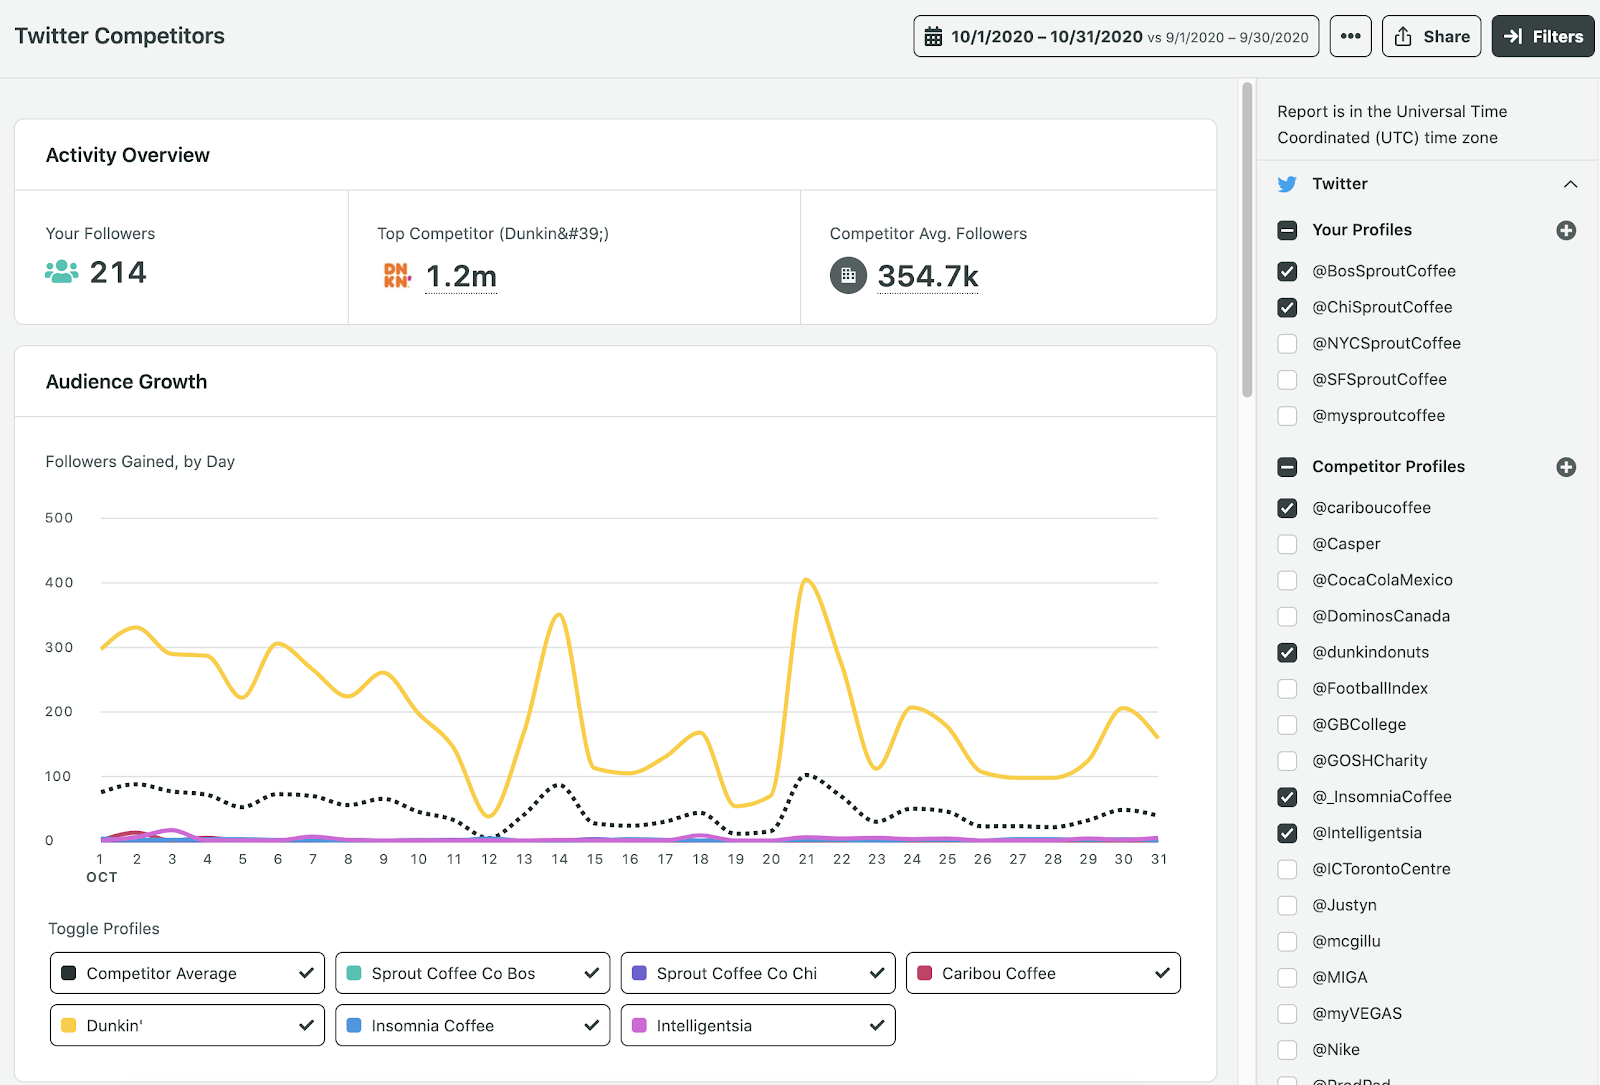
Your Twitter Competitors Report has a number of charts and data for the dates you selected.
In the Activity Overview, you get a high-level overview of your followers, your top competitor and their followers, along with the average number of followers the competitors you selected have.
You can compare your overall audience growth by day or see a breakdown by audience growth by profile for the time period you selected. Dive deeper with @Mentions by day and @mentions by profile to see how often your competitors appear in conversation and how you stack up.
Use Sprout’s Twitter Reports to Improve Your Social Media Strategy
Identify strong points and areas for improvement within your social media strategy by running your Sprout reports on a periodic basis (monthly, bi-weekly, or whatever makes sense for you). With this data you can:
- See what sort of impact your content is having.
- Make smarter decisions on how to increase your social media presence.
- Analyze the results of your strategy by visualizing how any tweaks in your social strategy translated into responses among your followers and fans.
Get a hands-on look at how you can use the reports in this guide by starting a free trial of Sprout Social today!
Use of Twitter nomenclature across Sprout refers to newly rebranded X platform and related terminology.
- Categories
45+ Twitter (X) stats to know in marketing in 2025
Published on March 20, 2025 Reading time 12 minutes


Share