Social Media Statistics
120+ Must-know social media marketing statistics for 2026
Discover the latest social media statistics to refine your strategy, uncover new opportunities and stay ahead in 2026.
This comprehensive dataset highlights the major shifts in social search, video consumption, and platform ROI. To effectively act on these numbers, track your own audience performance, and optimize your multi-channel distribution, start with our free trial.
Reading time 16 minutes
Published on February 9, 2026
Table of Contents
Summary
- Social platforms like TikTok, Instagram and YouTube collectively account for over 60% of product discovery, surpassing Google and signaling a major shift in how people research and decide what to buy.
- Short-form video delivers the highest ROI among video formats (41%), and 94% of organizations say influencer marketing outperforms traditional digital advertising, often delivering 2x–3x returns.
- Human-generated content is the #1 priority for users in 2026, and 73% of consumers say they’ll switch to a competitor if a brand doesn’t respond on social media.
Social media strategies are entering a new phase in 2026.
AI is now deeply embedded in content creation and distribution, while audiences are becoming more selective about what they engage with. They want authentic voices and useful content, not just more posts filling their already crowded feed.
Search behavior is changing too. Instead of heading straight to Google, people are using social media platforms like Instagram and TikTok to find products, read reviews and compare options.
That’s why data matters more than ever.
When you understand who uses each platform, how they behave and what they respond to, your social media marketing strategy starts delivering strong ROI.
Below are the top social media marketing statistics to know in 2026.
Global social media usage statistics
Social media use hasn’t slowed down. People are simply spreading their time across more platforms and spending hours on them every day. Understanding where that time goes and how users move between apps is key to building a strategy that works.
Here are some of the top social media demographics and usage stats worldwide.
- In 2026, there are around 5.66 billion active social media users worldwide.
- The typical user hops between 6.75 different social networks per month.
- Globally, users spend around 2 hours and 40 minutes daily on social media apps.
- The average person in the UK spends 4 hours and 20 minutes online each day.
- Australians spend an average of 6 hours and 20 minutes per week on social media.
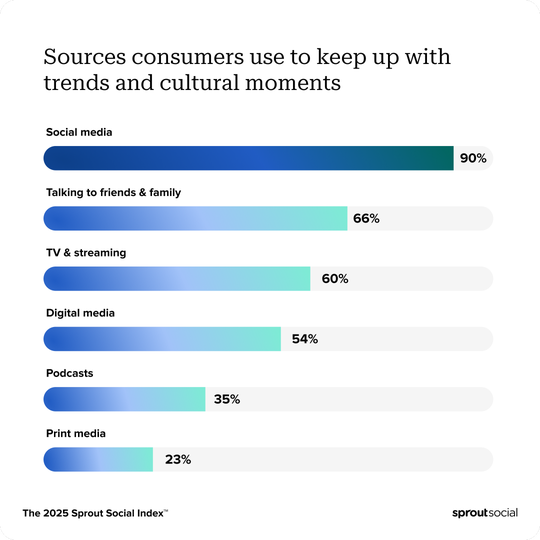
- Ninety percent of consumers rely on social media to keep up with trends and cultural moments.
With users jumping between nearly seven platforms each month, relying on just one channel isn’t enough. Brands that pay attention to how people really use social media networks can focus their efforts, show up in the right places and get more out of every post.
While global averages provide a strong baseline for overarching strategy, whether you are steering an enterprise matrix or a lean startup, regional nuances ultimately dictate how campaigns perform. If your primary market is the UK, benchmarking against dedicated social media statistics for the UK ensures your resource allocation aligns with highly localized consumption habits.
Ready to seamlessly manage all your social media networks from a single, centralized dashboard?
Social search and discovery statistics
Social platforms are quickly becoming the go-to place for discovery and research. People want genuine experiences and human perspectives, not automated answers or overly polished brand content. Here are some stats that highlight the rise of social media search in 2026.
- Social media platforms like YouTube, TikTok and Instagram now collectively drive over 60% of product discovery, while Google only accounts for 34.5% of total search share.
- Around 52% of users prefer social search over AI chatbots when looking for user-generated content and personal experiences.
- Among Gen Z, 52% say they trust brand or product information found on social media more than information from Google or AI chatbots.
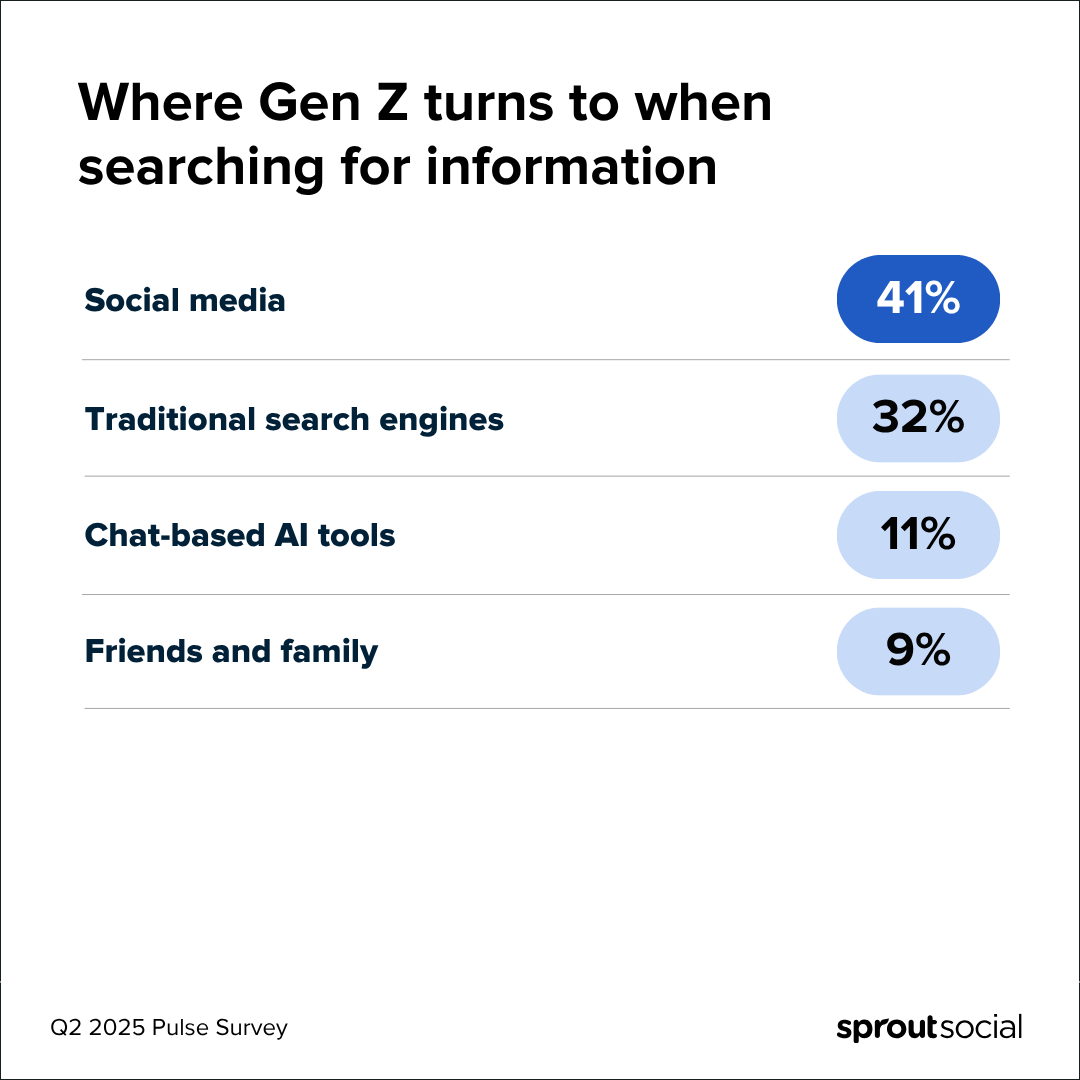
- When searching for information online, 41% of Gen Z turn to social media networks first.
Social media is no longer just where discovery starts. For many users, especially Gen Z, it’s where buying decisions are made. Brands that show up with authentic voices and searchable content are more likely to earn trust and attention.
Social media advertising statistics
With hundreds of billions flowing into social ads and a growing share of spend moving to mobile, paid social is now a core channel for reaching audiences and boosting brand awareness, sales and engagement at scale.
Below are key social media advertising stats to inform your strategy.
- Total spend on social media advertising is projected to reach $317.33 billion in 2026.
- It’s now projected that 82.9% of total social media ad spending will be generated through mobile by 2030.
- Social media ads are the leading source of brand awareness among internet users aged 16 to 34.
- Ad spending on social media is expected to grow by 10.90% each year from 2026 to 2030.
- Social media ads account for $3 in every $10 spent on digital advertising.
- Around 80% of marketing leaders plan to shift budget from other channels to social, and 87% expect their paid social spend to increase.
As social ad spend continues to rise, so does competition. Success now depends less on spending more, and more on spending smarter. Brands that focus on precise targeting, strong creative and strategic budget allocation are more likely to see returns, while others risk getting lost in increasingly noisy feeds.
Social media ROI statistics
Understanding how social efforts contribute to business outcomes is just as important as tracking engagement. The social media marketing ROI statistics below highlight how teams measure impact today, their challenges and where they see the strongest returns.
- When tracking social media ROI, teams focus primarily on engagement (68%), conversions (65%) and revenue impact (57%).
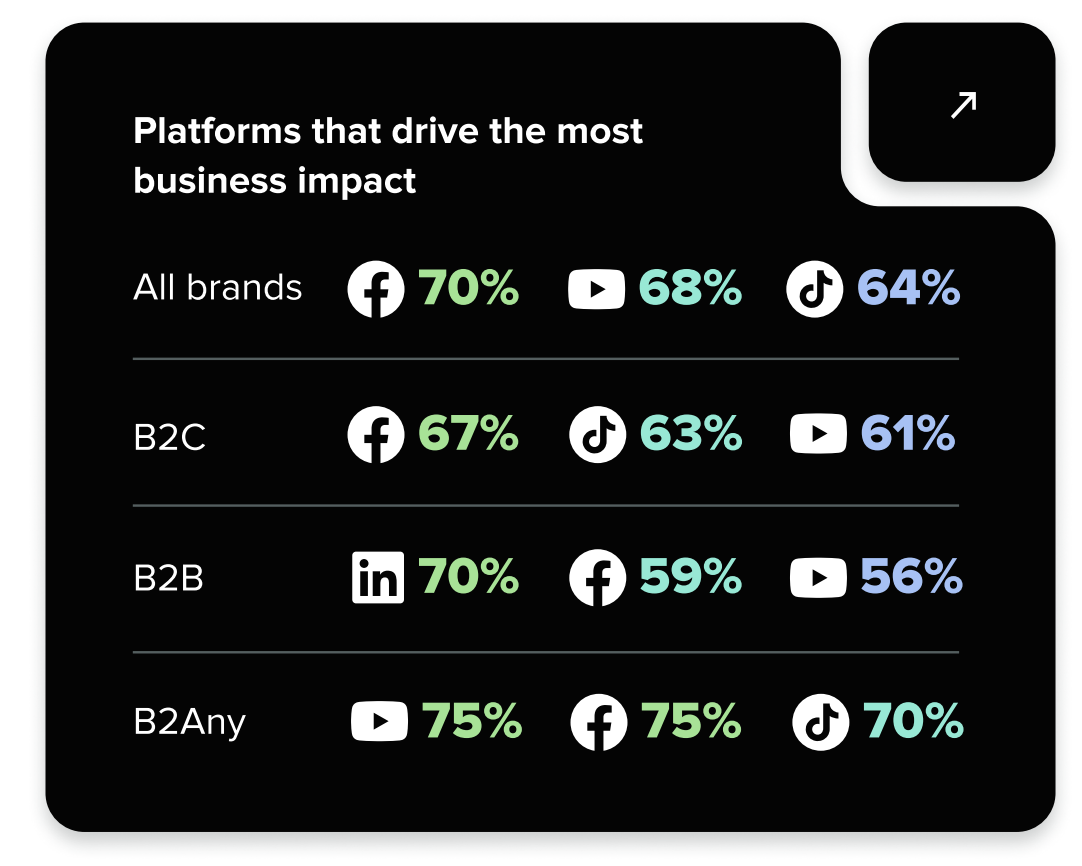
- Facebook, YouTube and TikTok drive the most business impact overall, though B2B marketers consistently name LinkedIn as their strongest channel.
- Over half of marketing leaders say poor integration between social media tools and the rest of their tech stack is the #1 reason they can’t understand social’s business impact.
These insights show that strong social ROI comes from alignment. When metrics, content formats, platforms and tools work in sync, it becomes much easier to see (and scale) meaningful business results from social.
Bluesky statistics
Bluesky is still a smaller platform compared to established social networks, but its growth and audience make it worth watching, especially for brands exploring emerging channels. Here are some Bluesky statistics to know.
- As of January 2026, Bluesky has grown to over 42 million users.
- Most Bluesky visitors fall in the 25–34 age range, pointing to a younger audience.
- The United States accounts for over half (51.28%) of Bluesky’s website traffic, followed by Japan (8.92%), the UK (4.19%) and Germany (3.85%).
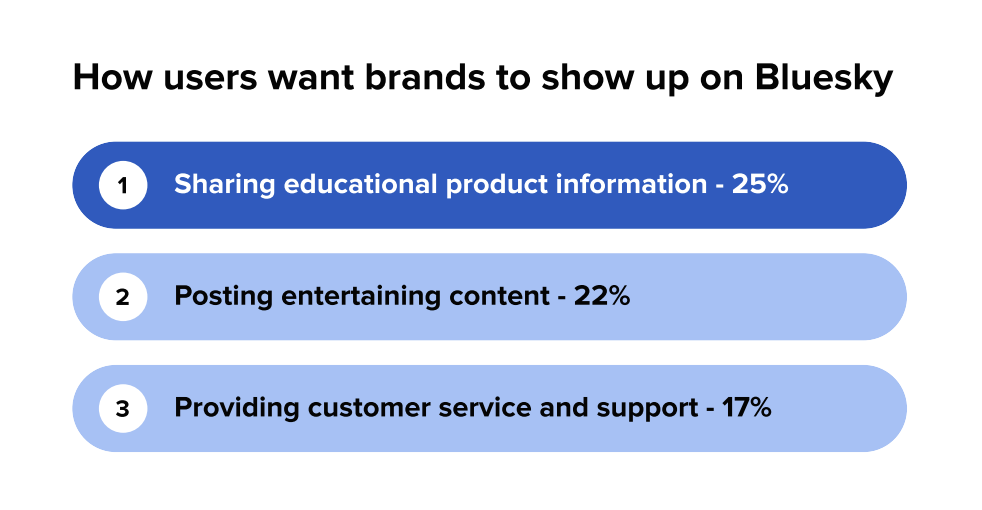
- On Bluesky, users expect brands to be helpful first. Product education ranks highest, with entertainment and customer support close behind.
- Over half (51%) of Bluesky users say they prefer it over other networks because of its customizable feed options.
- Already, 65% of Bluesky users engage with brand content at least once a week.
Bluesky may not be mainstream yet, but it offers early-mover potential. Brands targeting younger audiences, especially in the US, can use Bluesky to experiment with community-first content and establish presence before competition ramps up.
Plus, its relatively decentralized structure, user-controlled feeds and lack of built-in AI features might attract more users as AI fatigue sets in, making this platform one to watch.
Facebook statistics
Facebook is still one of the few platforms that can deliver both massive reach and strong buying intent. With global adoption, it continues to be a reliable channel for brands that want visibility and conversions, not just impressions.
The following Facebook statistics can clue you in further.
- Eighty-five percent of consumers across generations maintain a profile on Facebook.
- Facebook is the largest social network in the world with roughly 3.070 billion monthly active users.
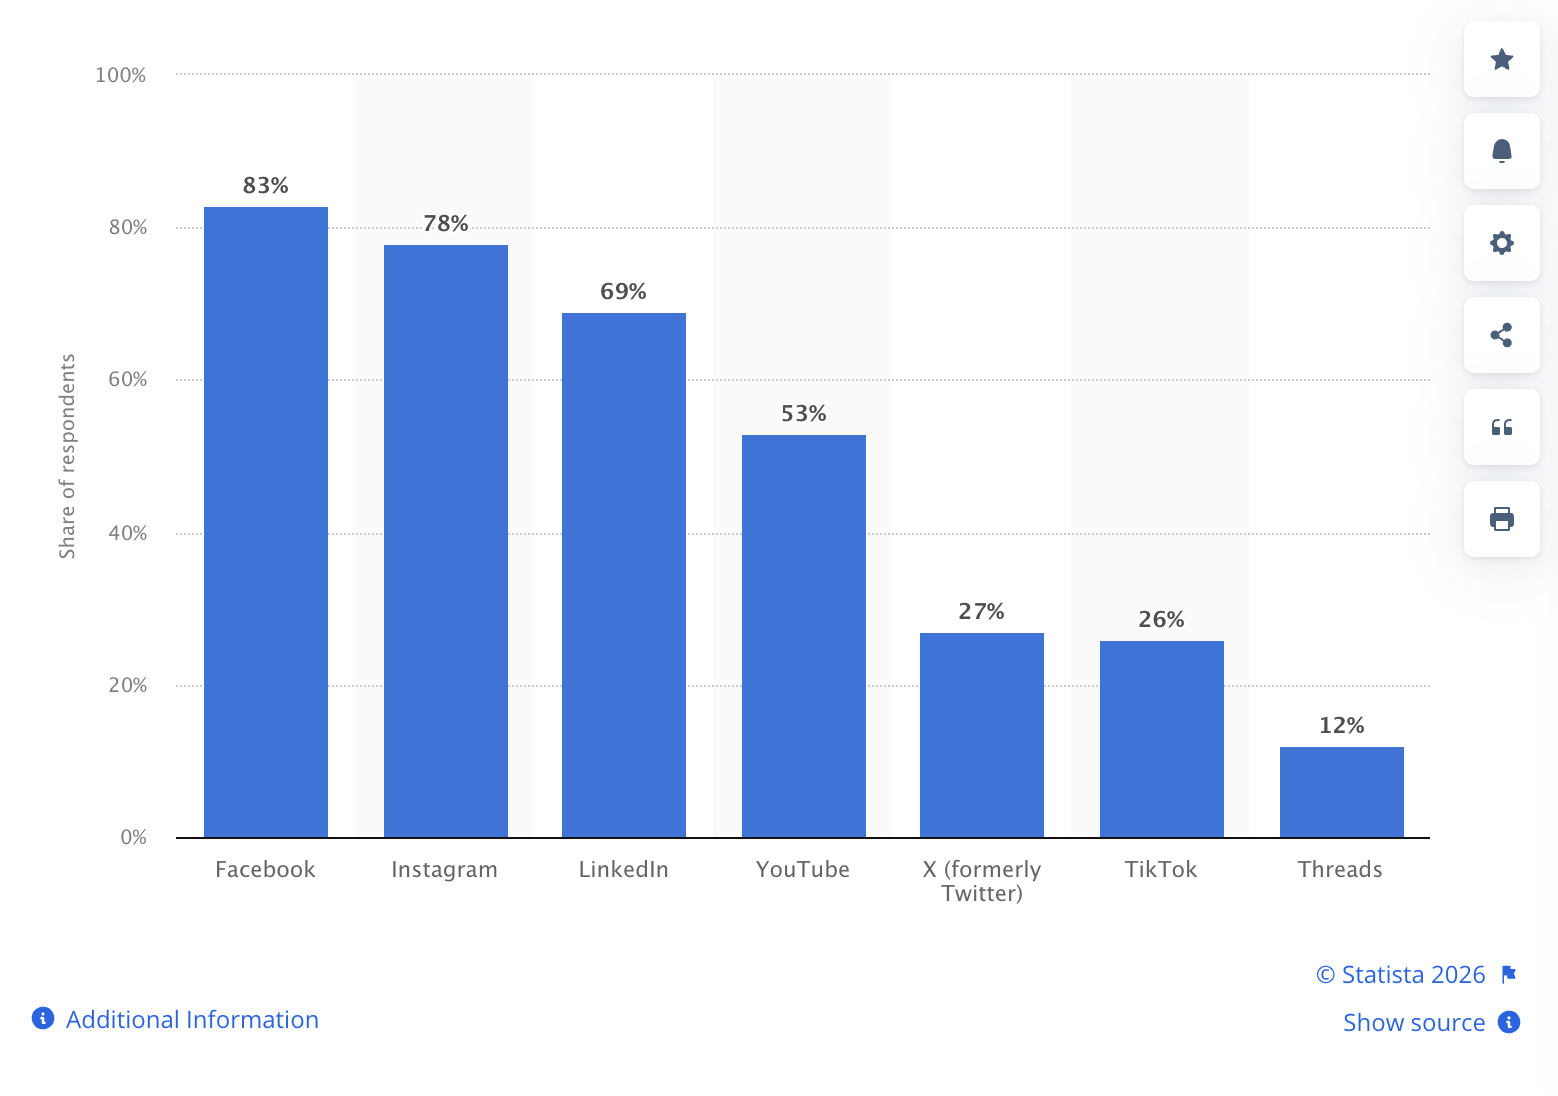
- Facebook is the most-used platform by marketers worldwide (83%). Instagram sits in second place (78%).
- Facebook’s biggest user group is males aged 25–34. In fact, male users outnumber female users across all age groups, except those aged 65 and older.
- Facebook is the #1 platform for product discovery and social customer service, which is a key pillar of broader 2026 social media ecommerce trends. Thirty-nine percent (39%) of consumers using it to find new products and 45% seeking support there.
- The average Facebook user spends around 1 hour and 7 minutes on the app daily.
- Facebook users are most likely to interact with short-form videos (48%) on the platform, followed by text posts (32%) and live video (22%).
Beyond offering reach, Facebook consistently influences buying behavior and attracts an audience that actively engages with brand content and reaches out for support.
With male users making up the majority across most age groups, brands that tailor targeting, messaging and creative to this audience are at an advantage. Also, combining paid ads with engaging video formats as well as community strategies can drive strong results.
Instagram statistics
Instagram is still influential for brands, but it’s being used differently than it was a few years ago. It’s no longer just a place to post polished visuals and chase likes. People are discovering products, interacting with brands and even getting support directly on the platform.
Below are the top social media statistics for Instagram.
- Instagram has 3 billion monthly active users.
- About 65% of social users have profiles on Instagram, second only to Facebook (85%).
- Most Instagram users are males aged between 25 and 34 years old.
- The average user spends around 73 minutes on Instagram each day.
- Reels made up more than half of all ads shared on Instagram in 2025.
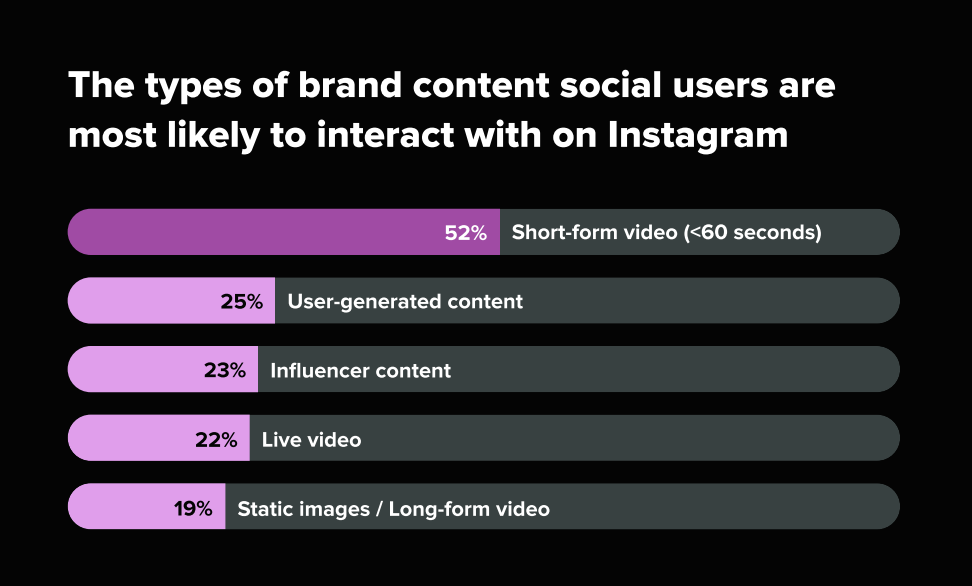
- Instagram users are far more likely to interact with short-form video (i.e. Reels) on the platform than any other format.
- Around 60% of consumers interact with brand content at least multiple times a week on Instagram.
- Seventy-two percent of Gen Z users prefer Instagram for customer care over any other channel.
- In 2025, Instagram’s engagement rate edged down to 0.48% from 0.50% in 2024, which is still more than three times higher than Facebook (0.15%).
Instagram’s value might have shifted, but it hasn’t disappeared. Reels now command a huge share of attention, shopping is a central behavior and Gen Z actively uses the platform for customer care. Brands that work video-first content, ecommerce trends and fast, conversational messaging into their Instagram strategy are more likely to see results.
LinkedIn statistics
LinkedIn has quietly become the main place where professional conversations happen online. With a huge global audience and strong adoption among B2B marketers, it’s where people go to learn, network, hire and keep up with what’s happening in their industry.
Here are some LinkedIn statistics you should know.
- There are around 1.3 billion members across 200 countries on LinkedIn.
- Thirty-five percent of all social users have a LinkedIn profile.
- The United States has the highest user rate in the world on LinkedIn with an audience reach of over 252 million users.
- LinkedIn is home to over 70 million company profiles.
- B2B marketers ranked LinkedIn as their most used social media platform in 2025.
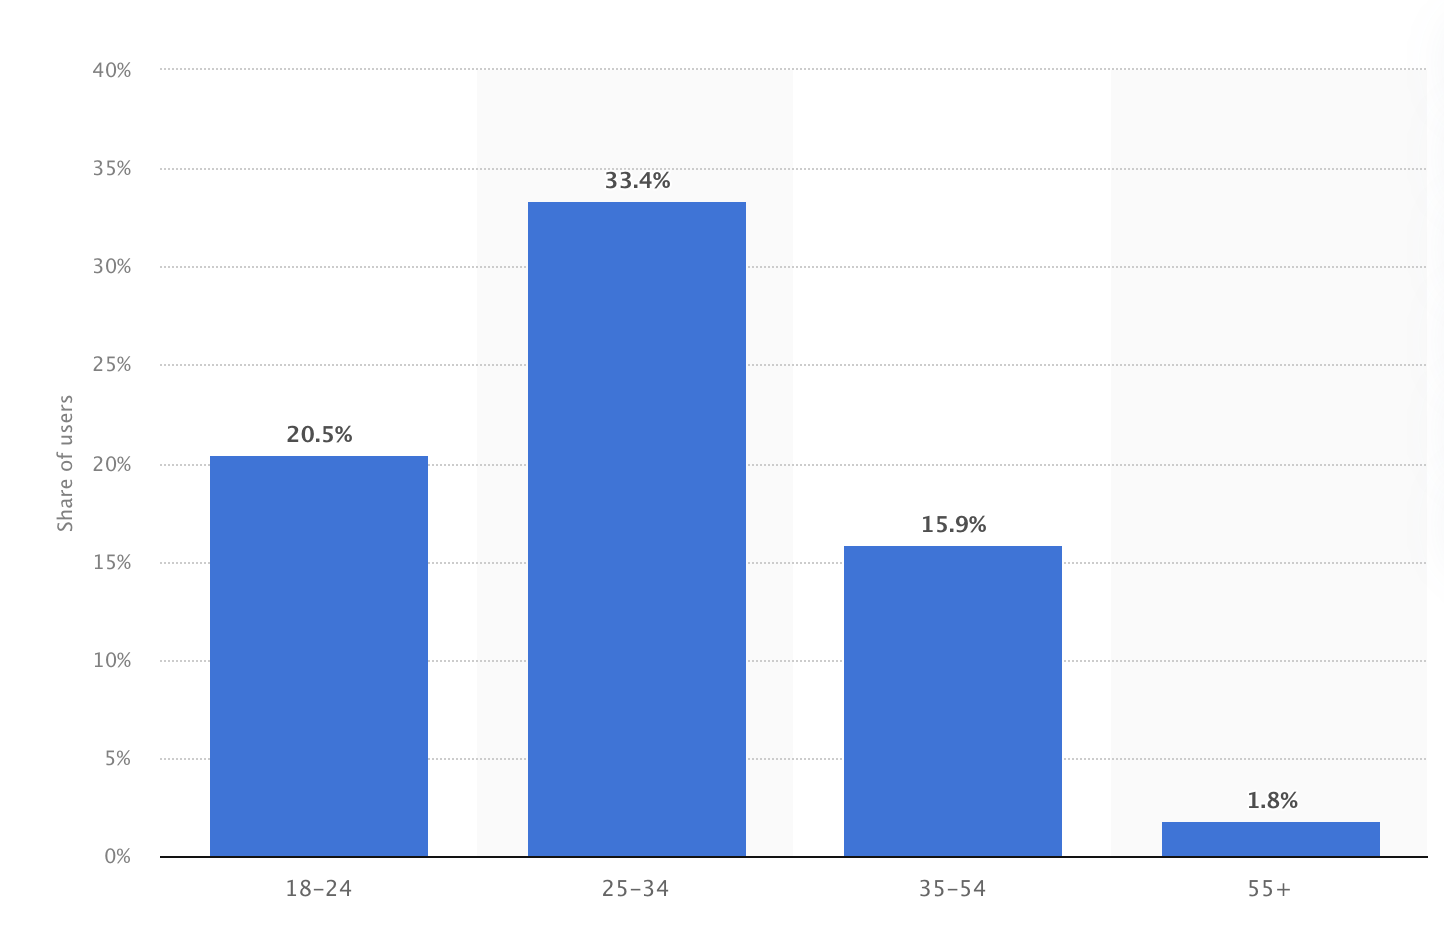
- About 33.4% of LinkedIn users worldwide are between ages 25 and 34 years old.
- Just over half (56.8%) of all global LinkedIn users identify as male.
- Nearly 70% of LinkedIn users engage with brand content at least once a week.
- Text posts drive the most engagement on LinkedIn, performing significantly better than UGC, images, videos and influencer content.
- LinkedIn users mainly want brands to share educational product content (24%) and company updates (24%) on the platform.
Most LinkedIn users engage with brand content regularly, and simple formats like text posts still get strong traction. For brands, this means you don’t need flashy content to win at LinkedIn marketing. Sharing useful insights, building a clear point of view and investing in personal branding can go a long way.
Pinterest statistics
Pinterest works differently from most social platforms. People don’t open it to catch up with friends or scroll mindlessly. They come with a purpose, usually to plan or get inspired before making a decision. That mindset changes how brands should think about showing up there.
Here are some top Pinterest statistics to look out for.
- Pinterest has around 600 million monthly active users.
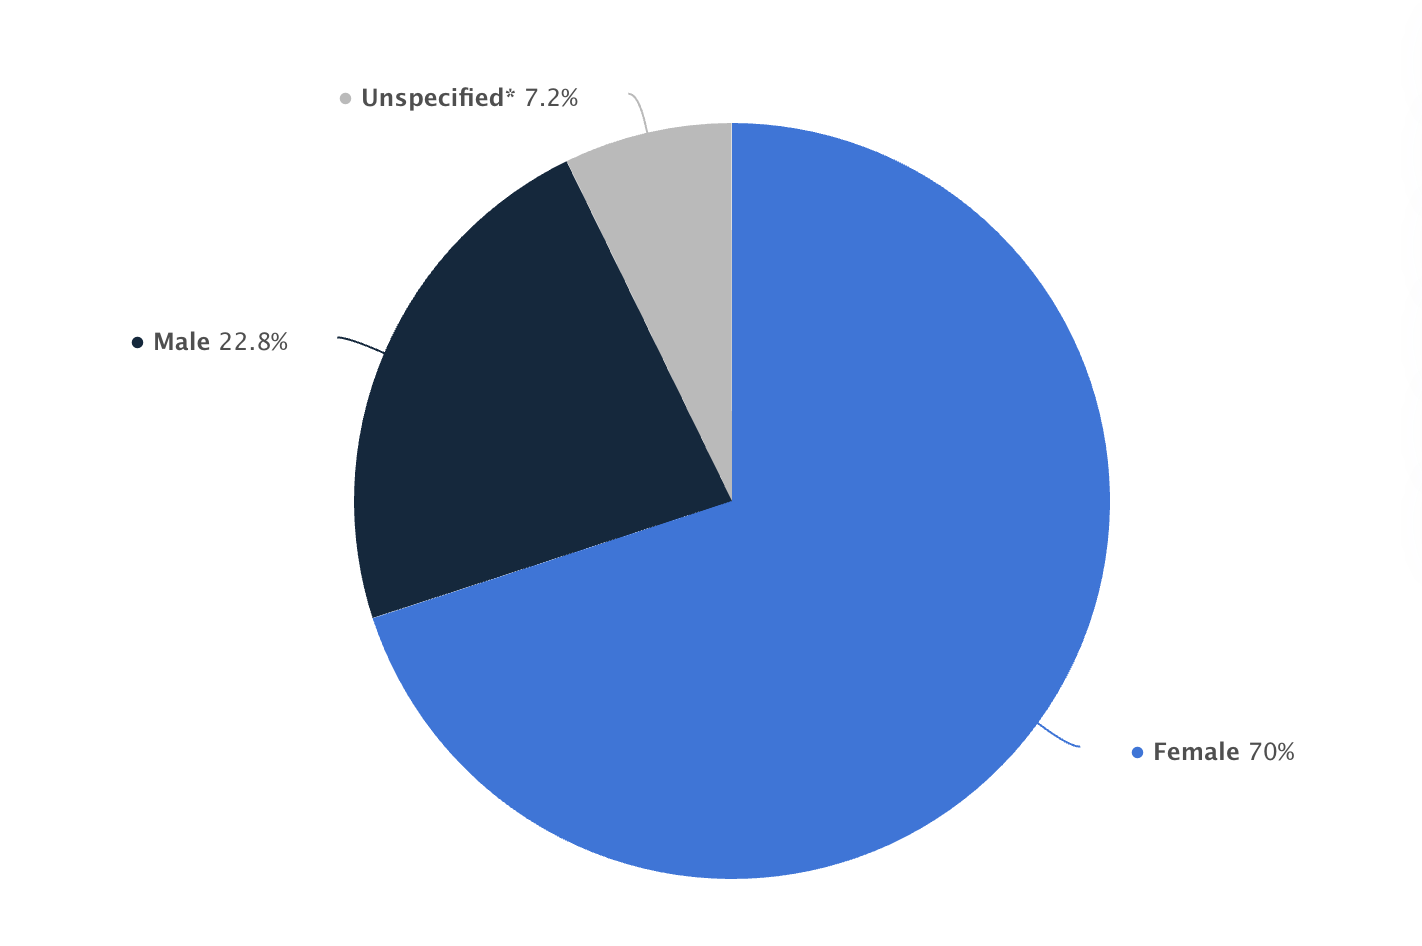
- Around 70% of Pinterest users identify as female, while 22.8% identify as male and 7.2% are of unspecified gender.
- Semrush estimates Pinterest.com receives around 1.17 billion visits each month, making it one of the most-visited websites on the internet.
- As of October 2025, Pinterest’s biggest audience sits in the United States, with approximately 96.9 million users.
- Around 96% of top searches on Pinterest are unbranded, showing discovery on the platform often happens without brand bias.
- Pinterest reaches around 40% of US households earning over $150K annually.
- About 70% of Pinterest users interact with brand content at least once a week, and that number rises to 78% among Gen Z.
Pinterest users are open to discovering new brands, have strong purchasing power and actively want more content from businesses. Marketers who invest in SEO-driven pins and high-quality Pinterest ads can capture an engaged audience ready to buy.
Reddit statistics
Reddit isn’t built for mass marketing, but that’s exactly what makes it powerful. With strong user growth, rising ad revenue and heavy daily usage, Reddit offers brands access to deeply engaged, niche communities.
Let’s look at the top Reddit statistics marketers need to know.
- In February 2025, there were around 765 million monthly active users on Reddit.
- Reddit reached 116 million daily active users in 2025, up 19% from the previous year.
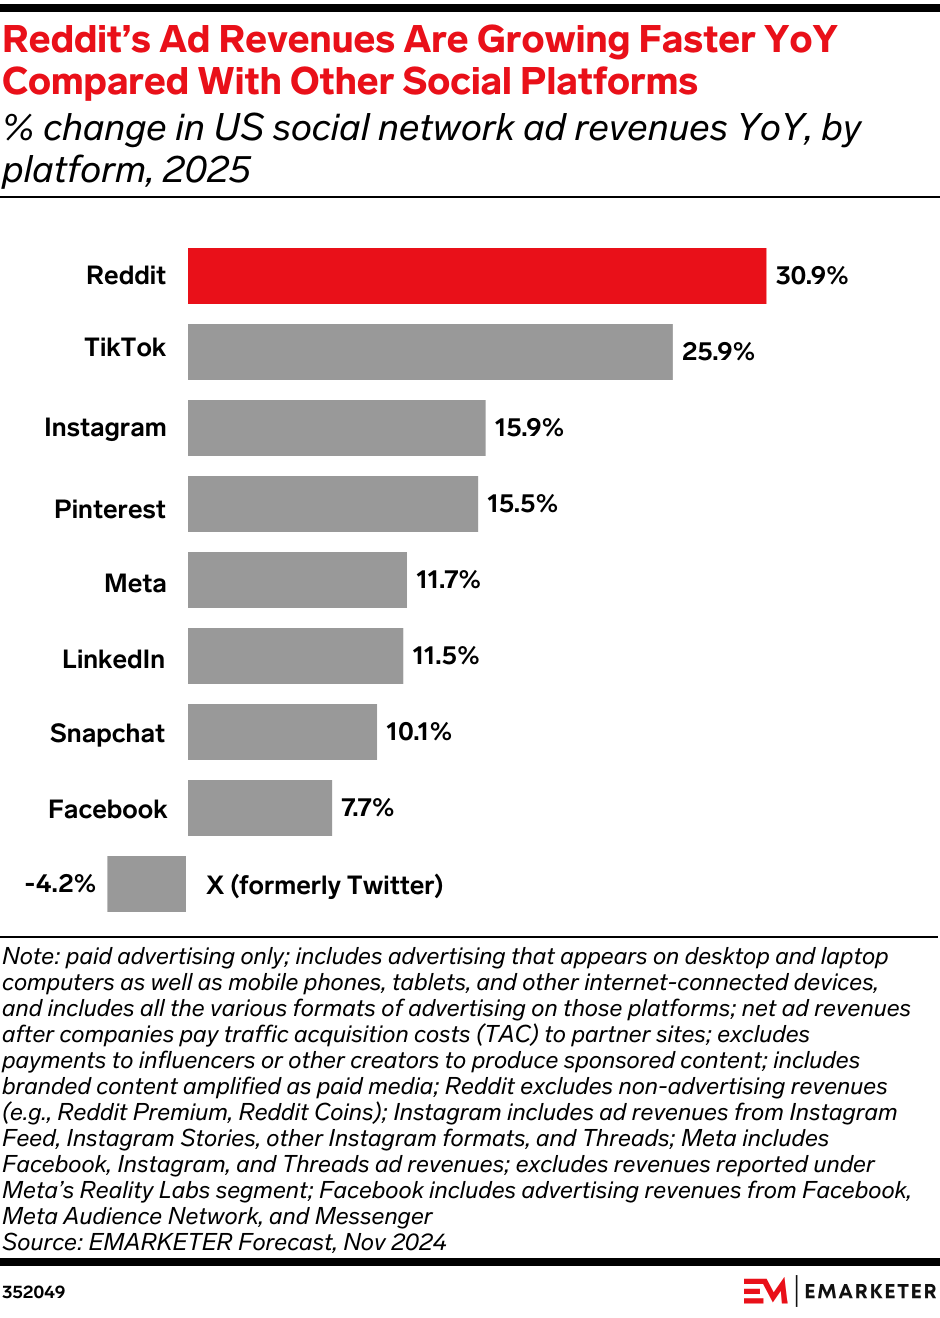
- In 2025, Reddit’s US ad revenue grew 30.9% YoY, outpacing every other major social platform.
- As of Q2 2025, most Reddit users (60%) identify as male.
- In January 2025 alone, Reddit was visited 4.4 billion times from desktop and mobile.
- Nearly 50% of Reddit’s website traffic comes from the United States.
- Reddit’s US user base skews young, with 18–29-year-olds making up 48% of its audience in the country.
- Around 18.2% of users use Reddit for research, putting it ahead of Facebook in this use case.
- Reddit users mainly want brands to show up for customer service (21%), though 14% say they don’t want brands on the platform at all.
Redditors use the platform for research and decision-making, but they’re also quick to reject anything that feels promotional.
Brands that practice Reddit social listening, add value to discussions and offer support when asked can tap into the platform’s growing influence without damaging trust.
Snapchat statistics
Snapchat continues to be a highly personal, engagement-driven platform, especially among younger audiences. It’s built around messaging, Stories and immersive formats like AR, which shape how users interact with content and brands.
Below are some interesting Snapchat statistics to guide your strategy.
- Snapchat has around 474 million daily active users worldwide.
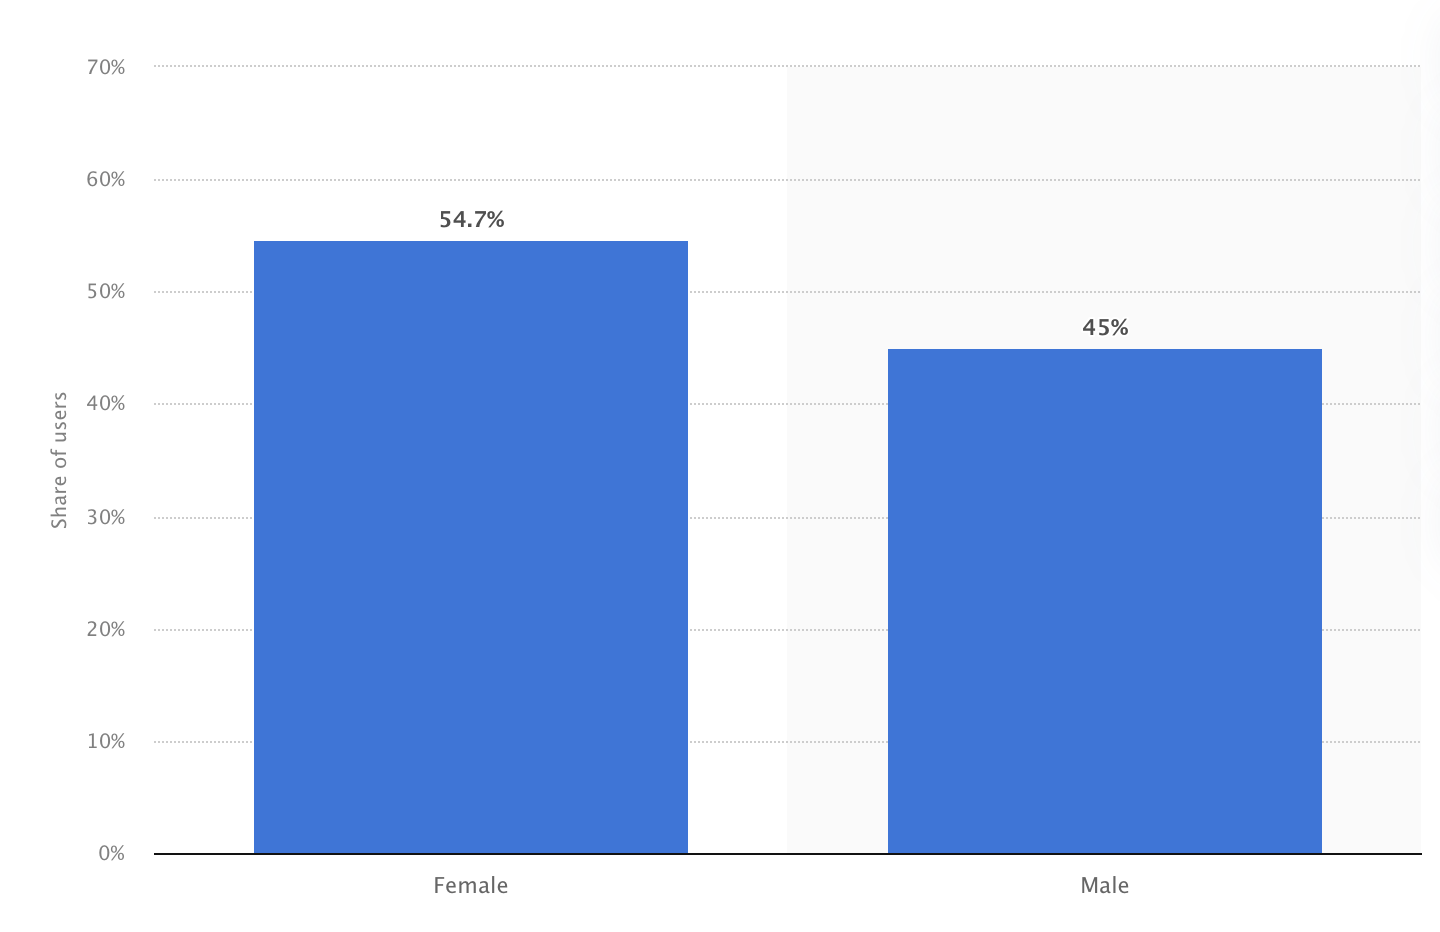
- Globally, Snapchat has a close gender balance, with 50.7% male users and 48.4% female users. In the US, however, Snapchat’s audience skews slightly female.
- Snapchat offers near-universal reach with teens and young adults, connecting with 90% of 13–24 year olds in more than 25 countries.
- More than 300 million Snapchatters interact with Augmented Reality (AR) features daily.
- Over half (59%) of Snapchat users are motivated by connecting with friends and family, which is 1.6x higher than on other platforms.
- Around 63% of users have made a purchase decision influenced by Snapchat.
- About 75% of Gen Z and Millennial users interact with brand content on Snapchat at least once a week.
- Despite growing usage among Gen Z and Millennials, only 30% of companies have built and maintained a Snapchat presence.
- Most Snapchat users turn to brands for entertaining content (29%), while others are interested in contests and giveaways (15%) or watching influencer content (12%).
Snapchat is a relationship-first platform that works best when brands stop trying to look like brands. People open the app to talk to friends and have fun, so content that feels entertaining, interactive (think AR filters) and creator-led fits in much more naturally.
And since a lot of companies still haven’t invested in Snapchat, it’s a good chance to stand out by showing up with personal, non-promotional content.
Threads statistics
Meta-owned Threads is still relatively new, but it’s growing rapidly as a text-first alternative to X (Twitter). The Threads statistics below show how the platform is shaping up and why marketers are starting to pay attention.
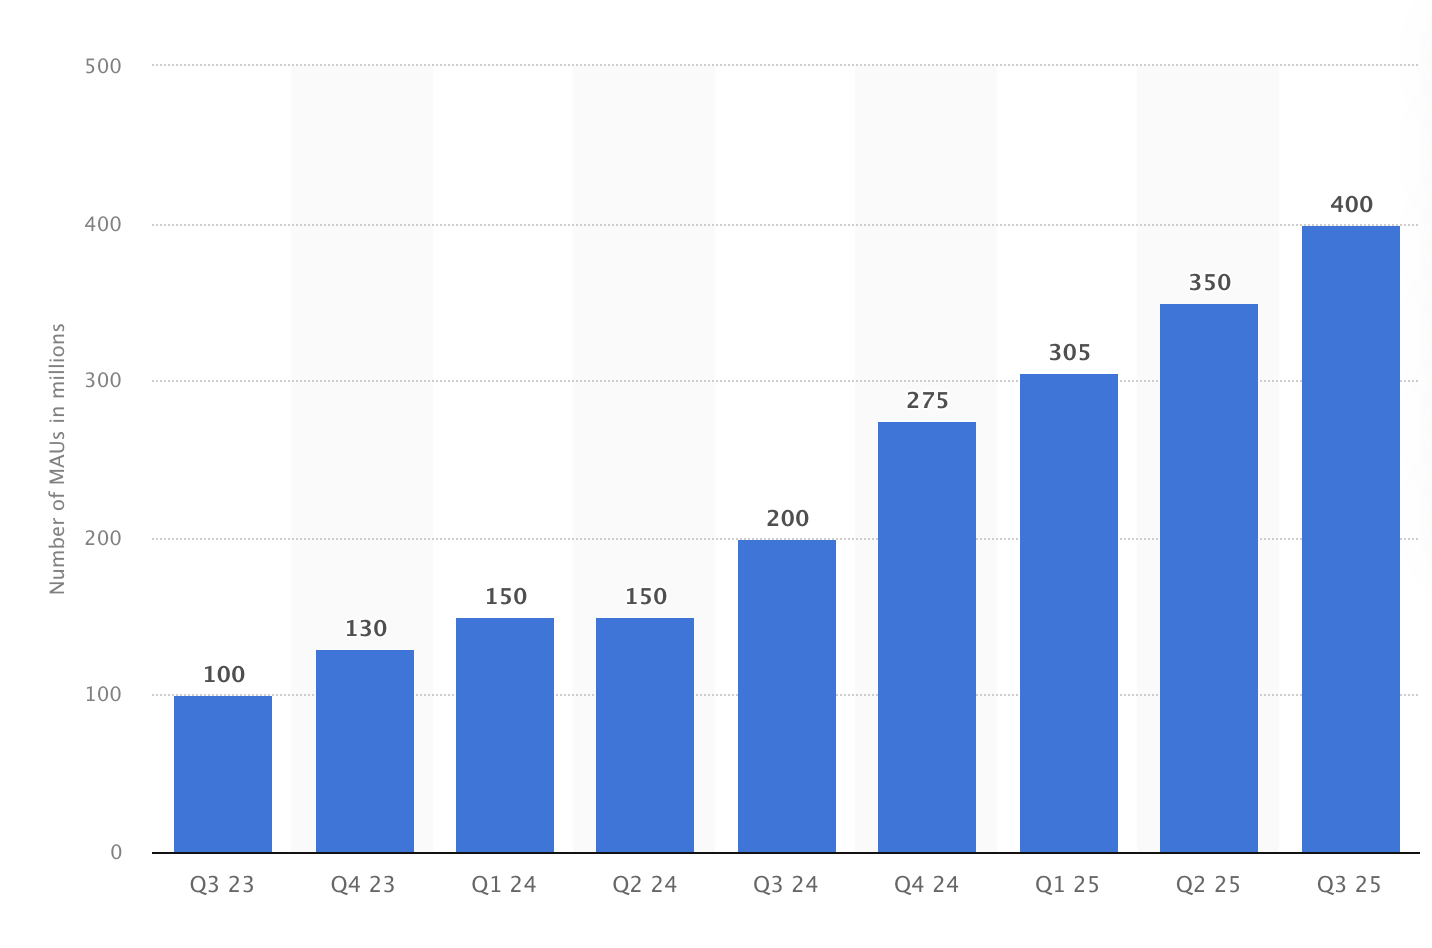
- By Q3 2025, Threads reached 400 million monthly active users, rising from 350 million in the second quarter.
- In January 2026, Threads surpassed X in mobile usage, reaching 141.5 million daily active users on iOS and Android, compared to 125 million for X.
- Most Threads users say they’re likely to engage with short-form videos and text posts from brand accounts, followed by user-generated and influencer content.
- Despite Threads’ growing user base, only 12% of marketers use the platform for marketing purposes.
- More than half of Threads users are male, while the dominating age group on the site is 25-34 year olds.
The opportunity on Instagram Threads is timing. Users are active and willing to engage with simple, conversational content, yet most brands haven’t moved in. Marketers who show up early and join conversations naturally can build presence before it gets crowded.
TikTok statistics
TikTok has grown into far more than a place for viral clips. People now use it to be entertained, discover products, search for answers, and interact with brands in real time. Even with regulatory hurdles, usage and engagement on the platform continue to climb.
Here are some useful TikTok statistics to keep in mind.
- Ads on TikTok can potentially reach 1.99 billion users each month, making it the third largest social media platform in terms of ad reach.
- Around 50% of social users have a TikTok profile, rising to 72% for Gen Z.
- Over 80% of TikTok users are looking for funny or entertaining content on the platform.
- The average TikTok user spends 1 hour and 37 minutes daily on the Android app — about 14% longer than on YouTube.

- As of October 2025, TikTok’s largest demographic is males aged 25–34.
- TikTok is the top channel for product discovery among Gen Z, with 49% of consumers turning to the platform.
- Over half (55%) of Gen Z users engage with brand content on TikTok daily — often multiple times a day.
- TikTok dominates engagement, growing 49% YoY to a 3.70% rate in 2025, the highest of all social media platforms.
TikTok isn’t just for “young people” anymore. Gen Z is getting older and still using the platform in full force, even as a search engine. The brands winning here aren’t overthinking it. They’re jumping on trends, creating content that feels real and letting creators take the lead.
If you’re already on the platform, make sure to watch your TikTok analytics and how to reach your audience.
X (formerly Twitter) statistics
Even with the ongoing controversies, X still plays a distinct role in the social media mix. It’s where people go for real-time updates around news, culture and brands.
The Twitter statistics below will help you understand more about marketing on the platform.
- There are nearly 450 million forecasted X (Twitter) users worldwide in 2026.
- About one-third of social media users have X (formerly Twitter) accounts.
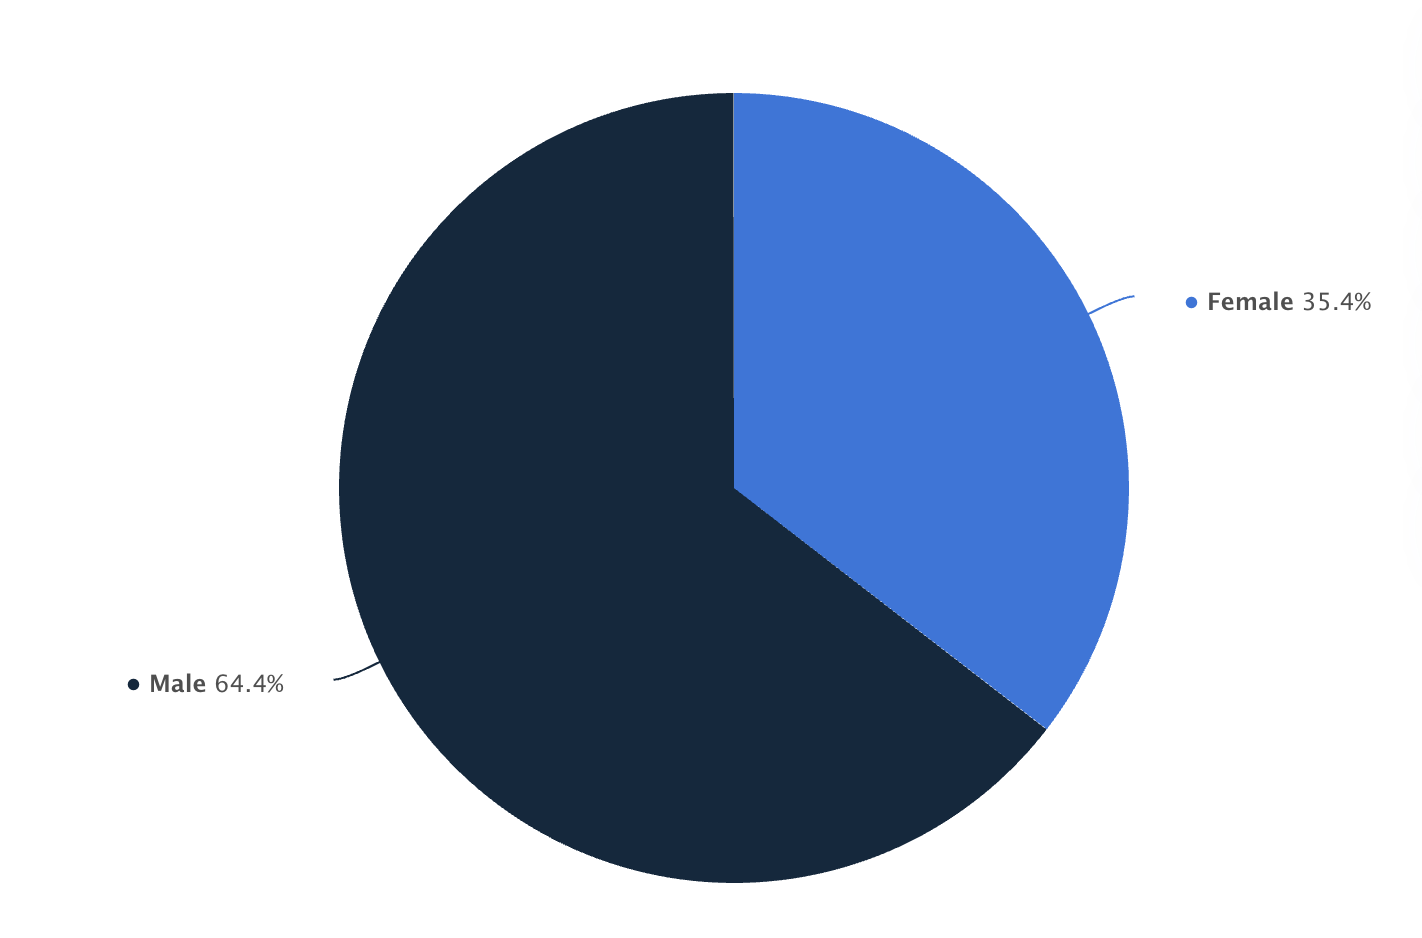
- More than half (64.4%) of X users are men (based on available gender data).
- Around 58% of X users engage with brand content weekly.
- News consumption on X is evenly divided, with nearly half of users getting information from mainstream outlets and an equal share turning to creators and influencers for their updates.
- X users now engage most with short-form video (37%), narrowly overtaking text posts (36%), showing how content preferences are changing on the platform.
While engagement rates on X have dipped slightly, users are still interacting with brand content — even if a little differently than before.
For marketers willing to show up like humans rather than broadcast and join conversations on trending topics, the platform can deliver solid visibility and impact.
YouTube statistics
YouTube continues to set the standard for video content. Its massive global reach and influence on purchase behavior make it a core platform for brands that want both attention and intent.
Here are the top YouTube statistics to know about.
- As of October 2025, YouTube has nearly 2.6 billion users worldwide.
- About 63% of all social users own a YouTube account.
- YouTube’s biggest audience is in India (500 million users), with the United States (254 million) and Indonesia (151 million) ranking next.
- Most YouTube users are males aged between 25-34.
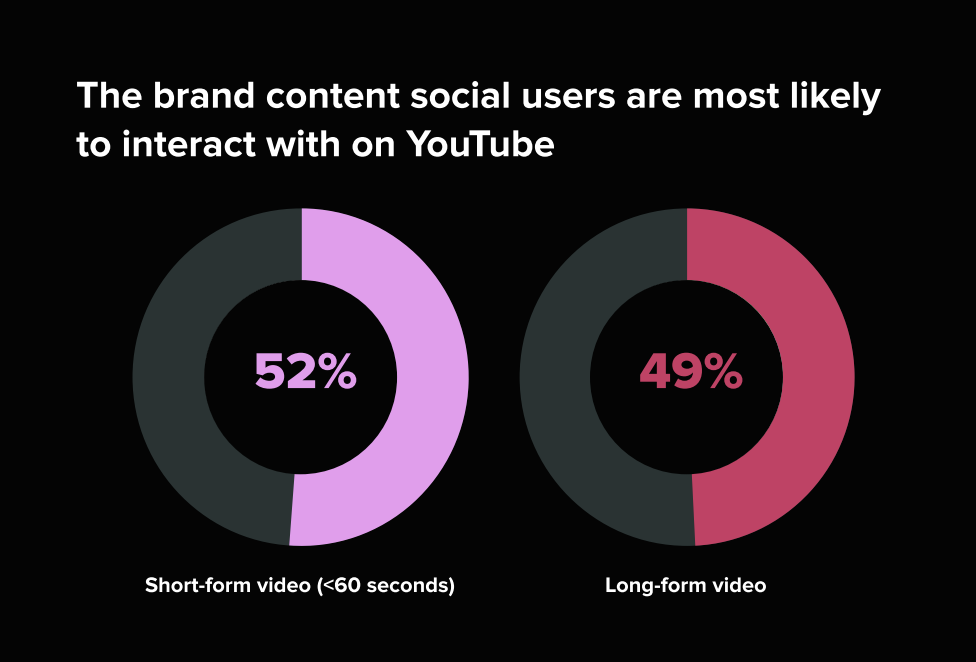
- Slightly more YouTube users now prefer to watch short-form video (<60 seconds) over long-form (>60 seconds).
- YouTube is 1.6x more likely to influence purchase decisions than other social platforms.
- US viewers find that YouTube offers the best shopping-related content, including instructional videos (91% agree), product reviews (81%) and unboxing videos (76%).
- Around 31% of users turn to YouTube for validation or gathering more information before making a purchase.
YouTube performs best when brands lean into depth. Tutorials, product walkthroughs and honest reviews should sit at the center of your YouTube marketing strategy, supported by shorter videos that drive discovery. If your content helps someone understand a product well enough to feel confident buying it, it’s doing its job.
Social media video statistics
Video continues to be an all-time favorite content type. But more than that, it shapes how people understand products, how much they trust brands and whether they decide to buy.
Below are some recent social media video statistics.
- Videos strongly influence purchases, with 85% of people saying a video convinced them to buy a product or service and 80% buying or downloading an app after watching one.
- Video quality directly shapes brand trust, with nearly 89% consumers saying it affects how credible a brand feels.
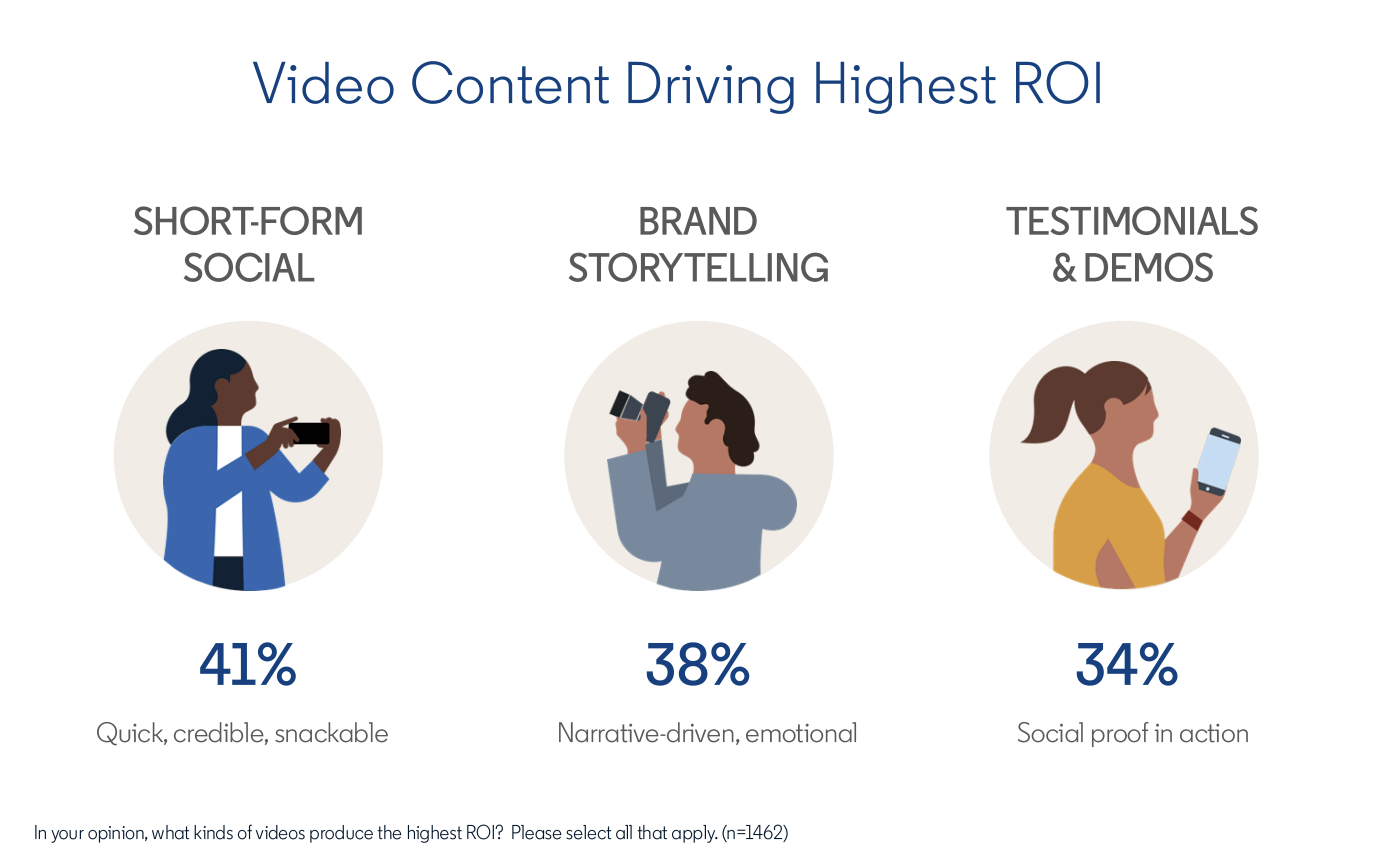
- Short-form social videos (41%) drive the highest ROI among video formats for B2B marketers, followed closely by brand storytelling (38%) and testimonials (34%).
- Most marketers (92%) plan to spend the same or more on video marketing in 2026.
- Marketers say video has helped them improve user understanding of products or services (93%), increase brand awareness (93%), generate leads (85%), increase sales (83%) and boost website traffic (82%).
- The global digital video advertising market is expected to grow from $140.28 billion in 2025 to $188.76 billion in 2026.
On social, short, snackable video formats tend to drive the strongest returns, but storytelling and testimonials still play a big role by adding context and reassurance.
As more money flows into video, the brands that win will be the ones that make it easy for viewers to understand, trust and decide quickly.
Influencer marketing statistics
Influencer marketing has moved well beyond brand awareness. Today, it plays a direct role in reach, engagement and conversions, with many consumers actively relying on creator content when deciding what to buy.
Here are some influencer marketing statistics about which platforms marketers are leveraging, what they’re hoping to achieve and how they plan to execute influencer marketing in the future.
- In 2026, 61% of marketers plan to increase their investment in creator content.
- Nearly all organizations (94%) say influencer marketing delivers stronger ROI than traditional digital advertising, with a majority reporting at least 2x returns.
- Around 90% of marketers believe sponsored influencer content outperforms brand content in terms of reach and engagement, while 83% say it converts better.

- Among influencer content formats, Instagram Reels generate the most impressions, while YouTube videos deliver the highest engagement.
- Nearly half of all consumers (49%) make purchases at least once a month because of influencer content.
- Around 93% of influencers say the quality of a brand’s existing social content affects their decision to collaborate.
- Around 46% of consumers aren’t comfortable with brands using AI influencers.
For brands, influencer marketing success comes down to fit over fame. Prioritizing human creators who align with your values, produce strong content and genuinely connect with their audience will drive better results than chasing reach alone.
The right influencer marketing tools can help scale this process, but the strategy still starts with careful platform and partner selection.
Consumer behavior statistics
Social media has become a key part of how people discover and buy products. Beyond finding inspiration, consumers are reading reviews, asking questions, seeking customer care and making purchases directly on social platforms.
The consumer behavior statistics below highlight the role of social media in shopping.
- In 2026, consumers on social media want brands to make human-generated content their #1 priority, followed by personalized customer service and social commerce.
- More than half of Gen Z (63%) and Millennials (57%) are more likely to buy from companies that speak out about specific causes or topics in the news.
- In 2025, sales through social platforms accounted for 17% of all online sales.
- Facebook (40%) and YouTube (34%) are the top social media platforms consumers use for reading reviews.
- Roughly 81% of consumers say social media compels them to make spontaneous purchases multiple times per year or more, with 28% making impulse purchases once a month.
- Around 73% of social users agree if a brand doesn’t respond on social, they’ll buy from a competitor.
Consumers expect brands to be thoughtful, responsive and human on social. Younger audiences are especially comfortable buying directly through social platforms, but expectations around trust and service cut across age groups.
Brands that prioritize social proof, authentic conversations, fast customer service and user-generated content are more likely to see success (and sales).
These elements are particularly critical when optimizing social media for retail, where the bridge between a customer seeing a product and completing a checkout is increasingly built on social trust.
Use social media statistics to guide your strategy
Social media in 2026 is more complex, fragmented and influential at the same time. Audiences move between platforms quickly, use social as a search engine and seek human interaction in increasingly AI-dominated feeds.
The brands that see success are paying close attention to how people behave on each platform and adapting their strategy accordingly. These statistics give you a benchmark, but true impact comes from tracking how your audience engages in real time.
If you want to turn these 2026 insights into action, start a free trial of Sprout Social to monitor performance and track trends across platforms.
Social Media Statistics FAQ
What is the most used social media platform?
The most-used social media platform is Facebook with over 3.070 billion monthly active users. Facebook is followed by Instagram and WhatsApp (tied at 3 billion users), and YouTube (2.5 billion users).
Is social media use increasing?
Yes. Social media use is still increasing, driven less by new users and more by deeper, more frequent usage. With 5.66 billion active users worldwide, people now spend over 2.5 hours daily on social media. Switching between nearly seven platforms each month, the average user now also relies on social for search, discovery and shopping.
Is social media marketing still effective for businesses?
Yes! There are over 5.6 billion social media users worldwide using social platforms to find products, read reviews and make buying decisions. With the right targeting and strategy, there’s a massive opportunity for brands to build trust and influence purchase behavior — often before consumers ever visit a website or search on Google.
What is the biggest social media trend for 2026?
The biggest social media trend for 2026 is how people now use social as a search and decision-making tool. More than 60% of product discovery happens on platforms like TikTok, Instagram and YouTube, and users actively look for authentic, human content over polished brand ads, especially when they’re researching and deciding what to buy.
Additional resources for Social Media Statistics

Australian social media trends: The 2026 trust-shift

Snapchat statistics, revenue and usage data for 2026

28 YouTube stats marketers should know in 2026 (Updated)

19 Threads statistics for 2026: Users, growth and engagement
29 Essential Pinterest statistics for marketers in 2026

Social media demographics Australia: 2026 age & user statistics
2026 Australian social media statistics: A strategic guide for marketers
UK social media marketing demographics 2026

Essential UK TikTok statistics brands need in 2026

38 Instagram statistics you need to know for 2026 [Updated]

Social media statistics in the UK: The 2026 guide for social intelligence

30 LinkedIn statistics that marketers must know in 2026
27 Twitter (X) stats to know in marketing in 2026

46 TikTok stats to inform your 2026 strategy
39 Facebook statistics marketers should know in 2026

80+ Social media video statistics marketers need to know in 2026

Bluesky growth: Is your brand ready for decentralized social media?

Social media demographics to inform your 2026 strategy
120+ Must-know social media marketing statistics for 2026
Australian TikTok statistics to inform your strategy in 2025
Reddit statistics in 2025 and tactics to grow your brand


Share