Facebook Analytics
Facebook Analytics: A guide to Facebook insights
To help you get more out of your Facebook marketing, this guide breaks down the key metrics, tools and insights you need to connect with your audience and boost your results. To get deeper Facebook insights your brand can act on today, try Sprout free for 30 days.
Reading time 11 minutes
Published on June 30, 2025
Table of Contents
Summary
- Facebook is a top choice for marketers due to its massive user base and extensive analytics.
- Facebook analytics helps brands understand their audience, identify top-performing content and measure impact to fine-tune their Facebook marketing strategies.
- Meta discontinued native Facebook Analytics, but brands can still track performance using tools like Meta Business Suite, Creator Studio and Sprout Social.
When it comes to social media analytics, Facebook is one of the most robust. With one of the largest user bases and detailed ad tracking tools, Meta offers marketers insights into what resonates with audiences of all ages and what falls short.
But to truly take advantage of that data, you need a solid grasp of how Facebook analytics work. We’ll break down what makes Facebook analytics so powerful, why they matter and the best tools and tips to help you measure your results.
What is Facebook analytics?
Facebook analytics includes the data and metrics brands use to track performance of their social strategy on the network. From audience behavior to content performance and overall marketing impact, these insights help you identify what’s working and where there’s room for growth.
While Meta retired its original Facebook Analytics tool in 2021, comprehensive Facebook metrics reporting is still available through Meta Business Suite, Page Insights and third-party tools. These platforms track key metrics, such as likes, comments, shares and Page views, to show how your content performs and where to optimize.
Why is Facebook analytics data important?
Facebook analytics help brands keep tabs on the competition and measure how their strategy performs.
Let’s dig into why this matters.
1. Analyze your competitors
Your Facebook Page analytics, located in Meta Business Suite, offer a wealth of information, including competitor performance. A social media competitive analysis shows what’s working for others (and what’s not), giving you valuable context into the market and your strategy.
Track benchmarks like posting frequency, engagement rates, follower growth and cross-platform presence. Learn from their wins, gaps and missteps to create content that connects more deeply with your target audience.
2. Monitor your performance
Posting content is just the beginning. To optimize your marketing plan, you need to track and measure your results. Facebook analytics lets you monitor both your Page and individual post performance across organic and paid content.
Keep an eye on metrics like reach, engagement and clicks. These numbers reveal what content your audience connects with, helping double down on what works and level up the rest.
3. Gather audience insights
Facebook analytics are like a window into audience behavior (e.g., what they enjoy, when they’re online or how they engage with your content). Use this data to shape content and campaigns that reflect your audience’s preferences.
For example, if video posts consistently outperform static images or engagement spikes on weekends, those trends highlight what’s worth prioritizing. With insights like these, content decisions become more strategic.
4. Facilitate strategic decision-making
Analyzing metrics tied to your Facebook KPIs will help you understand the effectiveness of your marketing efforts. The data highlights what content topics and formats your audience likes, making it easier to refine your Facebook marketing strategy and maximize your return on investment (ROI). These insights can help inform bigger picture efforts, like audience preferences about your brand, including the products or services they most like (or don’t like).
Essential Facebook analytics KPIs to track
There are a ton of metrics to consider, but here’s a brief breakdown of the Facebook analytics metrics that matter most.
Facebook Page metrics
- Reach: How many unique viewers saw your Page, including both organic and paid reach.
- Impressions: How many times your Page showed up in someone’s timeline.
- Engagement: The number of actions taken on your Facebook Page. It includes interactions with posts and other types of content on your Page, like reactions, link clicks, shares, comments, profile clicks and more.
- Likes: The total number of “likes” for your Page. It includes likes that happened directly on your Page or from a button on an ad. You can also view likes for specific posts.
- Follower metrics: Includes the total number of followers for your Facebook Page or profile, your follower growth rate (how quickly your Page is gaining or losing followers) and demographics (data on followers’ language, age, gender and location).
Facebook post Insights
- Post Reach: The number of unique people who saw your post via paid or organic.
- Post Impressions: How many times a post shows up in someone’s timeline.
- Post Engagement: Includes basic metrics like post reactions, comments, shares and saves.
- Link clicks: The total number of clicks on links within the post.
Track basic metrics like post reach and post engagement from the Insights section of your professional dashboard. Access the Insights tab and your professional dashboard by navigating to the Manage Page menu.
Note: the professional dashboard and Insights tab is separate from the Meta Business Suite.

Meta Business Suite provides additional reach and engagement metrics like median post reach by media type and content format or top-performing organic posts by highest reach, reactions and comments.
Video analytics
Video analytics reveal how users interact with your video content and how your video strategies are performing.
- Views: The number of times your video starts to play. Video plays can happen when a video starts automatically or when someone clicks on it.
- Watch time: How long viewers spent watching your video in total, including replays.
- Average watch time: How long, on average, each viewer watched your Reel. It’s calculated by dividing total watch time by the number of initial views.
- Video percentage watched: The average percentage of your video that people played.
- Reels reach: The total number of people who saw your video at least once.
- Reels engagement: Includes shares, comments and reactions.
- Live video metrics: Tracks key metrics like video views (plays over three seconds), unique viewers (individuals who watched for more than three seconds) and average watch time (total watch time divided by unique viewers).
Facebook pixel analytics
Add a Meta pixel, formerly known as a Facebook pixel, to your website to track metrics like conversions, page views and cost per conversion.
Facebook ads analytics
Facebook ads analytics focus on your paid marketing efforts. Some common metrics include:
- Cost per result: The average of how much it costs to get your ad result. For example, if you spend $100 on a Facebook ad campaign and earn 50 clicks, the cost per result would be $2.
- Link clicks: The total number of clicks on links within the ad that led to specified destinations like a website.
- Reach: How many unique viewers saw your ad.
Competitive analytics
Competitive analytics provide insight into how your industry peers perform while identifying opportunities to get ahead of your competitors. You will need to use social media management software, like Sprout, to pull metrics like reach, followers and engagement for your top competitors, as they’re not available in the Meta Business Suite.
Sentiment analysis
Sentiment analysis takes some of the guesswork out of reporting by showing how customers truly feel about your offer, competitors and industry. Most analytics platforms, including Sprout, offer a metric, such as a sentiment score, that tracks the ratio of positive to negative messages your brand receives.
Hashtag analytics
Hashtags on Facebook remain relevant for businesses on the network, but you need to monitor your hashtag analytics to determine if you’re using the right ones. These analytics will help you track which hashtags are most popular in your industry, branded hashtags and more.
3 Facebook analytics tools to generate business insights
Meta may have sunset its Facebook Analytics feature, but there are plenty of powerful tools available to help you track and make sense of your Facebook data.
Here are some of the best Facebook analytics tools worth exploring:
Sprout Social

Sprout Social is a social media management software that integrates with Facebook, Instagram and other major networks. It goes beyond basic analytics with custom reporting and AI Assist capabilities that can generate report summaries, captions, alt text and video subtitles.
Combine that with capabilities like social listening, competitor analysis, cross-platform scheduling and a unified Smart Inbox, Sprout enables your team to be more data-driven and efficient in their social media marketing. Try it free for 30 days to see for yourself.
Key features:
- AI Assist for content creation
- Analyze by AI Assist for data summaries
- My Reports for custom reporting
- Smart Inbox for unified messaging
- Competitor analysis
- Cross-network content scheduling
- Social listening
- Social engagement measurement
- Chatbot automation
- Trending topic identification
- Built-in approval workflows for compliance and collaboration
- Customer care solutions like Case Management
Meta Business Suite
Meta Business Suite is a free tool that enables you to manage Facebook and Instagram profiles and ad accounts from a single dashboard. It offers access to key business activities including Facebook Page analytics, content insights, ads and goal tracking. Facebook Business Manager is now part of Meta Business Suite. Business Manager accounts are now known as a business portfolio.

Key features:
- Ads management and retargeting
- Inbox automation
- Post scheduling
- Analytics reporting
- User roles and permissions
Creator Studio
Creator Studio is another free tool for managing Facebook and Instagram accounts within Meta Business Suite. With Creator Studio, marketers can schedule content, manage messages, track monetization and measure performance across accounts. The dashboard allows teams to monitor content performance, profile growth and insights in one place.
Key features:
- Calendar planner
- Content scheduler
- Monetization plans
- Ads monitoring
- Insights
How to use native Facebook analytics
Access Facebook analytics through the Insights section in your Page’s professional dashboard or directly within Meta Business Suite. While the dashboard and Suite are separate tools, they’re connected. Meta Business Suite is accessible from the dashboard for easy navigation.
Keep in mind that some metrics are exclusive to each tool. In the following sections, we’ll walk through how to find the key metrics in both.
How to use Facebook Page analytics
Access native Facebook Business Page insights by following these steps:
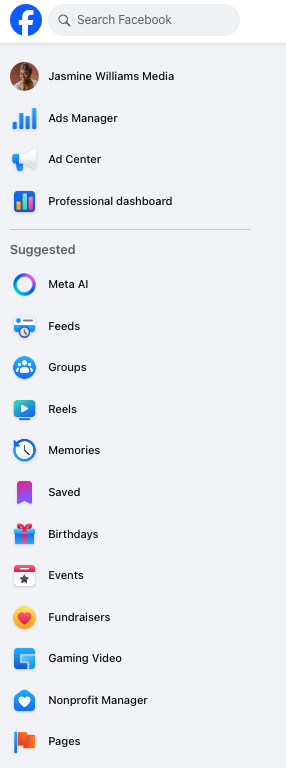
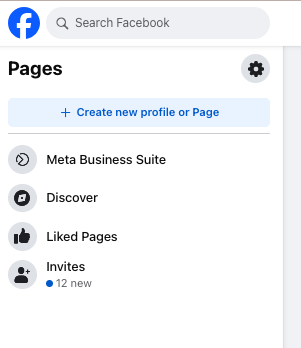
1. Log into your account. If you’re using a desktop, select Pages from the left-hand navigation menu.
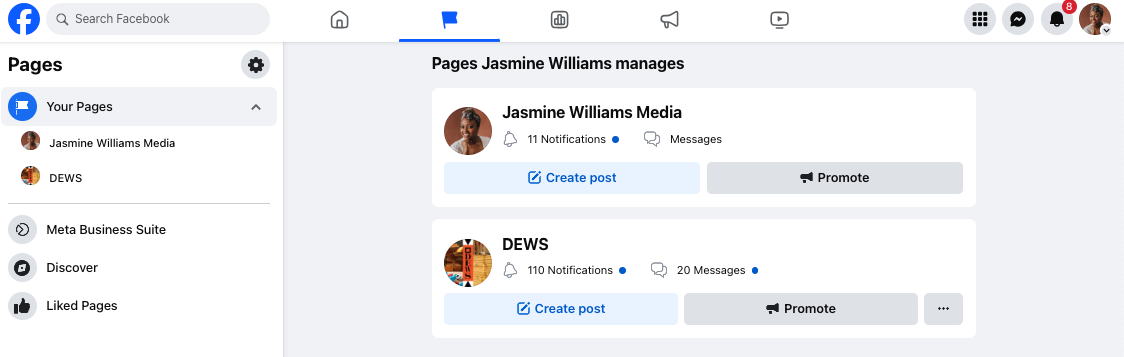
2. Select the Page you wish to measure analytics.
3. From here, navigate to the professional dashboard or directly to the Insights tab. Tap Professional dashboard.
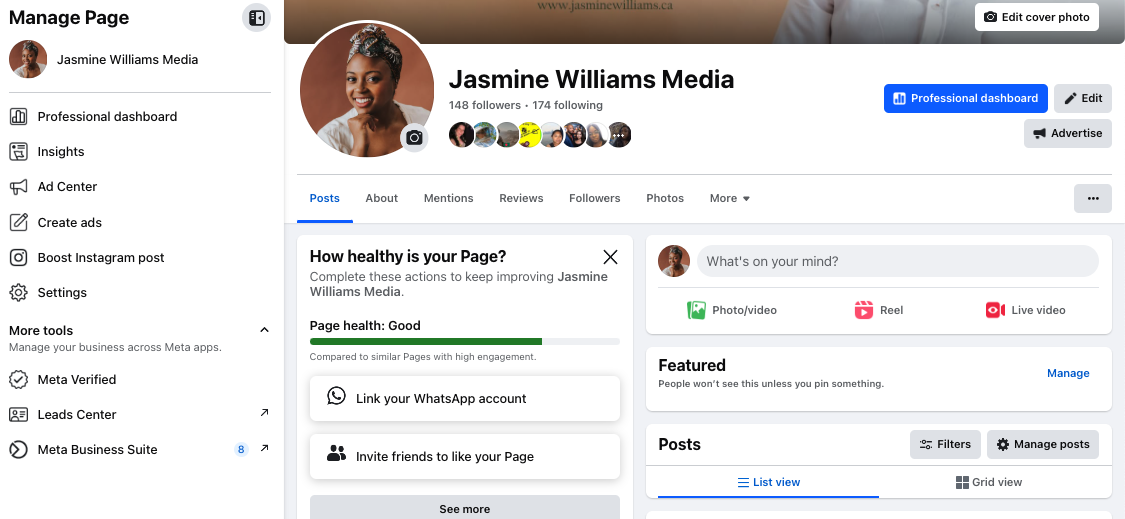
4. The professional dashboard gives an overview of your Page performance. To go a bit deeper, click Home, Your Page, Content or Audience underneath the Insights tab on the left-hand menu.
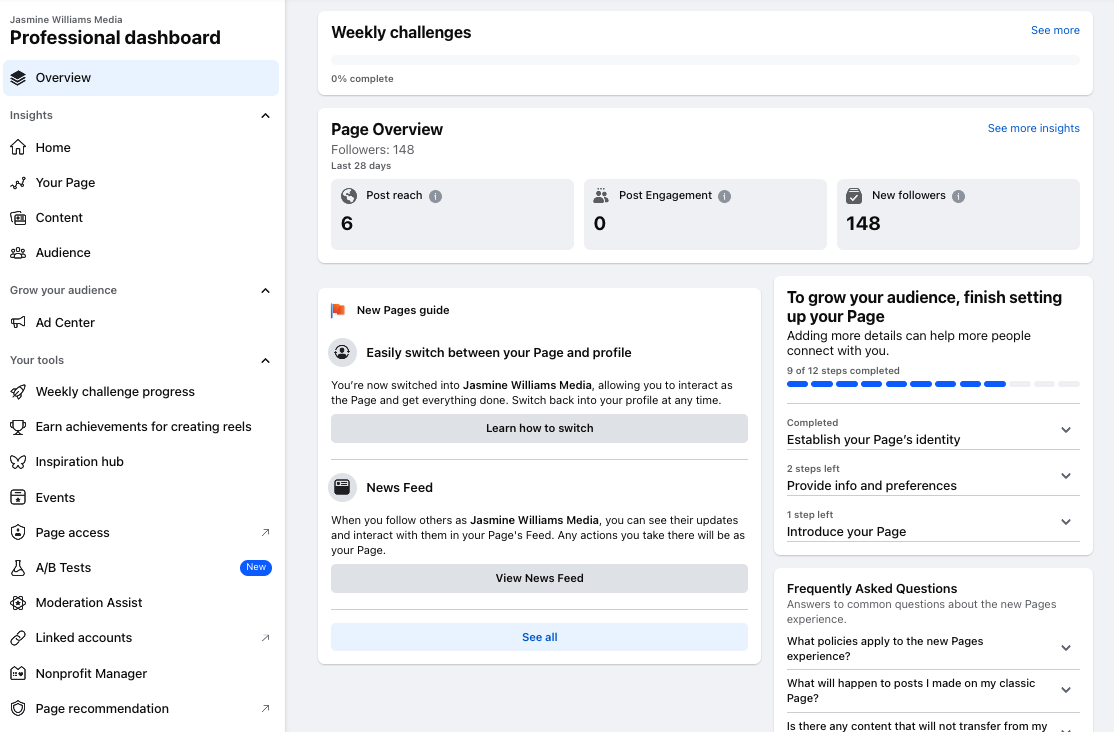
Pay attention to the left-hand menu of the professional dashboard. It’s your gateway to deeper analytics and tools, like:
- Page overview: Shows followers, post reach, post engagement, new Page likes, recent content and messages from the past 28 days.
- Actions on page: Review interactions (reactions, comments, shares, photo views and link clicks)
- Events: View events from the last 90 days, people reached, actions and responses.
- Videos: See how well your videos are performing.
- Follower insights: Under the Audience tab in your professional dashboard, you’ll find demographic data, including age, gender, and location of your followers.
How to access Meta Business Suite
Follow these steps to access Meta Business Suite:
1. Log into your account. If you’re using a desktop, select Pages from the left-hand navigation menu.
2. Select Meta Business Suite.
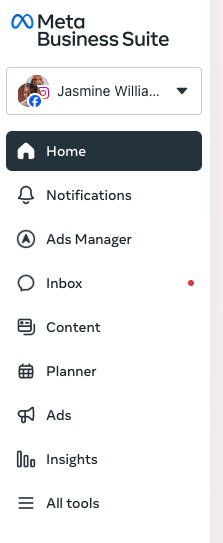
There are various dashboards inside Meta Business Suite, like:
- Home: an overview of recent activity across your Meta accounts, with high-level content performance stats and notifications
- Inbox: a unified messaging hub for Facebook Messenger, Instagram DMs and comments, with automation features like saved replies and inbox labels.
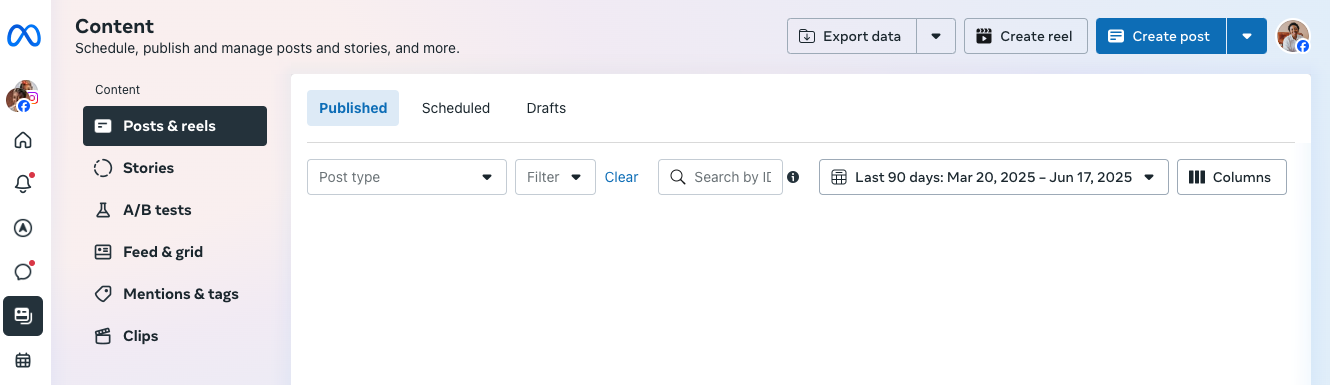
- Content: a calendar view and feed of all posts (published, scheduled and draft). Contains performance metrics like reach, engagement and post type breakdown
- Insights: a more in-depth analytics dashboard, covering overall metrics like views, reach, interactions and follows, post-specific performance and follower demographics and trends.
Before diving into Facebook data, start by locking in your core metrics. Knowing which KPIs matter most makes it easier to spot patterns and see what’s really driving results.
How to use Facebook analytics in Sprout Social
Here’s how to connect your Facebook profiles to Sprout Social:
1. Start a free 30-day trial by setting up an account with your business email (you don’t even need a credit card).
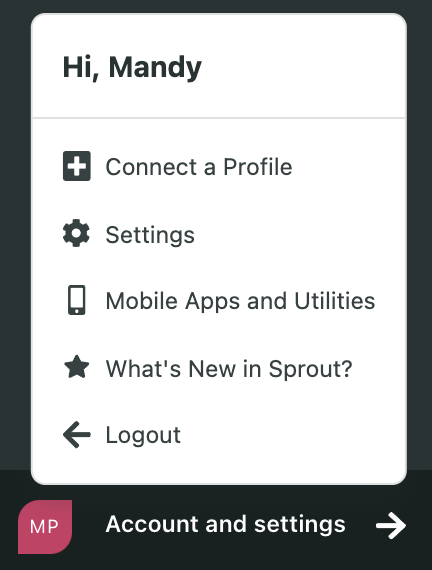
2. Go to Account and Settings and click on Connect a Profile.
3. If needed, select a group for this Page from the In Group dropdown.
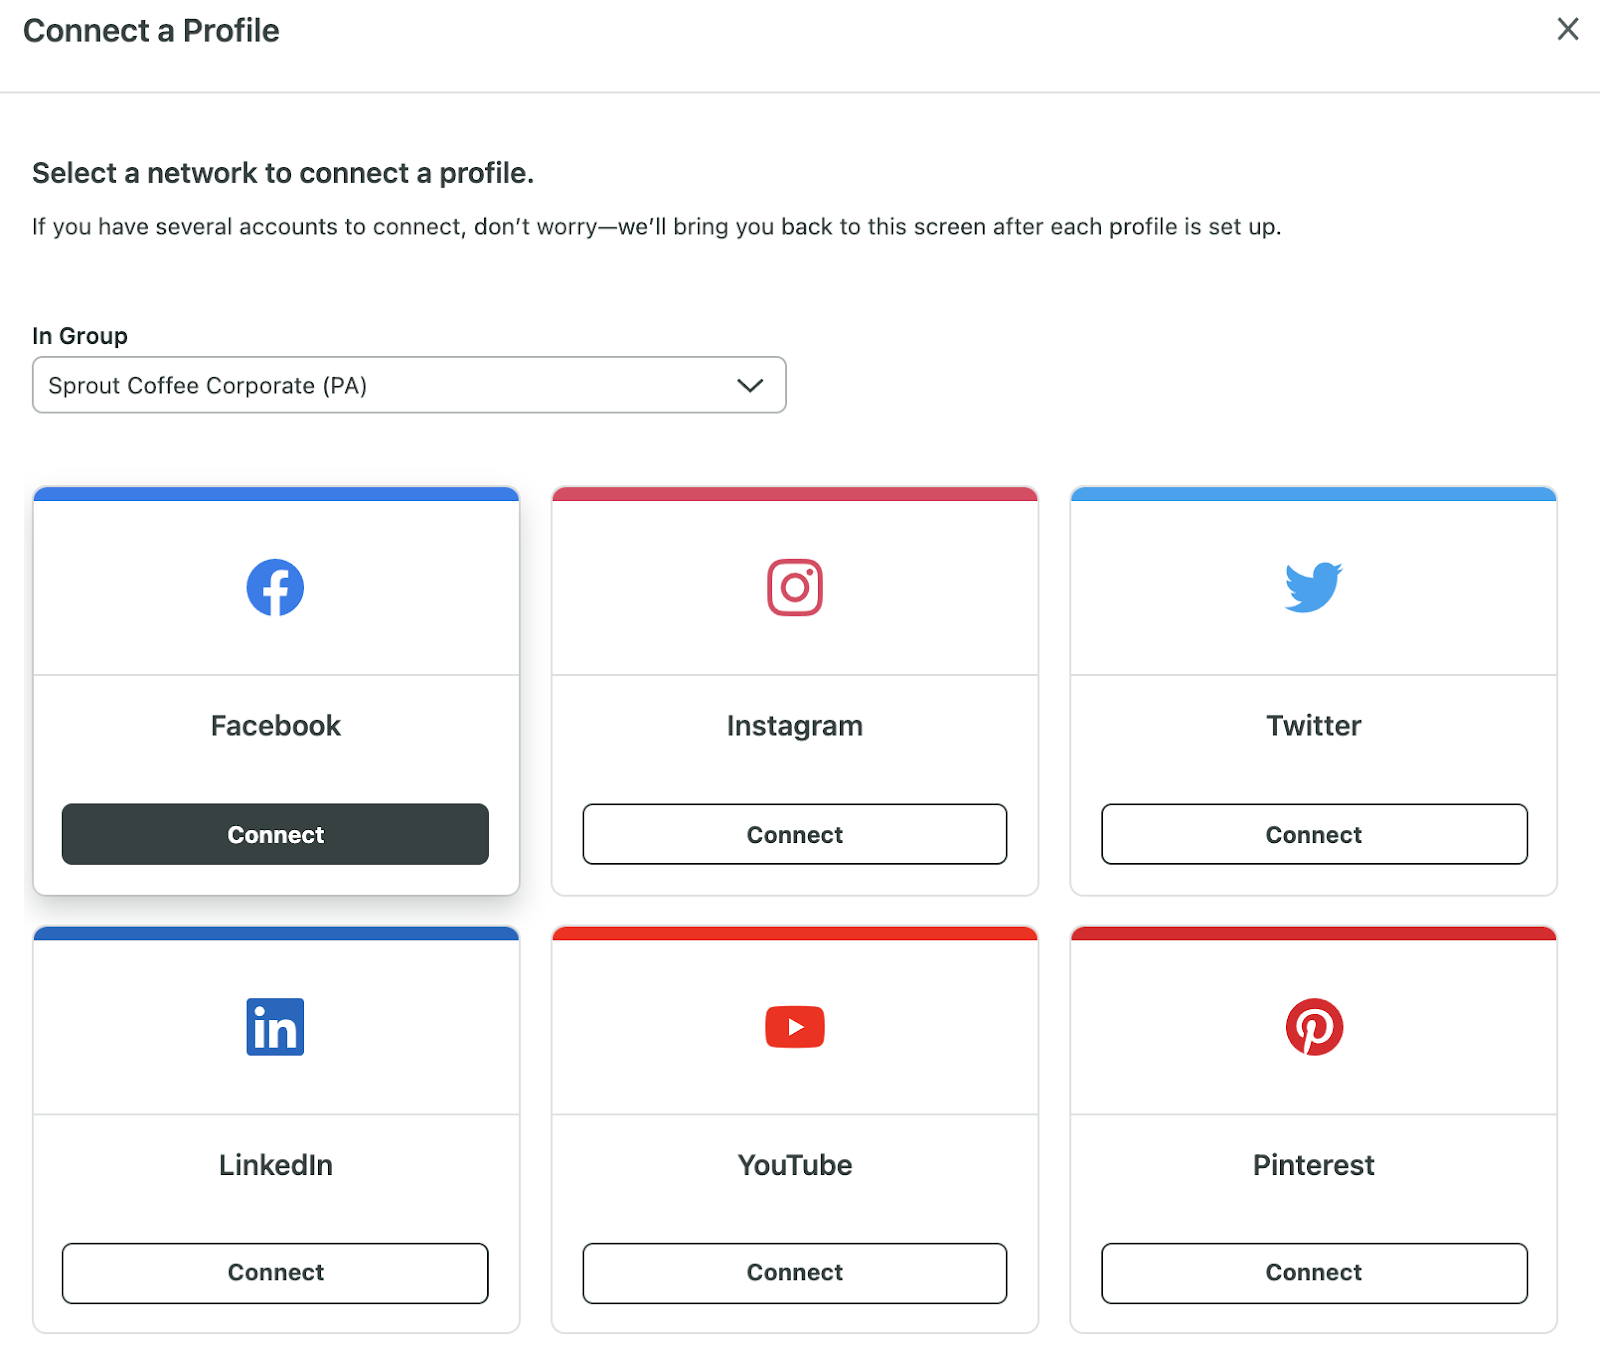
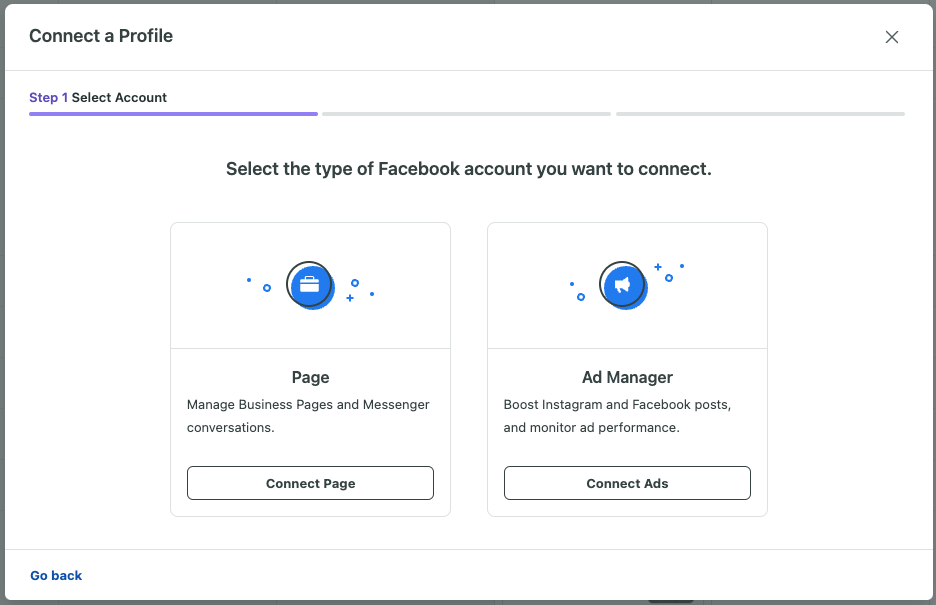
4. Click Connect for Facebook. Next, click Connect Page to link your Facebook Page.
5. Click Go to Facebook and follow the simple instructions to authorize the connection.
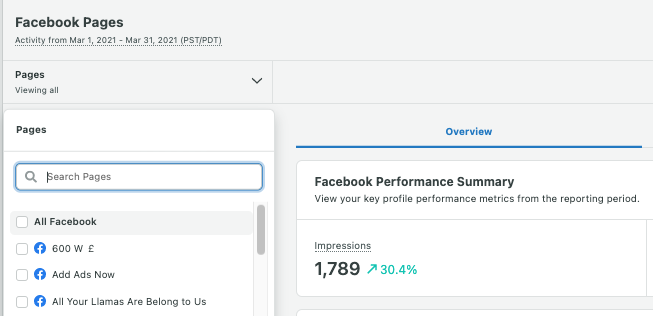
6. Then navigate to Reports > Profiles by Network > Facebook Pages.
Note: Facebook Page demographics are delayed 48-72 hours and only appear if there is data for 100 or more people.
7. Customize your view to focus on the specific Facebook Profiles you want to analyze. This approach allows you to hone in on individual page performance and compare strategies across different profiles.
Facebook analytics reports in Sprout
Understanding your Facebook performance is key to a successful social media strategy. Fortunately, Sprout Social’s automated reporting tools pull data into a centralized dashboard. They turn key metrics into clear, visual reports, ready to export and share with teams or stakeholders.
Here’s an overview of Sprout’s Facebook analytics reporting capabilities:
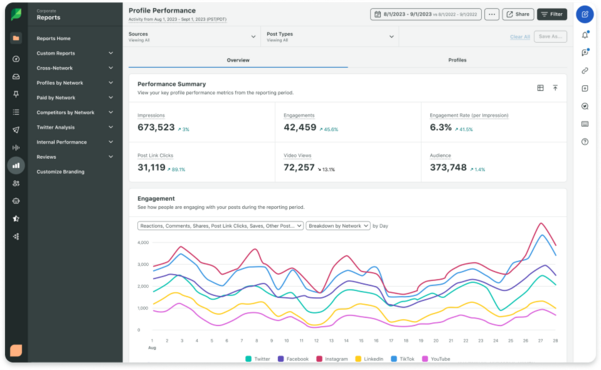
Profile Performance provides a high-level overview of your key performance indicators (KPIs), like:
- Impressions: See how often your content was displayed.
- Engagements: Track how users interact with your posts.
- Post Link Clicks: Measure how effectively you’re driving traffic to your website. Heads up: This metric tracks clicks on links within your posts, not other interactions.
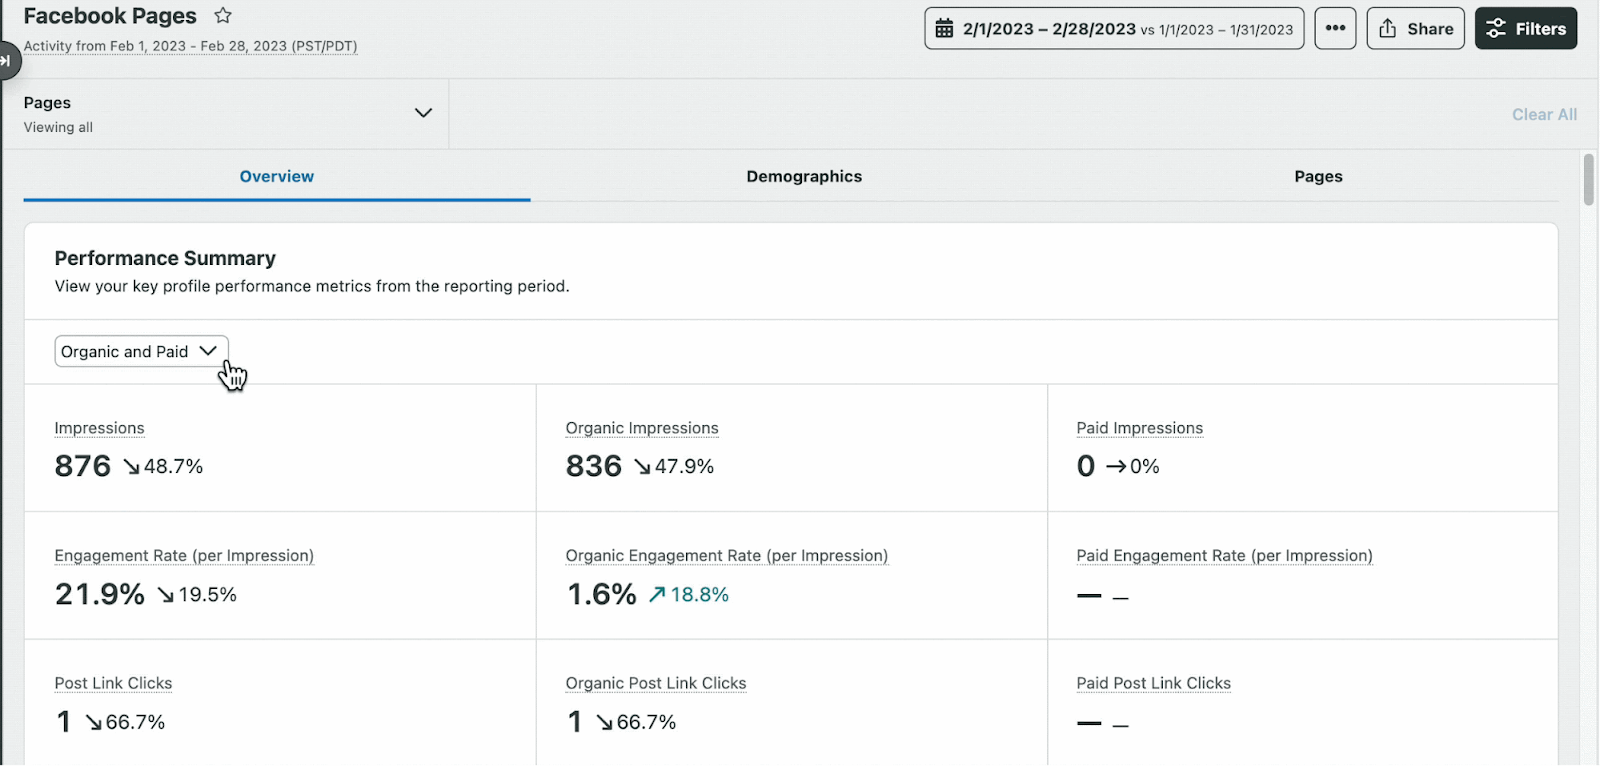
The Facebook Pages report will help you see track metrics like:
- Fans: Track your total page likes (helps monitor overall growth trends).
- Net Page Likes: See the true growth of your audience by factoring in both likes and unlikes.
- Organic vs. Paid Page Likes: Dissect the source of your new fans. Are your organic efforts paying off, or are paid campaigns driving the growth?
- Page Unlikes: A spike in unlikes can signal a content or strategy misstep. Investigate what might be turning your audience away.
The Post Performance report enables you to analyze your content mix and understand what types of posts are performing best.
- Photos, Videos, & Posts: See the breakdown of your published content. Are you striking the right balance? Experiment to see what resonates best with your audience.
- Total Posts: Track your posting frequency. Consistency is key, but quality trumps quantity.

The Facebook Competitors Report tracks any Facebook Page and shows how their presence stacks up against yours.
- Performance metrics like Fans Average (number of users who like the page), Public Engagements Average (how many times users engaged wih your posts) and Public Engagements per Post.
- Audience Growth: See how your audience grew compared to your competitors.
- Sentiment Analysis: Understand how social media users feel about your brand compared to your competitors.

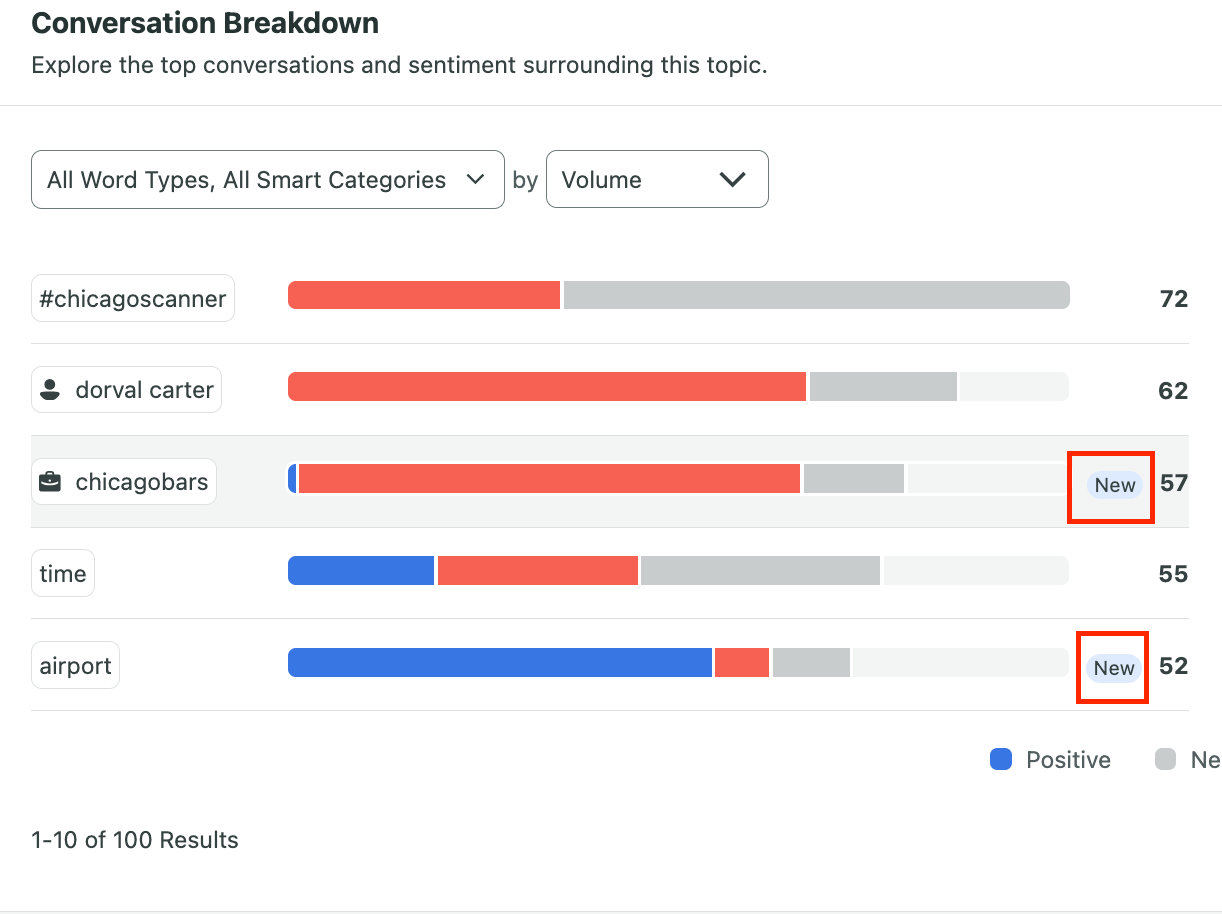
The Social Listening report is great for hashtag analytics and tracking.
- Use the Conversation Breakdown widget to see the volume of sentiment of certain hashtags, keywords and phrases.
Best practices for Facebook analysis
Facebook analytics offer a goldmine of insights, but only if you use them strategically. These best practices will help you turn its raw data into smarter decisions and tangible business results.
Identify KPIs
Determine the key performance indicators (KPIs) that best illustrate your work’s impact. Different metrics tell different stories. Likes, shares and comments measure brand awareness and engagement. Clicks and conversions show how content drives business results. Track the metrics that match your goals, whether it’s growing your audience or proving Facebook ROI.
Gather historical data for predictive analytics
Reviewing and analyzing historical data helps forecast future results and spot shifts in audience behavior before they happen. For example, knowing that there are seasonal trends in your engagement or that certain content types consistently outperform others can help you be more strategic with your content creation and scheduling.
Compare cross-network performance
How does your Facebook content stack up against your posts on Instagram, LinkedIn or X? Cross-network analysis helps you zoom out and see the bigger picture. Spot which tactics perform consistently across channels and which ones you should tailor for specific platforms.
Share Facebook analytics reports across departments
Facebook data isn’t just for the social team. Use reports as a starting point for collaboration with other departments like other marketing teams, sales, product and customer care. Social insights can help teams refine their messaging, improve the customer journey and even spot early product feedback.
Improve performance with insights from Facebook analytics
Behind every click, like and share is data that tells a bigger story. Facebook analytics helps bring that story to life. Use the data you gather to optimize your campaigns, tighten your positioning and discover new ways to boost visibility and drive revenue.
Ready to go beyond surface-level stats? Dive in today with a free Sprout Social trial.
Facebook analytics FAQs
How do I see my Facebook analytics?
Head to the Insights tab in your Facebook Page’s professional dashboard or open Meta Business Suite. For a more advanced view, use a social media management tool like Sprout Social.
What does Facebook analytics show?
Facebook analytics show a wide range of metrics including but not limited to reach, engagement and views.
What is Facebook Analytics called now?
Meta sunset Facebook Analytics. Insights are now available through the professional dashboard and Meta Business Suite. Just log into your account > choose Meta Business Suite or Professional dashboard from the left menu to view Insights metrics.
Additional resources for Facebook Analytics
Facebook Analytics: A guide to Facebook insights
16 Facebook metrics every brand needs to track for success

How to use Facebook audience insights for more effective targeting

Facebook reach: What it is and how to increase yours quickly

11 Facebook analytics tools to measure your marketing success in 2025

13 Strategies to increase Facebook engagement

How the Facebook algorithm works and ways your brand can outsmart it
Facebook pixel: A complete guide for digital marketers

12 Facebook video metrics brands need to benchmark right now
How to create Facebook reports with Sprout Social
Share