How to create Facebook reports with Sprout Social

Written by Dominique Jackson
Published on December 10, 2020
Reading time 8 minutes
Reporting and analytics are key to any social strategy. Whether it’s reviewing content relevancy, looking at your share of voice or tracking your audience engagement, data helps your brand make smarter decisions on social. Of all the social networks, Facebook arguably gives you the most amount of data to work with. And sometimes sorting through all those reports, particularly if you have multiple profiles, can be overwhelming. Let Sprout help!
Our Facebook reports contain a wealth of analytics to help you shape your social media presence. Specifically, we’re going to focus on three main Facebook reports you can access in Sprout to get insights into how your brand is performing, as well as how to build your own custom report:
Want to follow along with this guide?
Sign up for a free trial and dig into your brand’s own Facebook reports.
How to Create a Facebook Pages Report
To see an overview of everything going on with your Facebook Page, run the Facebook Pages report. This report shows:
- The number of paid and organic likes for your Page over a specific period of time.
- Your top performing Facebook posts, and how your content has been shared including reach, likes, comments and so on.
- A glimpse at how your content is traveling across Facebook by looking at how information is shared. This includes the number of stories (comments, mentions, posts, etc.) created and the number of users posting your content.
- Audience demographics, such as the age, gender and location of your fans. You’ll also see which demographic engages with your content the most.
Keep in mind, this report can only be run for Facebook Pages with 30 or more fans or followers.
How to see this report:
- Go to the Reports tab
- Click Facebook Pages under Facebook Reports
- Select the appropriate date range and Page
- View it directly in Sprout or export to a PDF or Excel—whatever is most useful for you
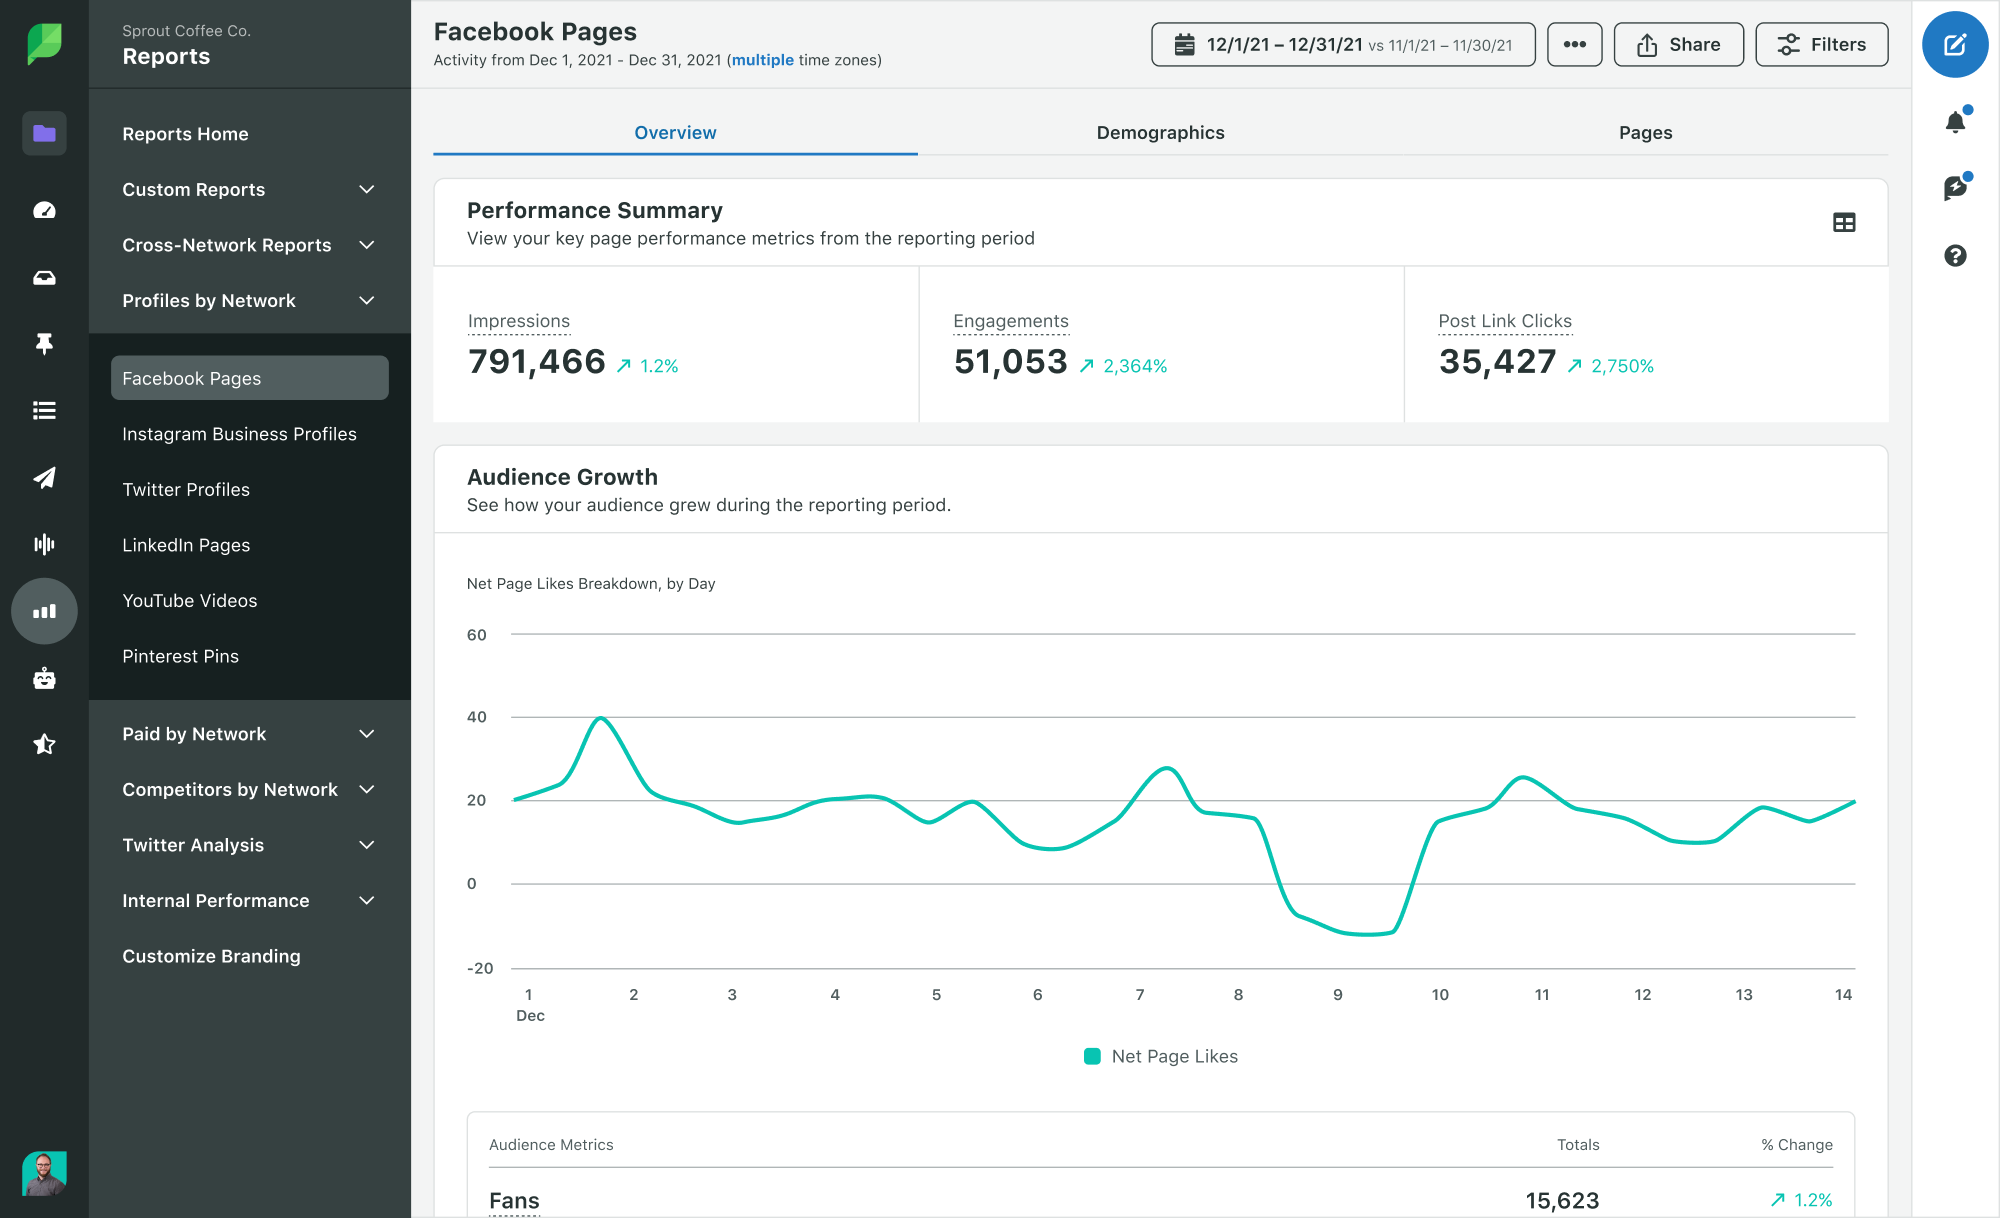
Understanding the Facebook Pages Report
Your Facebook Pages Report has a number of metric graphs and data for the dates you’ve selected.
Facebook Performance Summary
What this section shows you: A general overview of of impressions, engagement and post link clicks for your page during your selected period of time.
Why it’s important: It gives you a high level view of your page performance. This is great for a quick view of your page’s engagement during a specific month, quarter or any other length of time.
Facebook Audience Growth
What this section shows you: How many paid and organic likes your page has received over a selected period of time.
Why it’s important: It’s crucial to know whether or not your audience is growing or shrinking. The Net Page Likes metric is where you’ll really want to focus. Getting 100 new followers isn’t as valuable if you had 50 unlikes over the same period of time. When your number of unlikes outpaces your new likes, it’s a sign your fans aren’t engaged. Follow these tips to improve Facebook engagement and keep your followers around.
Facebook Publishing Behavior
What this section shows you: How many times you publish per day on Facebook, as well as the type of content you share.
Why it’s important: With the Facebook algorithm slashing organic reach for brands, you constantly have to test different publishing cadences to get as much exposure as possible. With this report, you can see how often you currently publish each day. To get the most from this data, compare it against your impressions and engagement data to see if there’s a correlation between publishing behavior and engagement.
Facebook Top Posts
What this section shows you: Your top three performing Facebook posts.
Why it’s important: Once you know your most engaging posts, you can analyze why they worked. It could be the copy, your image or maybe the time you posted. Find why the content resonated then try to replicate it with future posts.
Facebook Impressions
What this section shows you: The number of impressions your content has received on Facebook as well as the users reached. The users reached metric includes the number of users that saw any content associated with your Page via the News Feed, ticker or visits to your Page.
Impressions are broken down into two sections:
- Paid impressions: The number of impressions of Sponsored Stories or Ads pointing to your page.
- Organic impressions: The number of times any organic content associated with your Page was seen in News Feed, ticker or on visits to your Page.
Why it’s important: If you dedicate time and resources into creating and sharing content on Facebook, you probably want to get it in front of as many people as possible. This report helps you visualize how many people you’re reaching. If you see negative trends, look into what the potential problem could be. If you see a sudden spike, check the content you shared that day to understand what went well.
Facebook Video Performance
What this section shows you: How well your video content performs on Facebook. You can see how many people watch your full videos, paid vs. organic views and more. Note, this is only available if your brand publishes videos.
Why it’s important: Facebook video is more prevalent than ever. In fact, 45% of people watch more than an hour of Facebook or YouTube videos a week. So needless to say, it’s well worth it to invest in Facebook videos. But just sharing a video doesn’t guarantee success. You need to measure how your videos actually perform so you can optimize your strategy for success.
Facebook Engagement
What this section shows you: How much engagement your Facebook posts receive each day broken down by reactions, comments and shares.
Why it’s important: Engagement is one of the most important metrics for your Facebook efforts and a key factor in Facebook’s ranking algorithm. If you want your posts to get more organic visibility, you need people to engage with your posts. Similar to what we mentioned about impressions, look for dips or spikes in your engagement. Then you can look deeper into what happened on those specific days.
How to Create a Post Performance Report for Facebook
While the Facebook Pages report helps you understand overall Page performance, the Post Performance report helps you understand the performance of individual Facebook posts.
How to see this report:
- Go to the Reports tab.
- Click Post Performance under the Cross-Network Reports dropdown.
- Make sure Facebook is selected in the right bar.
- Select the appropriate date range & profiles.
- View the report directly in Sprout or export to a PDF or Excel—whatever is most useful for you.
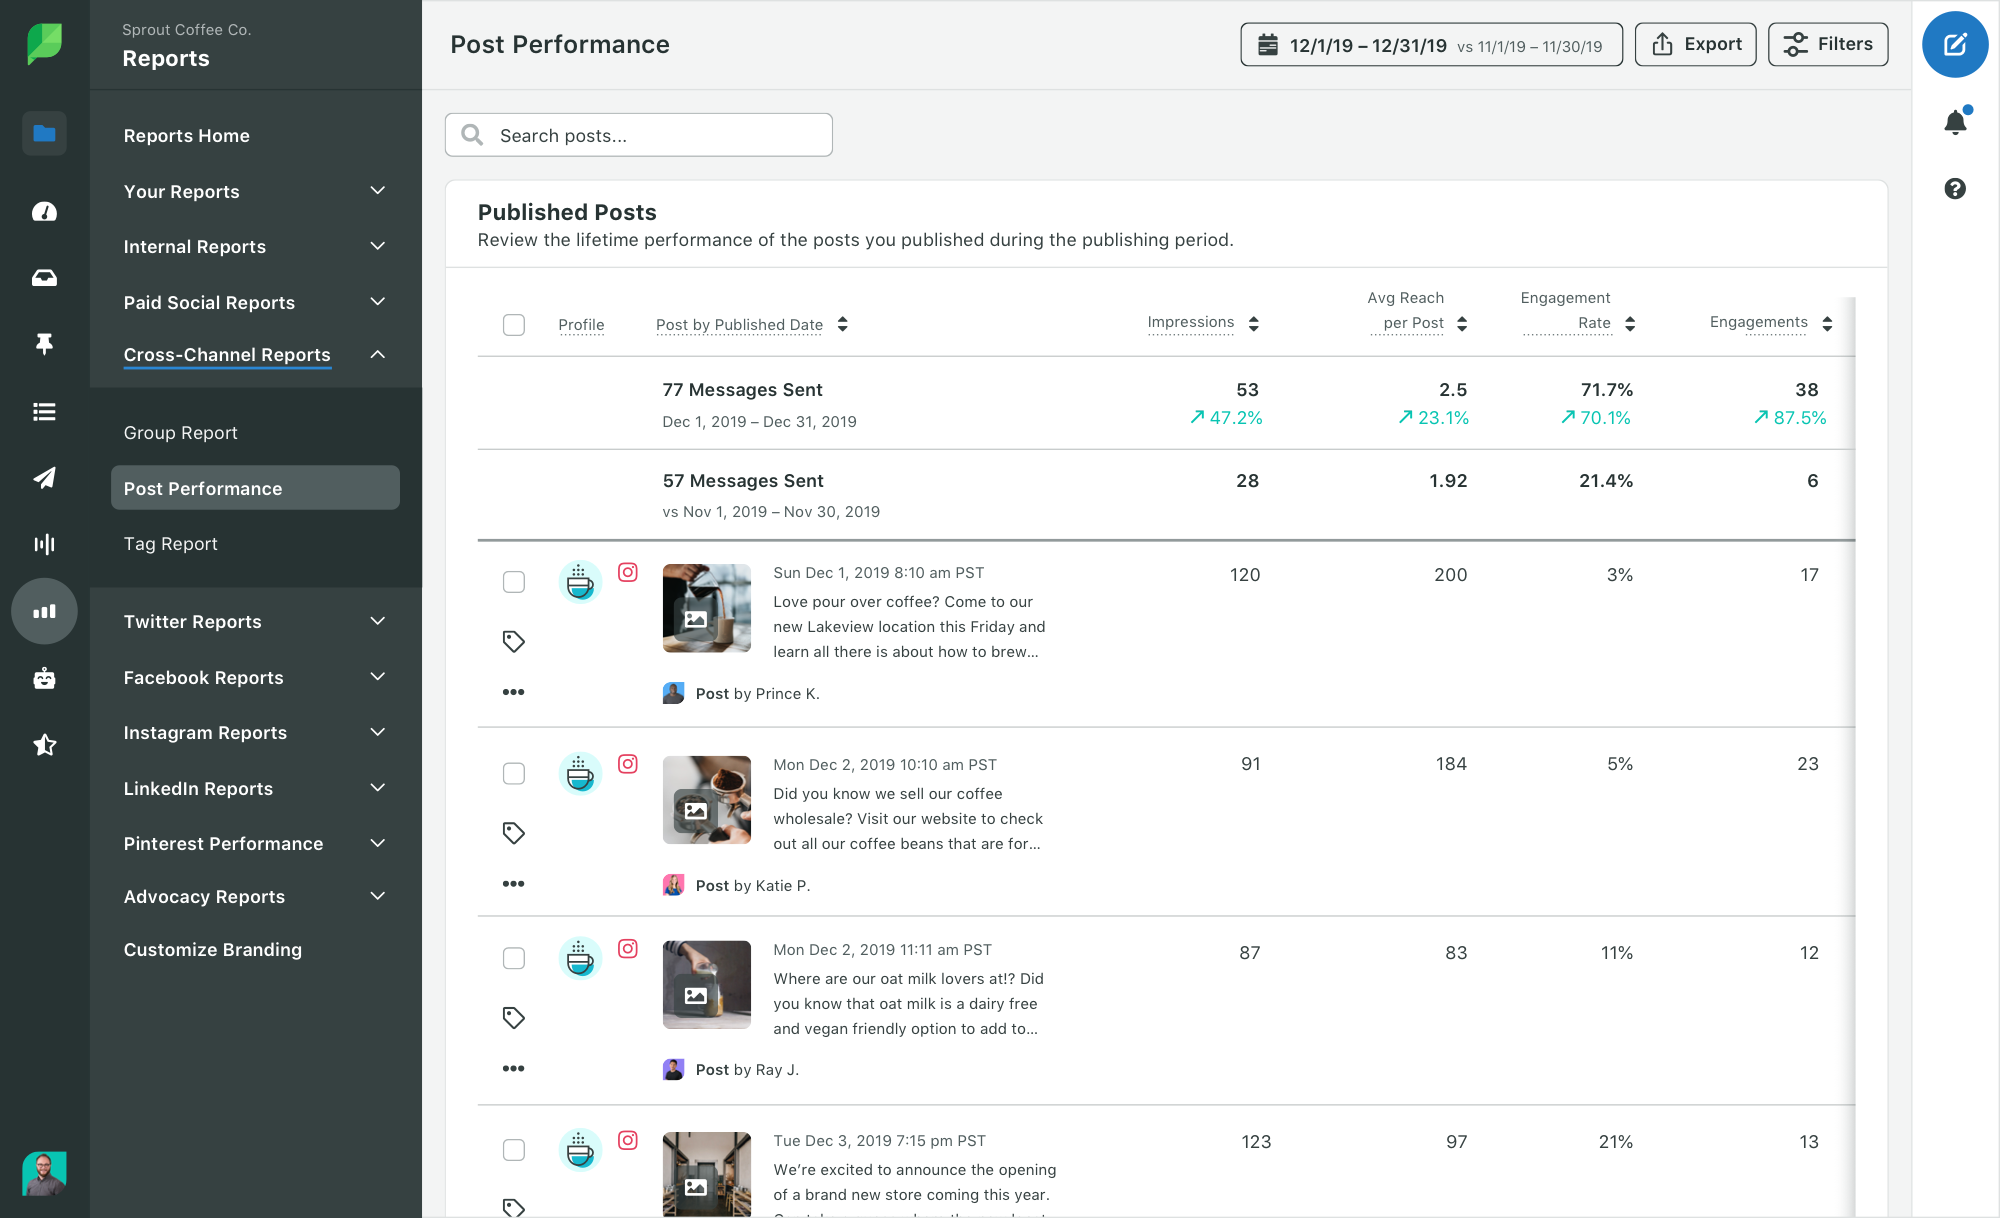
Understanding the Post Performance Report for Facebook
Your Post Performance Report has various data for the dates you’ve selected. The report gives a breakdown by post for each Facebook profile you select. You can see overall engagement, impressions and break metrics down further by seeing post clicks, shares and average reach.
From the Right Bar, you can specify which published status you want to view, including your Boosted Facebook posts to see how they’re performing. You can also see the status for published Facebook content by the Sprout author to see whose content has the best engagement rates.
How to Create a Facebook Competitors Report
The Facebook Competitors Report gives your brand the ability to track key metrics for any Facebook page, and benchmark their performance against your own. Whether you want to see how you stack up against the competition or just want to keep your finger on the pulse of other brands in your industry, our Facebook Competitors Report will give you the intel you need to make more informed decisions.
This report is available for Professional and above plans.
How to see this report:
- Go to the Reports tab.
- Click Facebook Competitors under Facebook Reports.
- Add your competitors. For newly added competitors, Sprout needs to gather at least three days’ worth of data to surface the report which can take some time.
- Select the competitors you want and then select your date range.
- View the report directly in Sprout or export to a PDF or Excel—whatever is most useful for you.
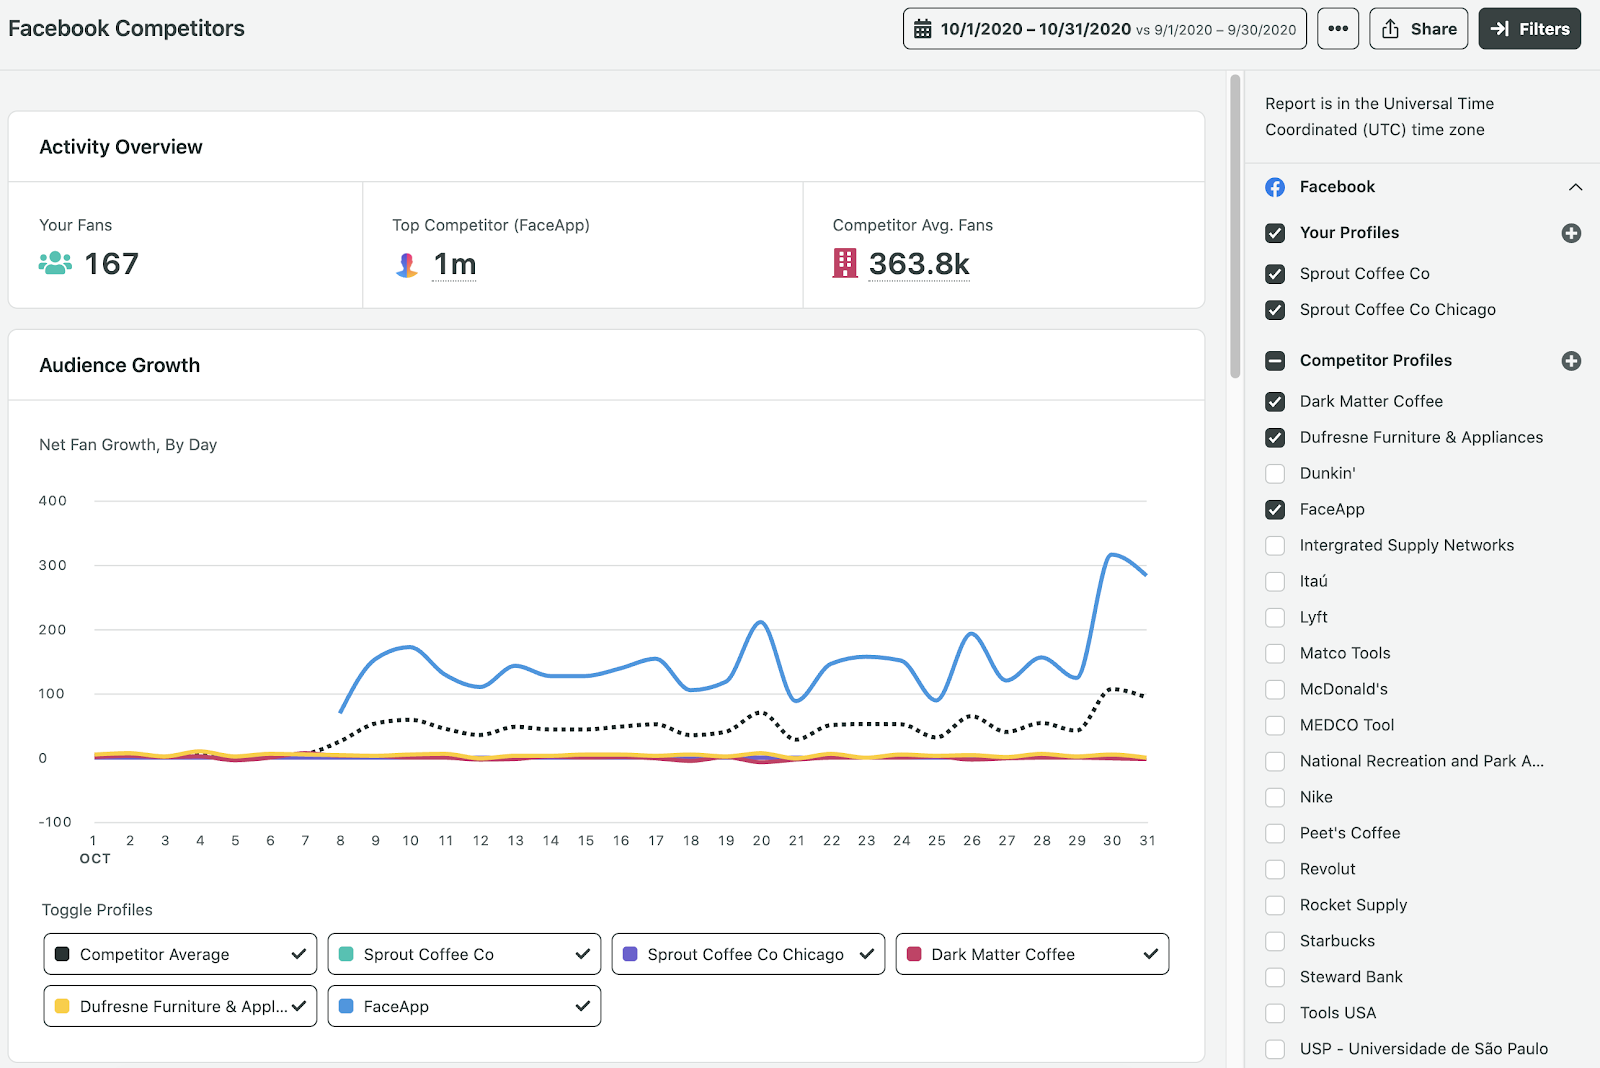
Understanding the Facebook Competitors Report
There are a few different sections within this report that’ll give you insights into what you competitors are doing, and how much success they’re seeing from their efforts.
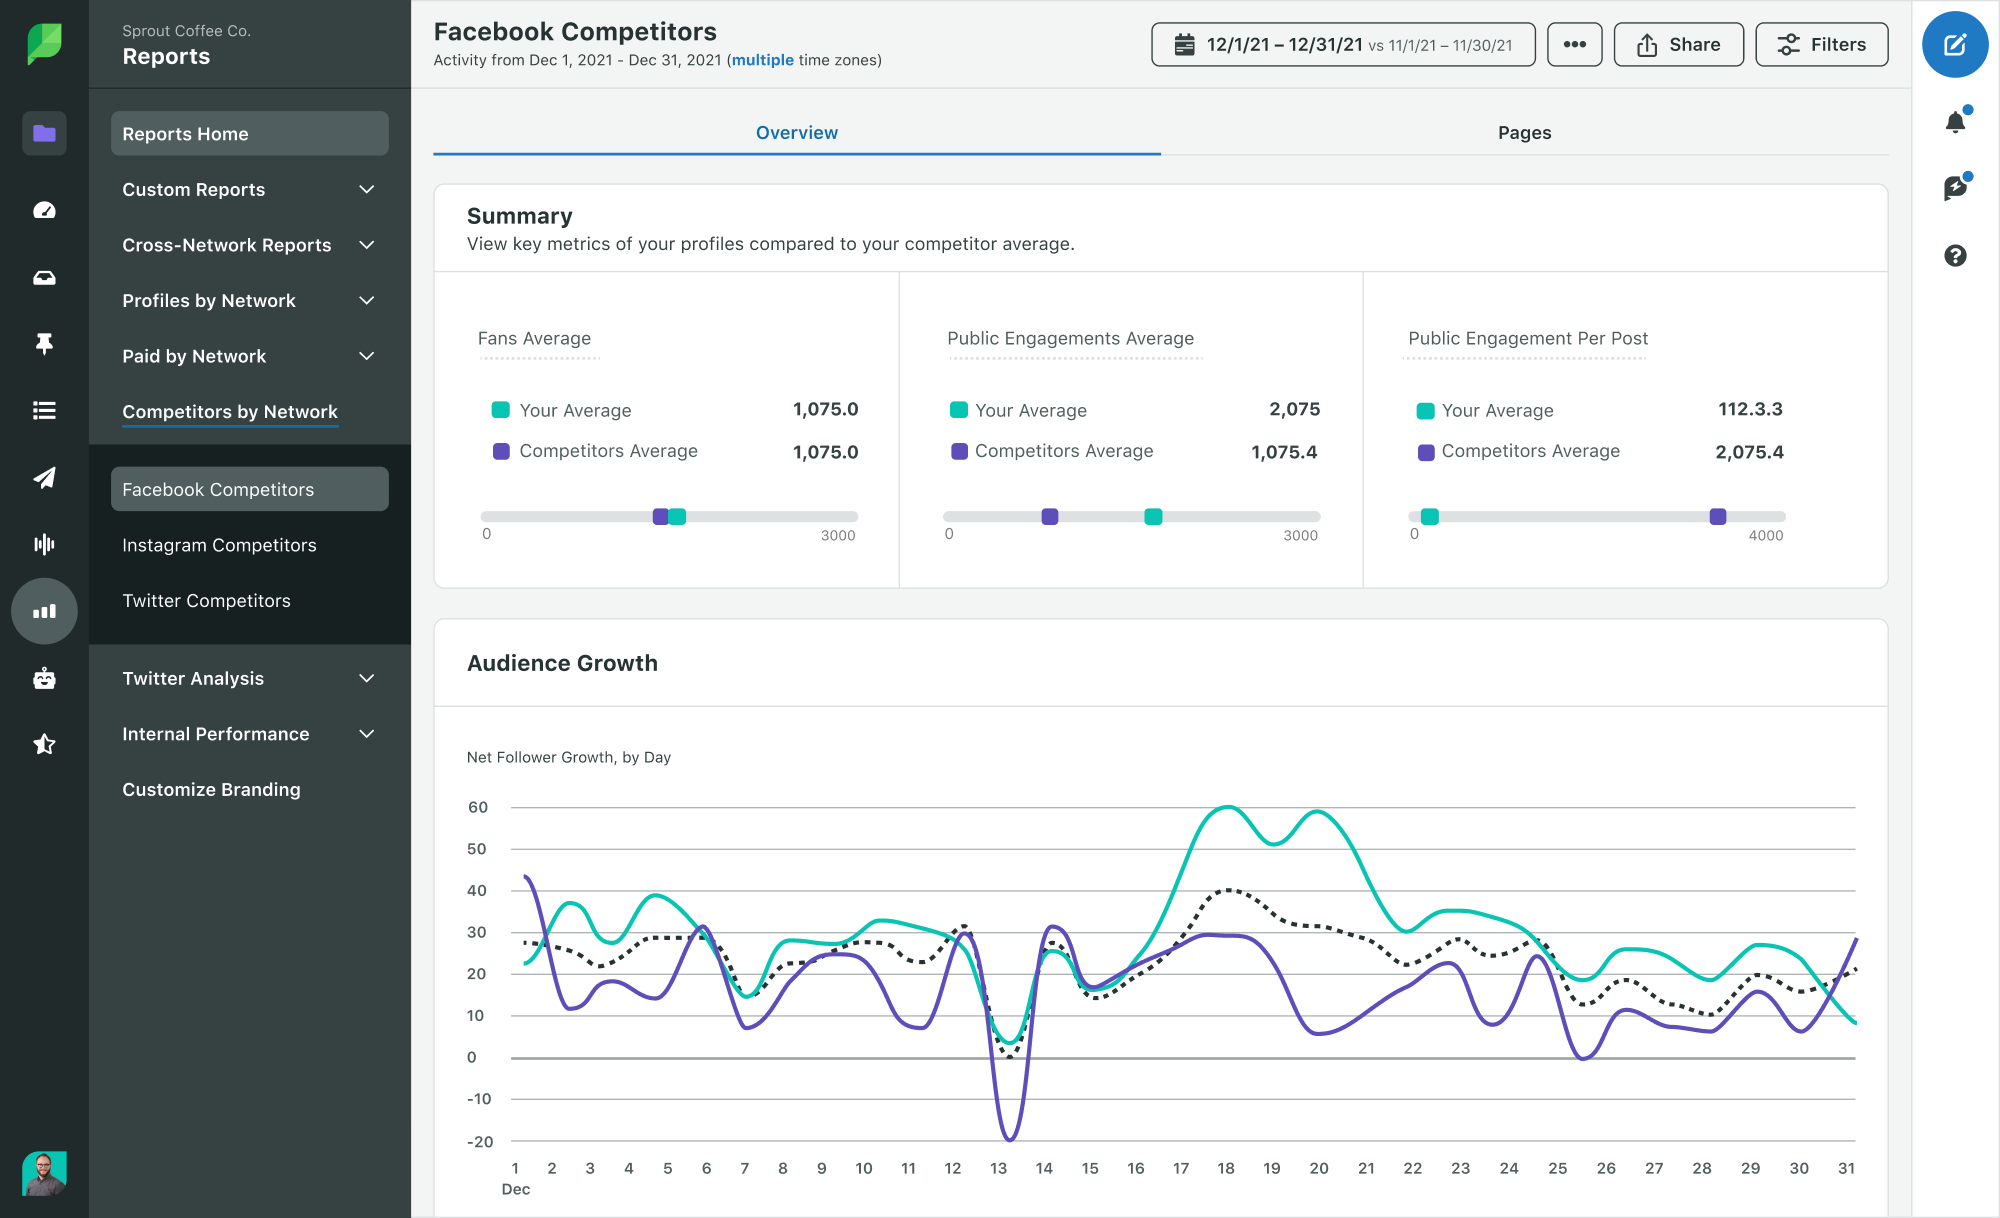
Competitors Overview
The first thing you’ll see is an overview of your audience compared to your competitors. It shows which competitor has the most fans, as well as the average number of fans across all your competitors. Now you can see how your audience size stacks up against the competition.
Audience Growth
Knowing the size of your audience is nice, but it’s also important to understand how quickly (or slowly) your audience grows. With the Facebook Competitors report, you can see how your audience growth compares to other brands.
Are they growing faster than you? Did one of them get a sudden spike in fans over the weekend? How many new fans do other brands get every day? The Audience Growth by Profile section of the report will help you answer these types of questions so you can better judge whether or not your own audience is growing at a reasonable rate.
Message Volume
One of the most common questions brands have is “how often should I post on Facebook?”
Typically you end up blindly guessing how many times you should post each day, or you might not have a posting cadence at all. The Message Volumes section of this Facebook report will help shed some light on your posting schedule. You’ll see how many times your competitors post per day, and you can toggle this report section to see the number of comments and public stories each page receives.
Again, this is extremely valuable for benchmarking your data. But additionally, it’ll give you an idea of whether or not your posting frequency is too high or low. For instance, if you publish once a day on average, but your competitors tend to publish at least three times per day and have more engagement, it could be a sign you need to share more content to compete.
Stats by Page
This section of the Facebook Competitors report gives you a breakdown of publishing and engagement metrics for you and your selected competitors. One area in particular that’s interesting is the Post Breakdown column. Do your competitors primarily publish videos, photos or standard text posts? Look for correlations between the type of content they share and their engagement.
You can also click the down arrow on each row to expand the data for any of your competitors and see their top three posts over a selected time period.
Build a Custom Facebook Report
Want more flexibility over what you show on your Facebook reports? Whether you want to prove the value of your Facebook efforts to clients or you just want to show your CMO the data they care about the most, My Reports can help you create a report tailored to your use case.
Use Sprout’s Facebook Reports to Improve Your Social Media Strategy
Consider running periodic reports (monthly, bi-weekly or whatever makes sense for you) to identify strengths and weaknesses in your social media strategy. With this data at your fingertips you can:
- Analyze the impact of your published content.
- Make smarter decisions on how to increase your social media presence.
- Follow-up on the results of your work by visualizing how these changes in your social strategy translated into responses among your followers and fans.
Learn more about Sprout Social’s Facebook management tools and additional features here.

Share