
Social Media Reporting
Master the art of social media reporting (downloadable template)
Feeling the pressure to prove the value of your social media efforts? This article breaks down how to master social media reporting with essential steps and metrics to follow. Not to mention, it includes a downloadable template for your own practical use.
Reading time 11 minutes
Published on December 24, 2025
Table of Contents
Summary
- Social media reporting starts with knowing your audience and goals. Before creating a social media report, identify your audience (who will be reading the report) and understand your company's social media goals. This will help you determine the level of detail and what points to highlight in the report.
- Data gathering and presentation is a key component of social media reporting. Gather relevant data based on your goals and KPIs (key performance indicators) and choose the appropriate timeframe for the report (daily, weekly, monthly, etc.). Use visuals like graphs, charts and screenshots of social media posts to present the data in an easily digestible way.
- Preparing insights and next steps is the final core step to successful social media reporting. Summarize the key takeaways from the data and outline your recommendations for future social media strategy based on your learnings.
Managing social media is complex. If you’re responsible for your brand’s social presence, you’ve likely felt the pressure before. Your boss wants to know that your efforts are paying off, or other teams want to make sure you’re on the same page.
Like an artist perfecting a particular technique, social media reporting is an essential skill for marketers. You have to pay attention to the right details to convey a meaningful story that your audience understands and gain actionable next steps for your business. This requires a balance of social media analytics and creativity to paint the entire picture.
The biggest challenge? Presenting your social data in a way that makes sense to your colleagues. As businesses invest more in social media, they want to make sure they’re receiving a positive return on investment (ROI). Reporting supports you in illustrating your social activities to your team and justifying your strategy.
Throughout this post, we’ll cover reporting essentials, examples and templates so you can explain and bring context to the bigger picture. We’ll also share how to use Sprout Social’s suite of social media reporting tools for a deeper, more personalized understanding of your brand’s performance.
What is a social media report?
A social media report is a document that compiles and analyzes data from your social media activities over a specific timeframe. It transforms raw metrics into actionable insights that guide strategy and prove ROI.
Effective social media reports include:
- Performance metrics: Engagement rates, reach, conversions and other KPIs
- Audience insights: Follower growth, demographics and behavior patterns
- Strategic recommendations: Data-driven next steps to improve results
Create reports that focus on competitors, specific campaigns or individual social media platforms based on your key performance indicators (KPIs).
Ready to simplify your social media reporting and gain deeper insights?
Regardless of what type of social media report you need, the six steps below will support you in building an effective one for your brand.
Social media reporting metrics to consider
The most important aspect of assessing social media ROI is conveying your KPIs.
The social media metrics you track should align with your goals, so select KPIs that support your brand’s vision.
Here are key metrics that should be front and center in your social media reporting:
| Metric | What It Measures | Why It Matters | Best For |
|---|---|---|---|
| Reach | Potential unique viewers for your content (vs. impressions, which count total views) | Shows audience expansion and content distribution | PR teams, brand awareness campaigns |
| Engagement | Shares, comments, likes and interactions | Proves content resonates with your audience | Content teams, social media managers |
| Traffic | Visits to your website from social media platforms | Connects social activity to website performance | Web teams, digital marketing |
| Conversions | Desired actions taken (purchases, sign-ups, downloads) | Demonstrates direct revenue impact and ROI | Sales teams, executive leadership |
| Clicks | Link clicks, CTA clicks, promotion-specific engagement | Highlights compelling content and effective CTAs | Marketing teams, campaign managers |
| Video Views | Total views, watch time, completion rate | Measures video content effectiveness and audience retention | Content creators, video marketing teams |
Data from our 2025 Content Benchmarks Report shows the majority of businesses use video in their marketing. Track video-specific metrics like repeat views and completion rates to understand whether your production value and length appeal to your target audience.

Track multiple KPIs to understand your social presence holistically versus fixating on a single metric. Find this data through native analytics or via Sprout Social’s reporting tools.
6 steps for getting started with social media reporting
Let’s cover a few concrete steps to creating social media reports so you can get started ASAP:
1. Consider your company’s social media goals
What are your social media goals?
Create a vision for what you want to achieve, such as increasing followers, engagement or conversions. Start simple, then scale as you gain momentum.
Also, stick to the principle of setting SMART goals:
- Specific: Say which strategies you’re going to employ (user-generated campaigns, influencer marketing, Facebook ads and so on).
- Measurable: Track any social goal with numbers.
- Achievable: Make sure you have the resources (creatives, budget) to achieve your goals.
- Realistic: Don’t promise results you can’t produce (think doubling your follower count in a week).
- Time sensitive: Give yourself a quarterly or annual timeframe to achieve your goals.
Framing your data in this way helps you understand if you’re reaching your goals and clues you in on opportunities to pivot if you’re not.
2. Choose your reporting frequency
All social media platforms allow you to pull data from their native analytics based on specific date ranges.

Different reporting cadences serve different strategic purposes. Here’s a quick overview of the benefits of different timeframes:
| Reporting Frequency | Primary Use Case | Best For | Key Benefit |
|---|---|---|---|
| Daily | Monitor brand mentions and timely conversations | Community managers, crisis response teams | Immediate response to trending topics |
| Weekly | Spot emerging trends and optimize tactics | Content creators, social media managers | Quick pivots based on performance |
| Monthly | Track campaign performance and content strategy | Marketing managers, department heads | Progress toward growth and conversion goals |
| Quarterly | Assess overall social performance | Directors, VPs, strategic planning | Larger data sets reveal long-term trends |
| Annually | Year-over-year comparisons and strategy planning | CMOs, executive leadership | Inform annual marketing budget and strategy |
Short-term reports capture real-time performance, but anomalies sometimes skew them. Quarterly and annual reports reveal genuine trends and give you time to dig deeper into your data.
3. Assess your reporting audience
Before building your report, identify your audience. Marketing teams want campaign data without jargon, while executives focus on conversions and ROI.
| Audience | Primary Interest | Metrics to Emphasize | Presentation Style |
|---|---|---|---|
| Marketing Teams | Campaign performance and content effectiveness | Engagement rate, reach, content type performance | Detailed breakdowns with platform-specific insights |
| Sales Teams | Lead generation and conversion tracking | Click-through rate, conversions, lead quality | Direct connection between social and pipeline |
| Executive Leadership | ROI and business impact | Conversions, revenue attribution, cost per acquisition | High-level summaries with financial implications |
| Customer Care Teams | Response efficiency and customer sentiment | Response time, resolution rate, sentiment analysis | Operational metrics tied to satisfaction scores |
| Product Teams | Customer feedback and feature requests | Sentiment trends, common questions, feature mentions | Qualitative insights with quantitative validation |
Pull the data that’s most important to stakeholders and use those metrics to guide your report’s context.
4. Make your social media reporting visual
Include visuals when reporting to stakeholders. Data visualization transforms analytical reports into engaging stories.
Visual representation makes your data easier to digest at a glance. Use charts to highlight engagement spikes, influencer mentions and other milestones your audience cares about.

With Sprout Social, you customize your reports beyond the data you get from native analytics. These presentation-ready reports range from platform-specific metrics to your entire social presence.

Social media reporting is more than a numbers game. Providing real-world data examples from your brand’s social media can open your stakeholders’ eyes. For example, use visuals to guide your audience to that light bulb moment to understand the impact.
5. Provide competitive reports for more context
Pay attention to your competitors’ social performance. Studying their presence informs campagnes, inspires content and keeps you ahead of industry trends.
Seek out competitors with similar social presence to your brand. A local coffee shop shouldn’t compare itself to Starbucks. But industry leaders inspire your content strategy.
Once you have a good idea of your industry peers, use competitive benchmarks to report on the following:
- Audience growth: Are you and your competitors growing at the same rate? If someone’s outpacing you, it’s worthwhile to do a deep dive on their content strategy.
- Share of voice: Which brands are getting content shares the most? Which social accounts are getting lots of love via hashtags? It’s time for you to get a bit louder, so to speak.
- Content performance: Which brands are dominating key social terms in your industry? How often do these top performers post? Consider the type of content that’s doing well too—do they use stories or short-form videos?
Third-party competitive analysis tools support you in answering some of these questions. Sprout Social has a number of tools that do some of the legwork for you, such as our Instagram Competitors Report and Facebook Competitors Report.
6. Summarize your key learnings and next steps
Reporting drives action. Use insights to shape your strategy’s next moves.
Close your report with clear next steps based on data-driven SMART goals. This includes running more ads, publishing more user-generated content or adjusting your posting schedule—let your data decide.
As a final tip, remember to aim for conciseness when sharing information. Bullet points are more than enough—if someone needs further elaboration, they can ask.
How to set up social media reporting in Sprout Social
Let’s walk through creating reports in Sprout Social. Start a free 30-day trial to follow along.
1. Access the reporting dashboard
To build your first report, connect the social media platforms you want to focus on, like Instagram, LinkedIn, TikTok or X (formerly known as Twitter).
If video content is a major part of your strategy, learning how to build a unified YouTube reporting dashboard can help you connect individual video performance to wider business outcomes.
To access the reporting dashboard, go to the left side menu and click Reports. You’ll find different reporting tools like:
- Custom Reports (for Premium Analytics)
- Cross-Network Reports
- Profiles by Network
- Paid by Network
- Competitors by Network
- Twitter Analysis
- Internal Performance
- Reviews

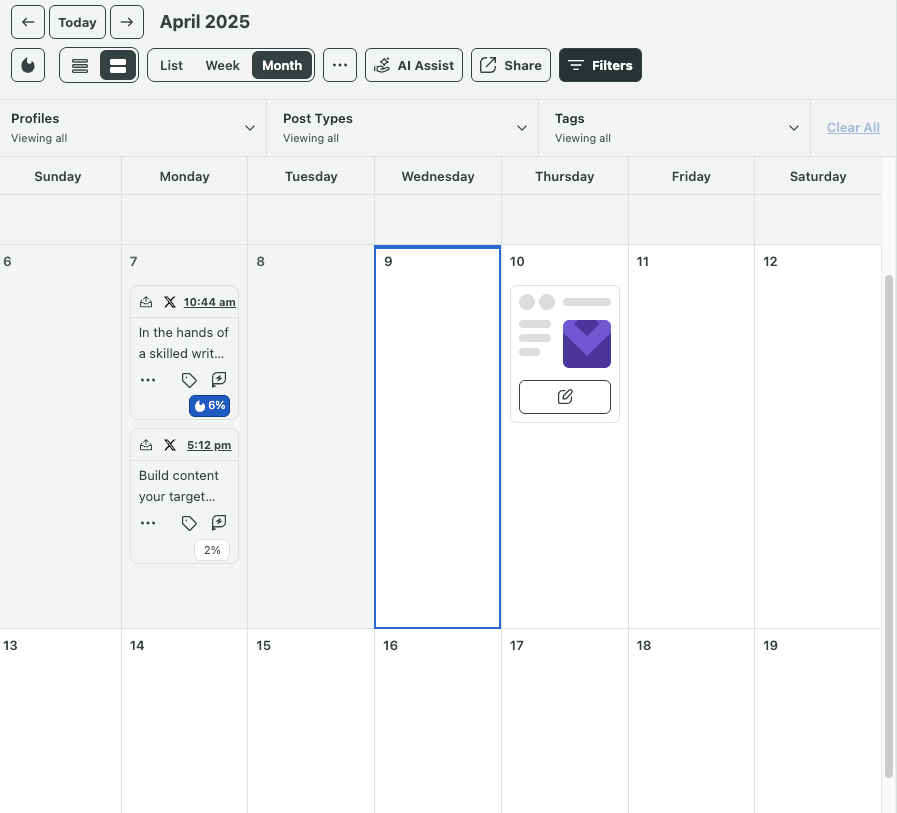
Navigate to Cross-Network > Profile Performance (shown in the menu below) to select the dashboard.

2. Customize and filter your reports
Customize and filter reports by social media platform and dates within each dashboard (like the Profile Performance dashboard). You’ll also find graphs of key metrics like Audience Growth and Engagements right on the same page.

To analyze your Instagram profile’s engagement, here’s what you do: Select a date range and scroll down to the network’s engagement chart. Below, you’ll find Instagram’s daily engagement statistics displayed in red.
Rather watch how to use the Profile Performance Report? Watch the video.

These reports include metrics that align with your goals. Export data to CSV files with up to 50 columns, broken down by day, network or profile.
Each dashboard offers unique features tailored to the metrics it tracks. The Tag Performance dashboard filters by source platform, tags, message types and date range.

3. Analyze key insights
Use the Profile Performance dashboard to analyze audience growth over time. The filtering features support side-by-side comparisons across different time periods.
The example below compares audience growth in March 2025 with March 2024:

Once you’ve set your parameters, you can start analyzing key profile performance metrics like:
- Impressions
- Engagements
- Post link clicks
- Engagement rate per impression
- Audience growth
- Video views

According to our 2026 Social Media Content Strategy Report, consumers want more short-form videos on networks like Instagram, TikTok and X—making video views one metric to keep a close eye on. An analysis of video views would look like this:

You can get a similarly detailed analysis of your overall Cross-Network Audience Growth with a report, like the one shown below:

4. Automate, export and share reports
Once you’ve analyzed your data, share insights with your team and stakeholders.
Navigate to the Share button (next to Filter) at the top of your dashboard. Choose to download your report as CSV or PDF, or send it by email.

Schedule automated deliveries for up to 25 contacts. Click Share in the report’s upper-right corner and select Schedule PDF delivery.

If you want to shave time off routine tasks, put your reporting on autopilot. Advanced Plan users can set automatic, recurring PDF report deliveries to go out every week or month.

5. Optimize your social media strategy
You’re now equipped to optimize your social media strategy with data-driven reporting.
Connect all your social media platforms and analyze their analytics side by side. Monitor progress, then share insights with your team starting today.
Social media reporting examples and tips
These examples work for small businesses and enterprise teams alike.
Include charts and graphs, but don’t stop there. Grab screenshots of high-performing posts, customer praise and industry accolades to illustrate impact.
For example, G2 customers rated Sprout Social as the Best Software Product out of all products on the market in 2024. If your stakeholders are interested in brand awareness, reach or thought leadership, this LinkedIn post) illustrates how social is amplifying those goals.

You can also showcase when a customer applauds your product on social, like in the X post below:

If your stakeholders want to know if customers like a new feature or update, including visual praises like the one above is a great way to drive that point home.
For more real-world examples, we’ve highlighted several bold brands who are delivering ROI using social data.
Competitor reports
Remember to pay attention to your competitors’ data as well to benchmark your social media performance. Sprout Social’s competitor reports show several relevant KPIs at the top, along with a graph illustrating audience growth.

Network report
Sometimes your stakeholders want to focus on one network. To support this, Sprout Social’s network reports show views, engagements and other metrics for your social media platforms.

Custom reports
Build completely customizable reports with My Reports. Add multiple charts, tables and visualizations to compare performance across networks.
Filter individual charts by metrics, tags and content types. Get granular in one chart while viewing high-level data in another, all within the same report.
Customize reports for specific business units and stakeholders. Add annotations to build executive summaries and rename components to tell the right story for each audience.

Learn about Sprout Social’s Premium Analytics
Campaign reports
Social media campaign management is challenging, but you can use reporting to guide your team and determine success points, gather insightful data for future campaigns and highlight which metrics to hone in on the most.
In Sprout Social, you can use the Tag Report tab to track a campaign.

Creating social media marketing dashboards that track and update in real time supports fast, consistent reporting.
Social media report templates
Social media reports are essential but time-consuming, especially when meeting multiple stakeholders’ needs. Templates give you presentation-ready reports you can customize, saving you hours in your day.
Here are six social media reporting templates you can download today:
| Template Name | Primary Purpose | Best For | Key Features |
|---|---|---|---|
| Social Metrics Map | Define objectives and measurement approach | Strategy planning, goal alignment | Funnel stage tracking, consistency framework |
| Social Media Analytics Spreadsheet | Track paid and organic performance | Performance analysis, campaign comparison | Cross-platform tracking, goal alignment |
| Social Media Scorecard | Executive-level performance snapshot | C-suite presentations, board meetings | Competitive context, ROI demonstration |
| Creative Testing Worksheet | Design and track A/B tests | Content optimization, format testing | Hypothesis tracking, results analysis |
| Social Media Market Research Worksheet | Gather audience insights | Strategy development, positioning | Question framework, competitive landscape |
| Social Listening Insights Deck | Communicate listening findings | Leadership presentations, strategy sessions | Sentiment trends, conversation drivers |
Social Metrics Map template

Define your social media objectives and document your measurement approach. This template includes a guide for tracking each stage of the social media funnel.
Social media analytics spreadsheet template

Track and compare paid and organic performance across all platforms. Tie your performance metrics directly to business goals.
Social media scorecard template

Provide C-suite executives with a bird’s-eye view of performance, brand health and competitive context. This visual deck connects social activities to business goals and demonstrates ROI.
Creative testing worksheet

This worksheet supports you in designing A/B tests, tracking results and gaining insights into what your audience wants.
Social media market research worksheet
Turn your social channels into a focus group. This worksheet helps you gather insights by narrowing down the right questions to understand your competitive position.
Social listening insights deck template

Social listening delivers insights that make or break a brand. This deck helps you summarize findings, identify sentiment trends and pinpoint conversation drivers.
Start creating better social media reports today
Social media reporting transforms raw data into strategic intelligence. When done right, it proves ROI, guides strategy and secures stakeholder buy-in.
Here’s what you’ve learned:
- Define clear goals before building reports
- Track metrics that align with business objectives
- Visualize data for stakeholder comprehension
- Automate reporting to save time
- Use templates to maintain consistency
Sprout Social’s intuitive reporting platform creates presentation-ready reports in minutes—not hours. Connect all your social media platforms, customize metrics and automate delivery to stakeholders. Start a free trial or request a demo to explore Sprout Social’s reporting features.
Frequently asked questions about social media reporting
How long does it take to create a social media report?
Manual reporting takes several hours to days, depending on platform coverage. Sprout Social automates data collection, reducing reporting time to minutes.
What's the difference between social media analytics and social media reporting?
Analytics is the process of gathering and analyzing performance data. Reporting compiles those insights into documents that communicate value to stakeholders.
Can I automate social media reports?
Yes. Sprout Social allows you to schedule recurring reports that are automatically delivered to stakeholders weekly, monthly or quarterly.
What should I do if my social media metrics are declining?
Investigate external factors like seasonality or algorithm changes, then review whether your audience’s preferences have evolved. Use these insights to experiment with new formats, posting times or messaging angles.
How do I explain social media ROI to executives who don't understand social media?
Connect social data to business outcomes like website traffic, lead generation and revenue. Frame reporting around business impact, not vanity metrics like likes or followers.
Additional resources for Social Media Reporting
How to build a strategic YouTube dashboard: A guide to YouTube Studio and beyond
The data-driven guide to mastering your X (Twitter) dashboard
Master the art of social media reporting (downloadable template)

How to build a social media scorecard that closes the reporting gap and proves ROI to leaders

Why you need to share an executive summary of your social media reports with leadership

20 social media KPIs to drive business growth


6 must-have social media dashboard templates for brands

3 ways to get more from your data with Sprout custom reporting

Data visualization: What it is and how it adds value to marketing


How to build the perfect Instagram dashboard

Share