Business intelligence reporting: making sense of your organization’s data

Written by Jasmine Williams
Published on February 21, 2024
Reading time 8 minutes

Most businesses collect a wealth of data daily. From consumer and competitor insights to social media analytics, this data helps you make smarter decisions, spot trends and stay ahead of the curve—if you know how to make sense of it.
This is the power of business intelligence (BI) reporting.
The right BI tools turn mountains of data from various sources into actionable, easily analyzed documents or dashboards. Instead of guessing or sifting through piles of data, BI reporting does the heavy lifting for you, saving you time and headaches.
Bringing social media insights into the mix adds a whole new dimension to your reporting as well because you get real-time feedback from your social media audience, competitors and campaigns. This gives you the most up-to-date insight into how people perceive you and engage with your brand.
Read on to find out all you need to know about business intelligence reporting, why you need it, the best reporting tools and business intelligence best practices.
Table of Contents
- What is business intelligence reporting?
- What is the importance of business intelligence reporting?
- Business intelligence reporting challenges
- Top business intelligence reporting tools
- Business intelligence reporting best practices
What is business intelligence reporting?
Business intelligence reporting is the process of collecting data from various sources, such as customer databases, financial information systems and digital marketing channels, and presenting it in a digestible and actionable format.

Business intelligence reports help organizations understand what’s happening with their business, and make sense of critical data in order to make more informed decisions and predictions. The result? Often more growth and a bigger bottom line. According to a McKinsey report, data-driven organizations experience above-market growth and earnings increases of 15 to 25 percent.
Business intelligence reports can also be tailored for specific departments and stakeholders. For example, marketing business intelligence helps organizations contextualize marketing data and connect marketing metrics like social media engagements and follower growth to broader business goals. It also helps businesses predict the future by spotting trends and identifying potential problems before they get out of hand.
What is the importance of business intelligence reporting?
The biggest benefit of business intelligence reporting is that it reduces guesswork. Instead of relying on gut feelings or hunches, data provides concrete evidence to guide decisions.
Here are a few other key advantages of business intelligence reporting.
Faster decision-making
According to research from Oracle, 74% of people say the number of decisions they make every day has increased tenfold over the last three years. Business intelligence reporting addresses this decision fatigue by providing instant access to critical insights. Whether you’re analyzing budgets, planning a marketing campaign or optimizing internal processes, BI helps you make quick, intelligent decisions on the spot.
Customer insights
Customers today are pickier about where they spend their money and which brands they trust. They like brands that understand how they think and feel. Business intelligence reports help you tap into your customers’ needs and even predict their wants by uncovering in-depth behavior and trend data.
Competitive analysis
Analyzing business intelligence data on competitive analysis insights like competitor engagement, follower growth and content strategies helps businesses understand what’s going well for their competitors and identify opportunities to refine their social media strategies. For example, if a BI competitive report shows you that a competitor’s video content has been doing exceptionally well lately, you might consider incorporating more video content into your social media strategy.
Cost optimization
BI reporting also uncovers operational inefficiencies, such as production bottlenecks, slashing unnecessary expenses. You can also proactively monitor key performance indicators like cost per unit produced or cost per sale, to address them and be on target. Lastly, combining historical data and predictive analytics helps companies forecast future costs more accurately, leading to better resource allocation and budgeting.
Streamlined process
Have you ever wondered when you should publish a social media post or what types of content resonate most with your audience? BI reporting tools analyze data from social media platforms to give you data-driven content strategy recommendations. The result? Less time experimenting and more time producing more of what your audience enjoys at the right time.
Reliable data quality
Business intelligence tools consolidate data from various sources into a single platform, reducing the chances of errors due to manual data entry or siloed information. They also often have data cleaning features that catch inconsistencies and duplicate entries. Many BI tools also offer real-time or near-real-time data updates, so you always have the most current information at hand.
Data-driven culture
With customizable and personalizable dashboards, BI tools empower your employees to make more data-informed decisions, ultimately benefiting the whole organization. When everyone can access, analyze, share and act on relevant data it fosters a more data-driven culture.
Business intelligence reporting challenges
Business intelligence tools make it easier but synthesizing data from different sources into one accessible dashboard or report isn’t so simple. Understanding all that information and ensuring the data is accurate, relevant and helpful is also tough.
Whether you’re already using business intelligence tools in your organization or getting ready to implement a solution, here are some common challenges you might encounter.
Technological advancements
Technology advancements make business intelligence reporting tools more impactful, but have certain challenges. Take cloud-based solutions, for instance. They handle vast amounts of data but also need tight security to keep that data safe. Rapid advancements also mean frequent software and system updates, leading to higher maintenance costs and additional training required to keep users up-to-date.
Data governance
Business intelligence reports contain sensitive information, so you need clear rules and processes around access to keep your data safe and accurate. Think of data governance as the rulebook for how a company handles its data. It involves deciding who’s responsible for what, ensuring the data is clean and reliable, and keeping it safe from hackers or unauthorized access using encryption or other safeguards. Controlling who sees what data is critical.
Linguistic challenges
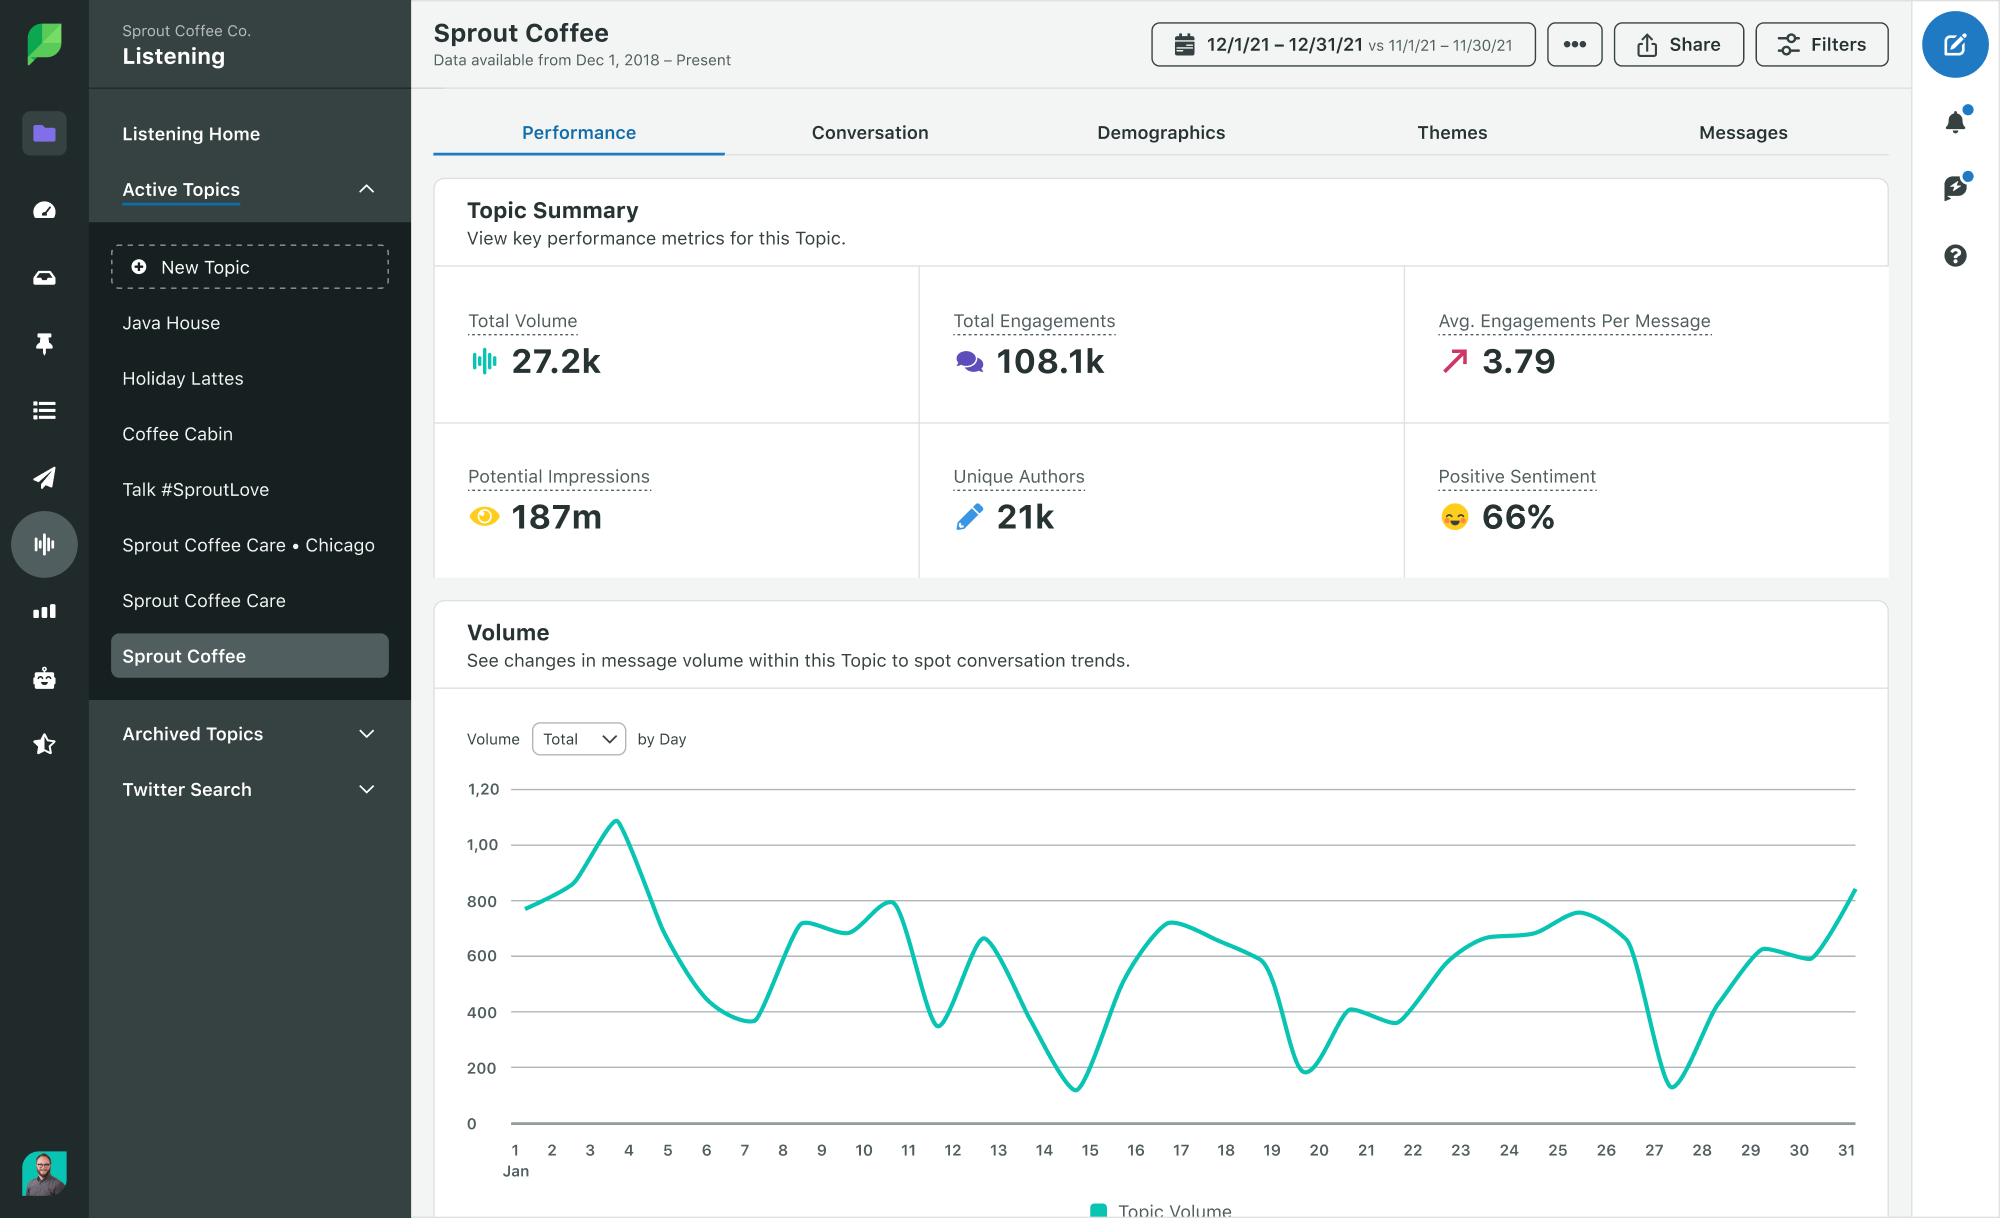
Business intelligence reports often have technical terms and complicated data that might leave non-experts scratching their heads. Also, if the report’s language isn’t consistent with the terms your employees already use, they’ll struggle to understand it and become overwhelmed. Sprout understands this. That’s why our social media intelligence reports, for example, include topic summaries so report viewers can quickly view the top performance metrics they care about.
User adoption
Some people in your organization might resist using business intelligence software because they’re used to other methods or feel overwhelmed by new technology. Plus, some BI tools are pretty complex, even for the tech-literate. Getting everyone on board with BI reporting means providing the right support and showing them how it will make their jobs easier.
Top business intelligence reporting tools
Business intelligence can be a game changer for your company. However, with so many platforms on the market, it’s tough to know which business intelligence tools would best fit your organization.
Here are a few of the most popular choices on the market and their capabilities.
Sprout Social
Sprout Social makes spotting business trends and opportunities a breeze. Sprout has plenty of built-in reporting tools and templates, like our Social Listening and Sentiment Analysis features, that will show you how your company stacks up to competitors and how your audience feels about your brand. Sprout also integrates with Salesforce and Tableau, allowing you to see your social data alongside other business intelligence insights and get a 360-degree, unsiloed view of your business data.

Need more customization? Use our reporting features to build custom reports from scratch or personalize existing templates with widgets to hone in on key data—like the sample Go-To-Market Product Launch report below. Our digestible and user-friendly social media reports are also easy to understand and share with teams.

With Sprout, you’ll be able to contextualize social media insights by seeing which interactions and campaigns attract leads and drive revenue growth.
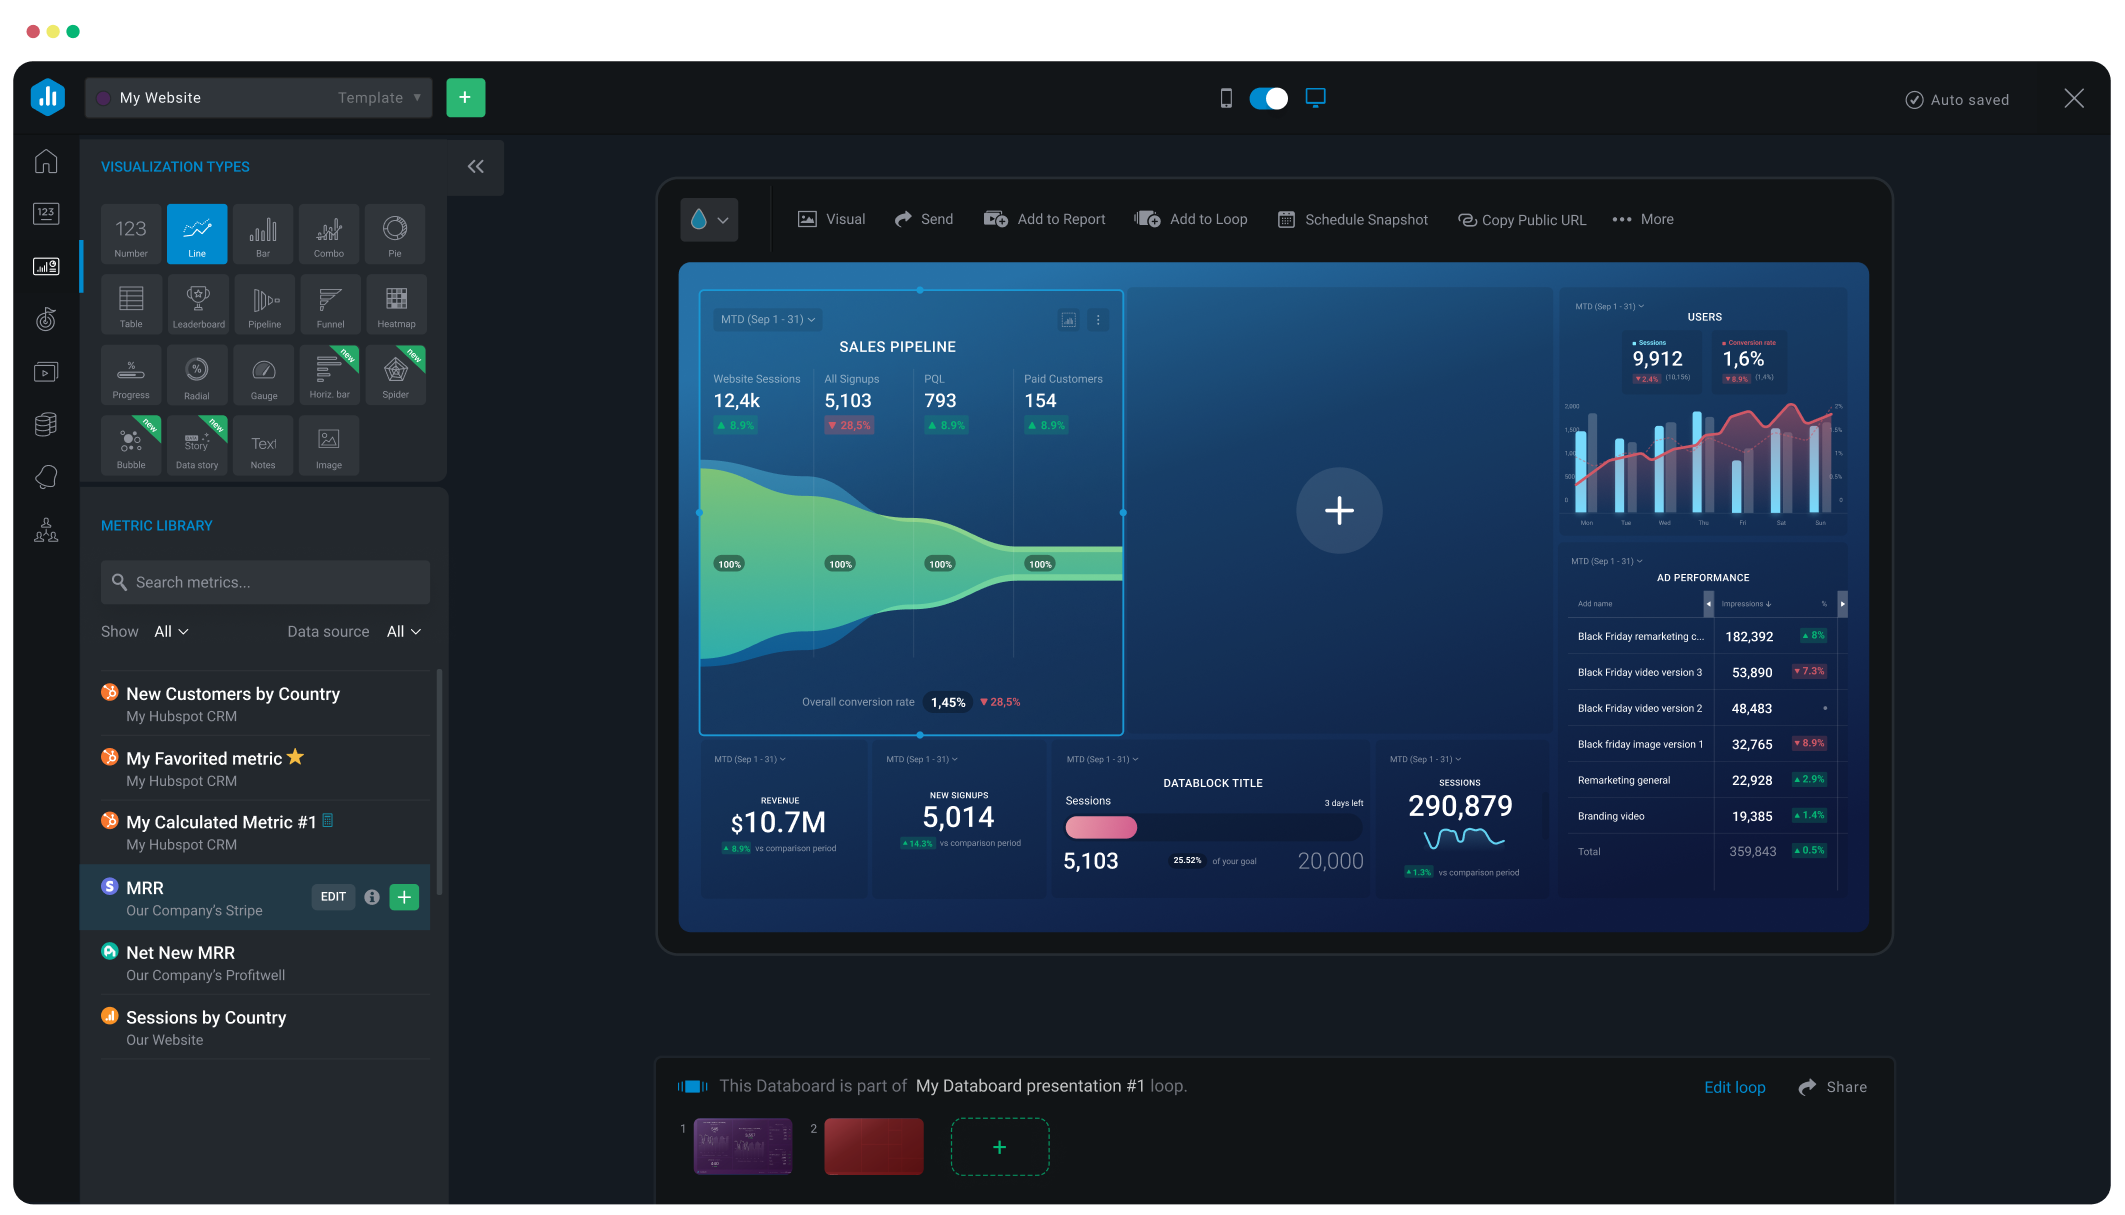
Databox
Databox is an analytics platform that simplifies data management for growing businesses. It centralizes your data for better decision-making and performance improvement. With Databox, you get a centralized source of truth, quick access to insights and better decision-making informed by data. As a result, you’ll spend less time creating reports and more time focusing on strategy.
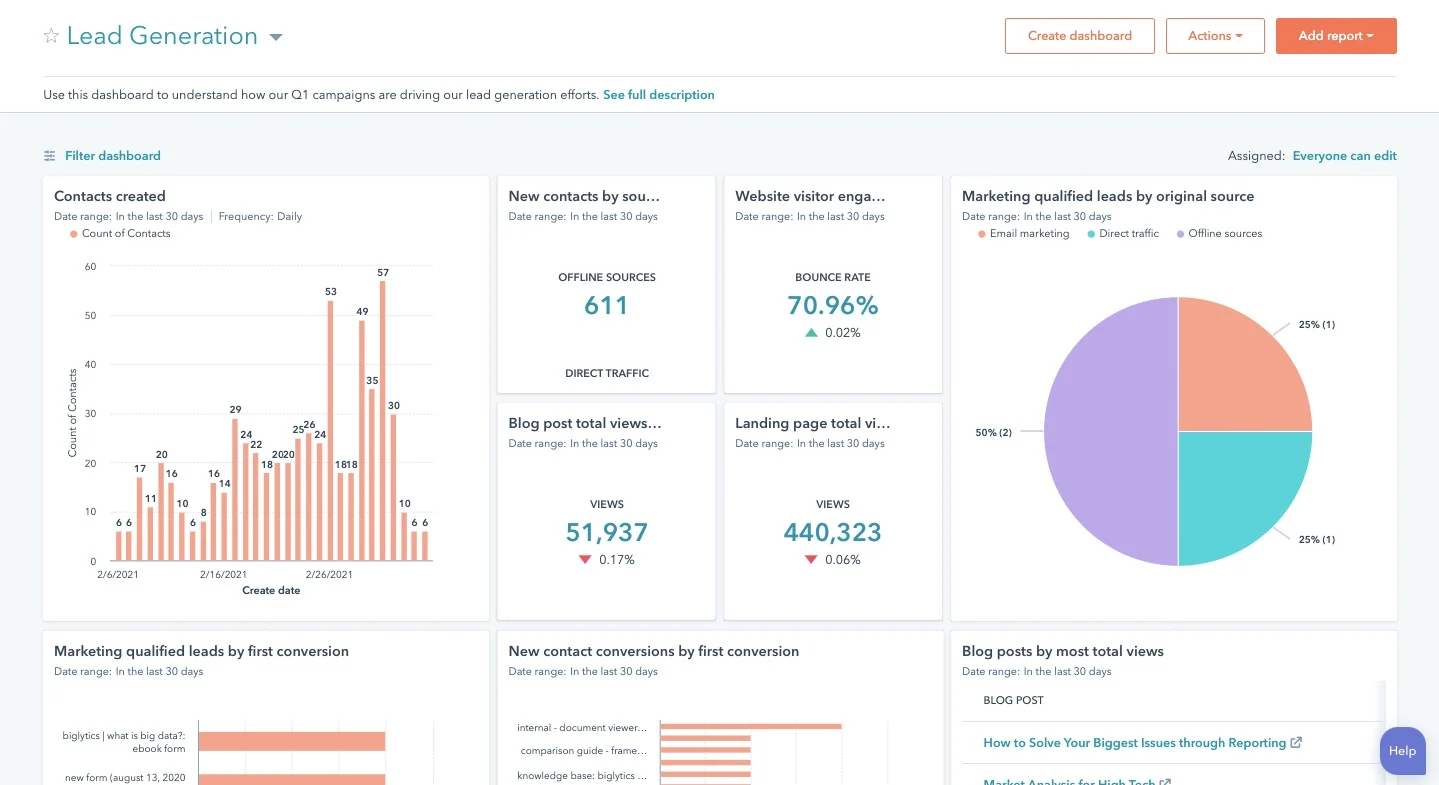
HubSpot
HubSpot simplifies business intelligence, providing a comprehensive platform for all your customers’ needs. The all-in-one platform connects your marketing, sales, customer service, content management, operations and commerce processes, providing deep insights into every customer interaction. From marketing automation to sales tools, HubSpot helps organizations connect with and better understand their customers.
Business intelligence reporting best practices
Using business intelligence tools without following best practices is like taking a road trip with a broken GPS. You’d probably get lost and make some wrong turns. Similarly, misusing BI tools could lead to inaccurate conclusions, poor strategic decisions, wasted resources and missed growth opportunities.
Here are a few best practices to get the most out of your business intelligence tool.
Define your stakeholders
Who will be accessing your business intelligence reports? Marketers? Customer service representatives? Product developers? Executive leadership? All of the above? Before generating a report or creating a dashboard, identify who will be using those reports. Then, based on their needs, technical skills and knowledge, include only the most relevant information.
Choose the right metrics
When picking metrics to include in your reports, consider the following three questions:
- Your business goals. Are you focusing on long-term or short-term objectives?
- Your audience. How do they impact decisions?
- The bigger picture. What metrics will paint the most comprehensive story and guide your next steps?
Use data visualizations
Let’s face it—numbers and spreadsheets are a little boring to review and challenging to understand on their own. That’s why visuals are super helpful for data reporting and storytelling. Just don’t overdo it. Don’t cram too many graphs and charts into your reports. Leave some white space between your visuals for clarity.
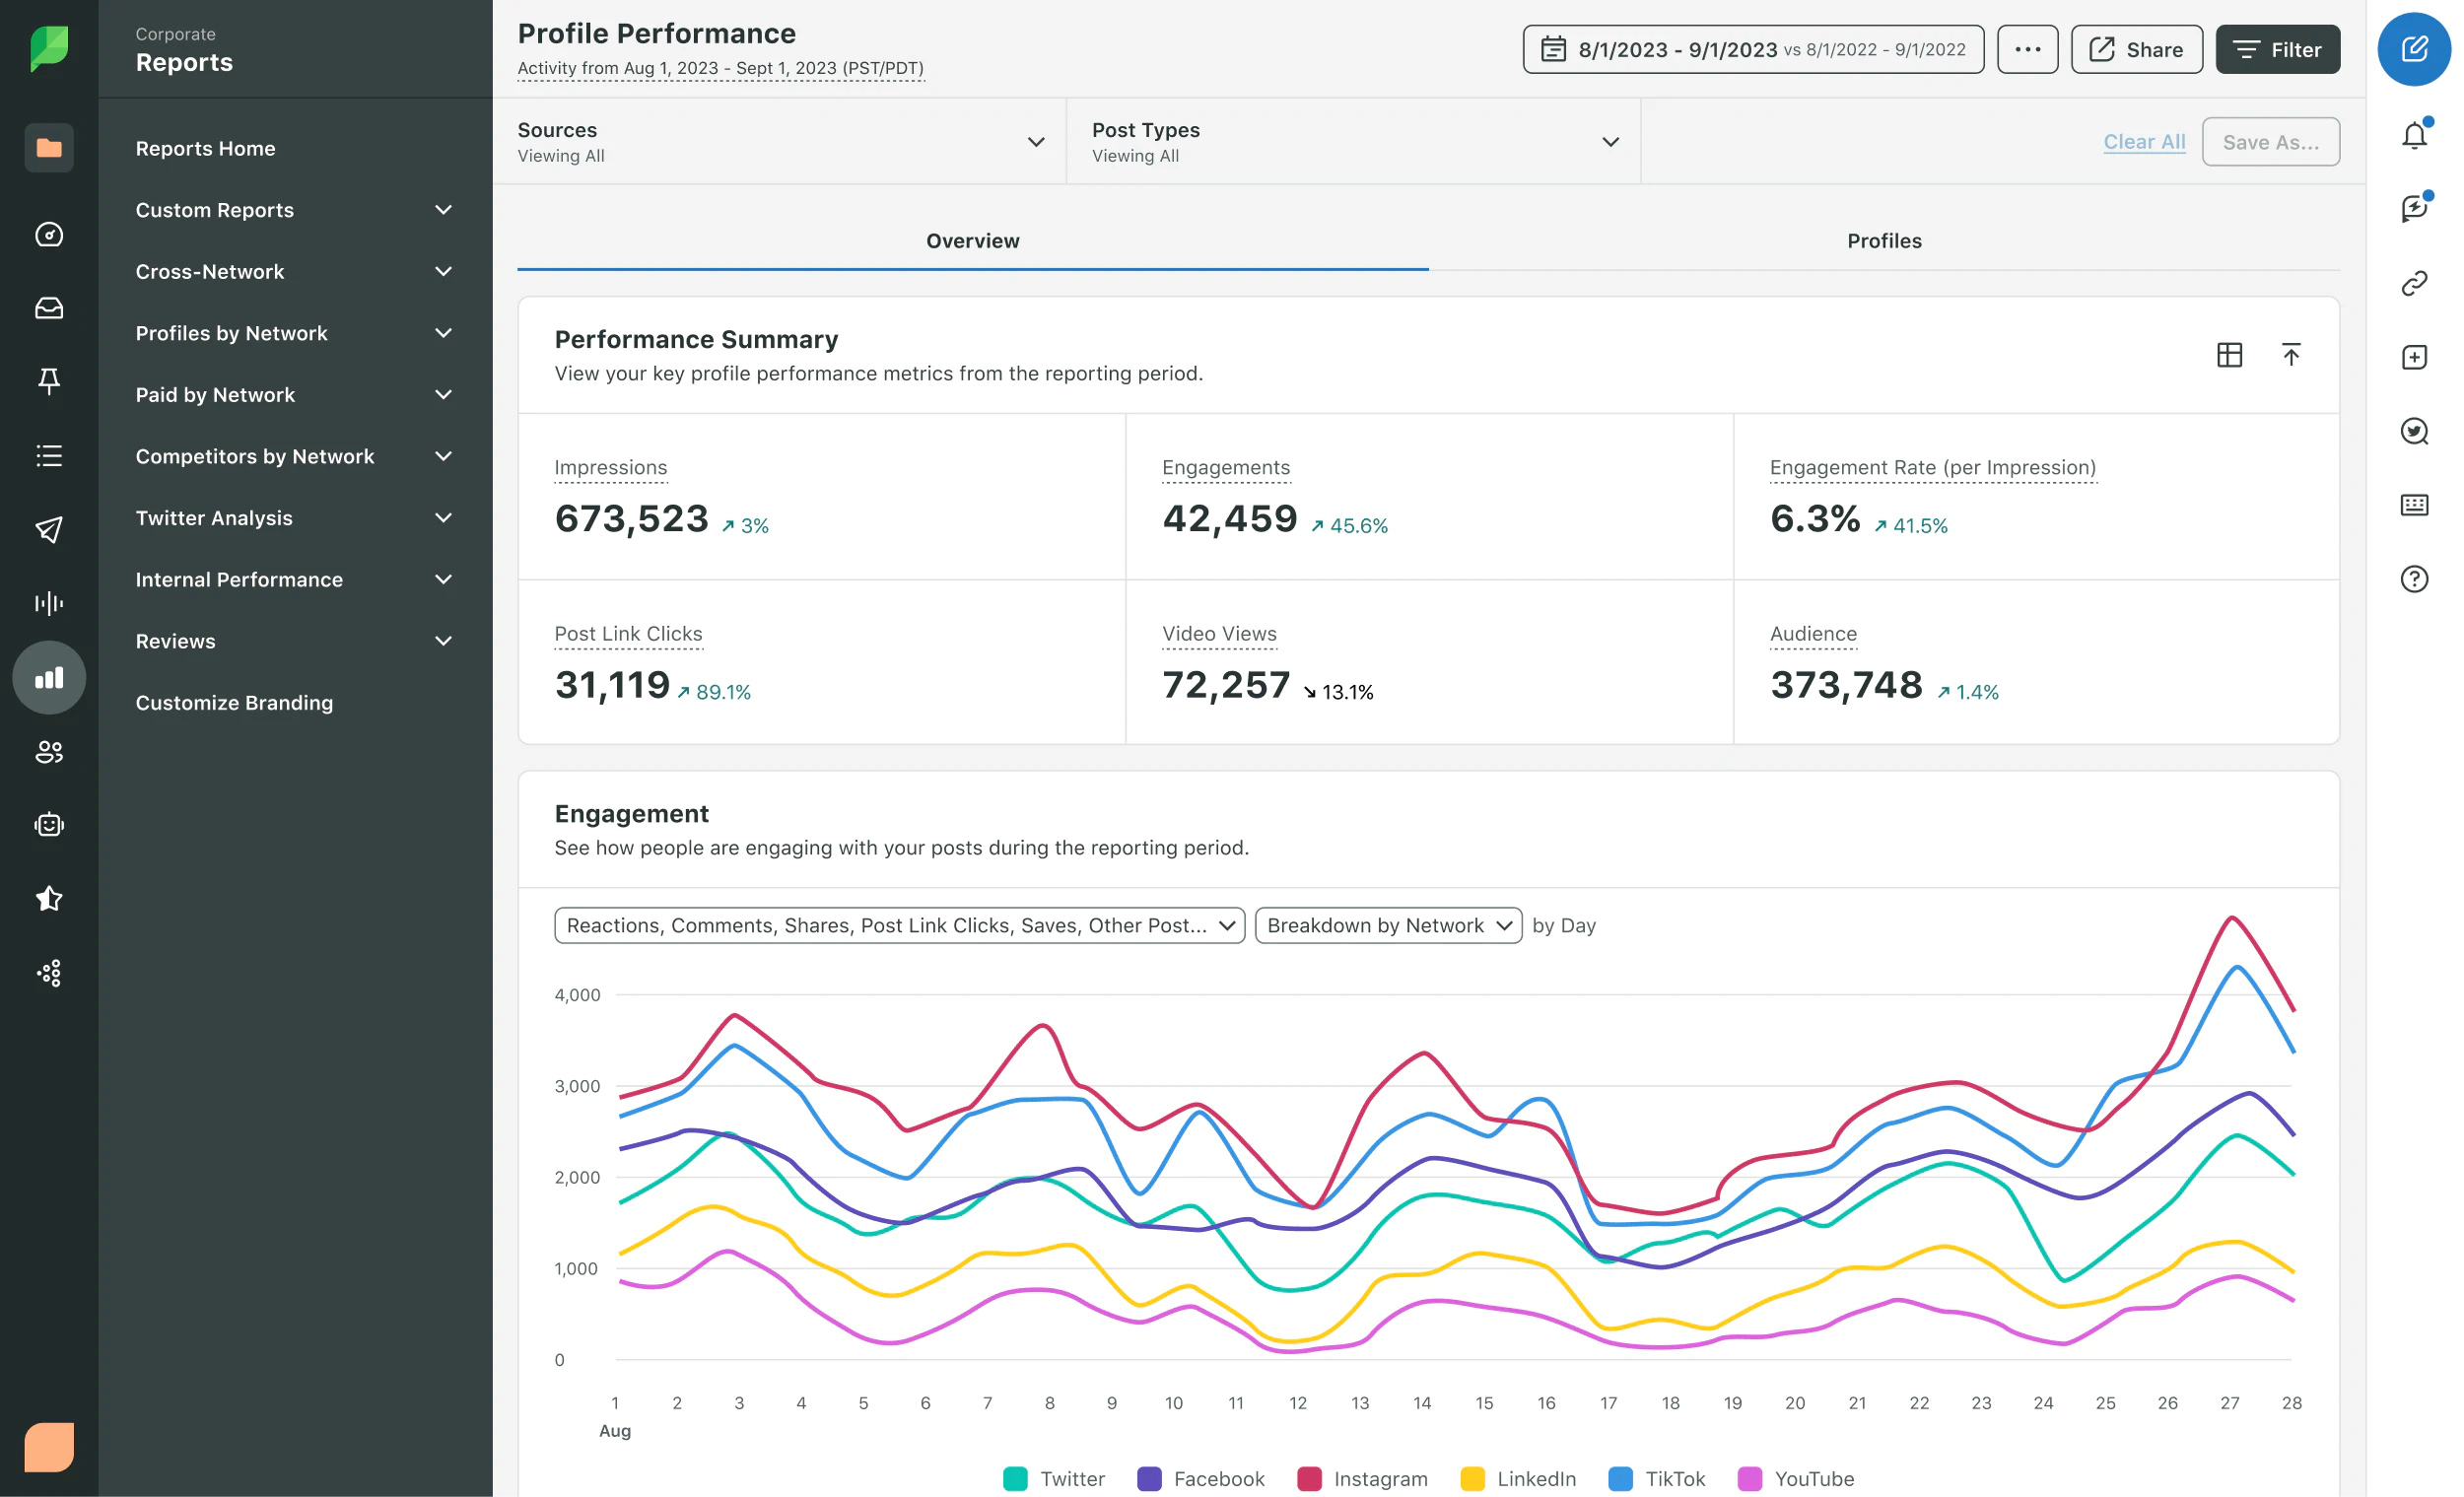
Drop-downs and filters also help users focus on the most relevant insights. For example, in the Sprout Social Profile Perfomance report pictured below, the filter button (in the top right corner) enables users to select the profiles they want to view data for throughout the report.
Ensure data reliability
If your data isn’t reliable, it’s unusable. To ensure your business intelligence reports present trustworthy data, regularly check your data sources and verify that they’re pulling the most accurate and up-to-date data. You should also double-check your data for errors or inconsistencies. Lastly, secure your data using multi-factor authentication, encryption or other measures.
Leverage AI
AI is a powerful tool for interpreting business intelligence data. AI can review historical data to predict future trends, which could help you manage inventory or project sales. It also assists in abnormality detection, notifying you of unusual data patterns like sudden drops in website traffic.
The future of BI reporting with AI
Business intelligence is a powerful tool in its own right. However, adding AI brings a whole new level of capability. For example, if AI handles most of your data analysis, trend spotting and report creation task, you’ll have more time to focus on strategy while making faster decisions and predictions.
We’re already incorporating AI into Sprout’s social business intelligence features. For example, our Smart Categories tool automatically identifies, classifies and groups data in your Listening Topic (i.e., specific keywords, hashtags, brands, or industries you follow). The Sentiment in Listening feature also uses AI to classify messages as positive, negative or neutral.
Ready to see what AI-powered business intelligence can do for your organization? Request a personalized Sprout Social demo today.

Share