3 ways to get more from your data with Sprout custom reporting

Written by Carly Hill
Published on October 12, 2023
Reading time 7 minutes

Just as there is no such thing as a one-size-fits-all social strategy, there’s no one social report that works for every team.
Data analysis and social media reporting are becoming increasingly important skills for social media marketers. Today, there’s an increased pressure, and need, to use this data in more sophisticated ways—on the social team, and beyond. According to The 2025 Sprout Social Index™, 65% of marketing leaders say showing how social media campaigns are tied to business goals is crucial to securing social investment. Not to mention, 45% of marketing leaders say sharing data in a contextualized way is vital for the same purpose.
As brands and business leaders realize this potential, they place a growing emphasis on the need for marketers to understand and share their data in the context of specific goals and strategies. In order to do so, modern teams must be able to easily create custom reports.
In this article, learn the importance of custom reporting, and how Sprout customers are using their custom reports to empower swifter, better-informed decision-making.
What custom reporting in Sprout looks like
The value of social media and the insights that come from it has never been more widely understood. According to this year’s Index, 76% of marketers agree that their social insights inform other departments.

The more influential social insights become, the more robust, agile and focused your reports must be. Adding a custom reporting ability to your social media analytics tools enables them to serve the needs of various teams.
In Sprout, you can build completely customizable reports with our My Reports feature. You can add multiple charts, tables and data visualizations–from line charts to bar graphs–to a single report. This makes it easy to compare high-level performance across the networks that matter to your brand, while still diving deep on specific metrics where you need more insights.
My Reports in Sprout takes customization to the next level
With the level of customization My Reports offers, you can even filter individual charts by different metrics, tags and content types. In one chart you can get granular with filters, and in another you can look at broad impact.
For example, let’s say you include a data visualization to look at your top performing posts across networks. Your chart displays the top 10 posts for engagement, and you realize most of them are Instagram posts. You can add a widget for post analysis to dig into this finding, filtering down to view Instagram posts, sorted by engagement rate and post type. Now, you can see what post type (reel, post, story, etc.) drove the most engagements for your brand, so you have insights on what to replicate in your strategy.

This chart-level filtering lets you see different subsets of data all at once, without having to build dozens of additional reports. And, the customizations don’t stop at metrics. You can tailor reports to specific business units and different internal audiences, so your leadership team can see a different report view than your customer care team.
Annotations within My Reports make it easy for you to build in helpful context, too. Annotations lay the foundation for the story you want to tell with your reports. When tailoring your reports to a specific audience, like your executives, you can use annotations to call out the most important findings.
You can rename report components, like the titles and descriptions of charts and graphs you include, or add elements like executive summaries to make report views digestible for each audience. Changing the titles, descriptions and summaries of different components makes your reports’ impact easier to understand. No matter who sees your social reporting, they’ll see it in a format that resonates with their needs.
Custom reporting through My Reports is available with Sprout’s Premium Analytics, which can be added to any Sprout plan. If you haven’t tried Sprout’s social media reporting options yet, request a personalized demo to get hands-on experience.
To give you some ideas, let’s look at some stand-out ways Sprout customers use custom reports.
3 Sprout custom reporting examples that tell a richer story about social’s impact
Some of the most important questions about social’s impact are often the most difficult to answer. What’s the ROI of our efforts? What did this influencer campaign do for us? How do people feel about our content?
Social marketers are finding creative ways to connect their social efforts to business impact through data storytelling. Here are three stand-out ways we’ve seen customers enhance their social media reporting to answer tough questions with Sprout’s custom reporting options.
In-depth campaign performance reporting
Creator and content campaigns are as crucial as they are notoriously hard to report on. According to a Q3 2023 Sprout Pulse Survey, 47% of respondents said their main challenge when implementing influencer marketing was measuring campaign effectiveness.

Custom reports bring clarity to this common challenge, and make it easier to confidently understand on your campaigns and influencer partnerships. They bring all of the KPIs into one streamlined report to tell a wider ROI story about your campaign.
With My Reports you can use annotations to share a recap of your campaign performance and goals within your report. Pair that with visualizations and widgets that highlight Tag performance and top posts across networks, and you can see what influencer posts drive the most impact. Filtering specific charts by content type, engagement or post clicks help you get even more details on what influencer content resonates with your audience.
One stand-out Sprout customer in the travel and meeting planning industry uses a custom campaign report to understand campaign performance and share it with external stakeholders. Their key to success is including widgets that provide a holistic view of their influencer campaigns. The Tag Performance Widget enables them to show data from the campaign-specific posts.
They also include social listening widgets featuring a topic summary, listening engagement and potential impressions. This enables them to show stakeholders how their influencer campaign impacted related conversations and engagements in the wider social space. Here’s what a general version of those two widgets looks like:

Beyond helping their social team make strategic partnership decisions, this report also helps them connect influencer campaigns to other business functions, sharing their custom campaign report with other teams to tell an easy-to-understand ROI.
There are endless ways to mix and match widgets to highlight social data in action. And various combinations have enabled customers to report on campaigns in different ways, to different stakeholders. One Sprout customer creates custom reports to highlight their end-of-year campaign success. Another uses theirs to share biweekly brand partnership reports across dozens of corporate partners. Combine different widgets, like listening, tag and post performance widgets to capture the full scope of your campaigns.
Tailored benchmarking and quarterly reports
Quarterly audits and benchmarking reports are two halves of one holistic story about your social strategy and overall brand health. When combined, they empower smarter decision-making by giving your strategy context against your competitors.
But the level of detail these reports carry may be overwhelming for a busy C-suite. And given that 57% of marketers share social media metrics with executives weekly or monthly, according to our Index, creating focused reports is crucial.

A Sprout customer in the SAAS industry used custom reporting to answer their C-suite’s biggest questions about Instagram, while still serving their team’s needs.
While Sprout offers a pre-built Instagram competitive report, this customer wanted to create two competitive intelligence reports: a weekly one for their team to track trends and competitor engagement surges. And a monthly C-suite report laser-focused on top-level competitive intelligence.
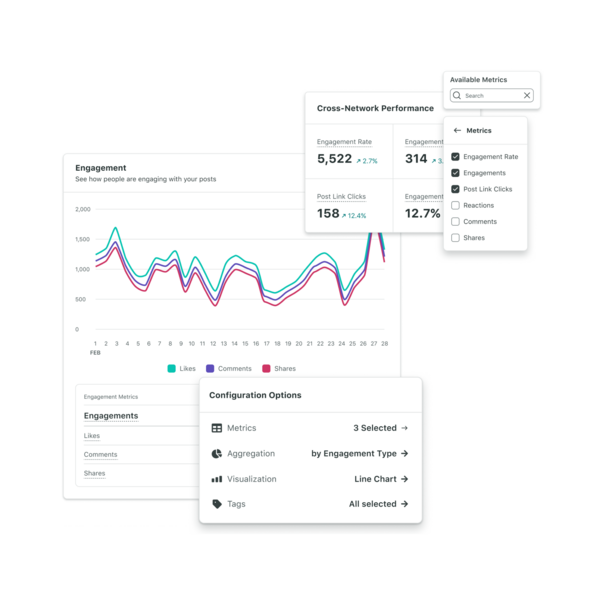
Their monthly report told their C-suite about how their Instagram compared to their competitors—without getting bogged down by in-the-weeds data. While the weekly report helps them stay on-trend and on-pace with platform-specific widgets that track trends. Here’s an example of what similar cross-network widgets look like:

With Sprout’s custom report builder, streamline or combine your larger audits and benchmarking reports—include cross-channel performance, competitive listening, customer care data and more for a 360-degree view of your strategy.
Pro tip: Create custom reports to hone in on the insights that matter most—for your team, or for other stakeholders—to get higher-impact insights from a lower lift. Tap into text widgets to give your data context with a SWOT analysis, and to prove ROI. Or, take this a step further by creating a custom report that serves as a social media dashboard your team and others can use to regularly enrich strategic business decisions.
A holistic view of organic vs. paid performance
According to a Q1 2023 Sprout Pulse Survey, marketers rank organic and paid social as their two most valuable social tactics—with organic out-ranking paid. Organic and paid social strategies go hand-in-hand, and reporting on them side-by-side can provide a holistic view to inform strategic decisions across your strategy.
The Paid vs. Organic Network Summary widget in the Premium Analytics Report Builder enables you to compare organic and paid content in custom reports across your Facebook, Instagram and LinkedIn profiles—no extra work needed from your team.

If you want a more channel-by-channel view of your paid performance, there are widgets by network available, too. Sprout’s paid reporting options enable you to easily evaluate the success of paid social campaigns executed through Facebook, Instagram, LinkedIn and X (formerly known as Twitter). As well as widgets that show the performance of your owned organic content.
Use custom reporting to uncover and share the focused social insights that matter
You and your team are no strangers to reporting on social data. But social media has grown up—and reporting must evolve with it.
To uncover and share deeper insights, you need to create more sophisticated reports for your team, leadership and beyond.
Drill down on the insights that matter most to your social and business strategy faster, so you can focus on making improvements—not digging through data. Request a personalized demo of Sprout with Premium Analytics to see how custom reports simplify answering the tough and important questions for your business.

Share