Features / Real-time media monitoring
Real-time media monitoring across web and social platforms
A story can break on social long before it reaches a headline. NewsWhip's enhanced Timeline gives you a complete view of how narratives emerge, gain momentum and travel across platforms.
Request a demo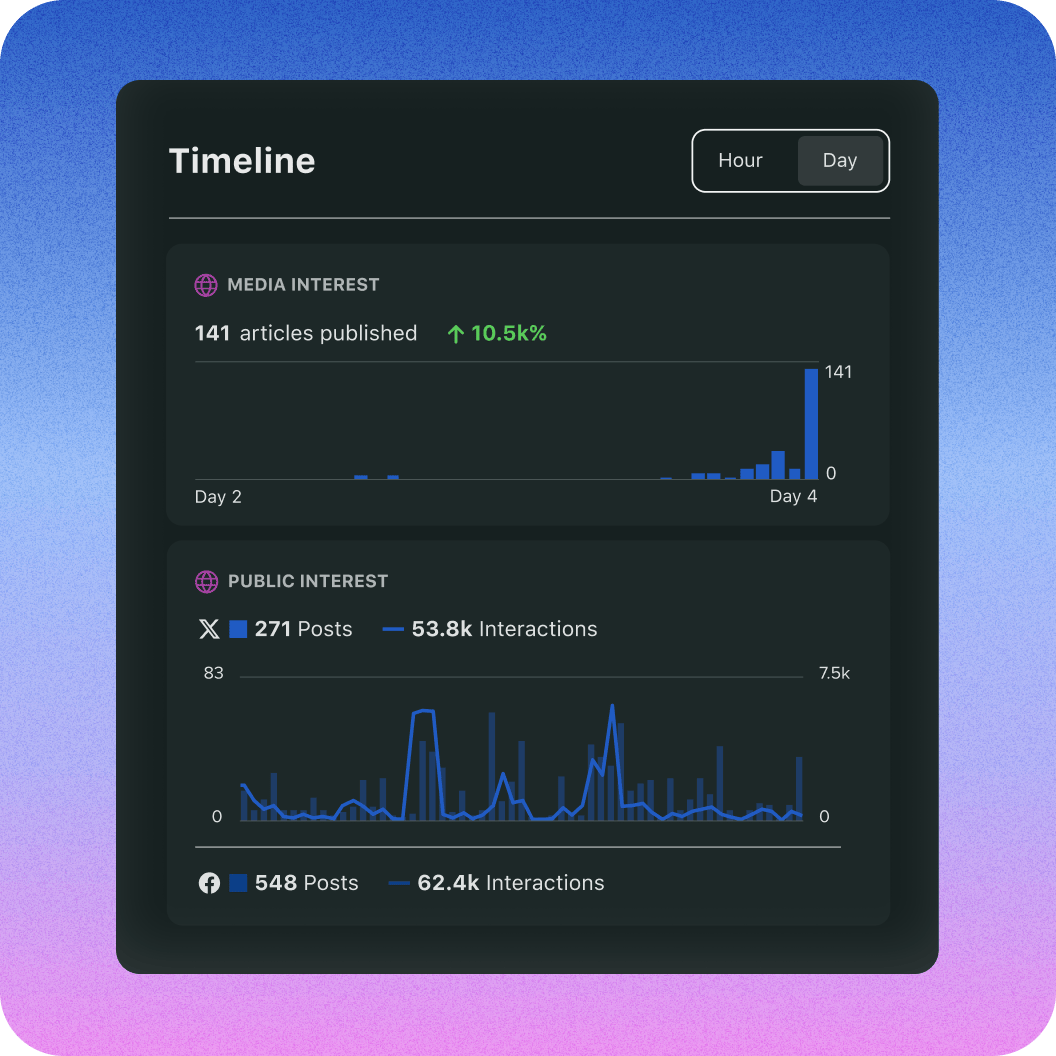
Real-time media monitoring built for fast-moving stories
A crisis rarely announces itself. It starts as a ripple: a thread on Reddit, a spike on X, a surge of engagement no one has spotted yet. Timeline tracks story movement across TikTok, Facebook, Instagram, Reddit, X and the web from the moment it starts.
1
See how stories spread between platforms
Track a narrative from its origin—whether that's X, Reddit or a breaking web article—through every channel it amplifies across. The blind spots where stories first gain traction become visible before they escalate.
2
Measure public interest as it rises and falls
Timeline visualizes social engagement hour by hour and day by day, giving you a live read of how public attention moves through any crisis, event or trend as it is still unfolding.
3
Compare media output with public reaction
See media output graphed alongside public engagement levels in one view, so you know whether editorial coverage is driving audience attention—or the other way around.
Compare what is happening now with what came before
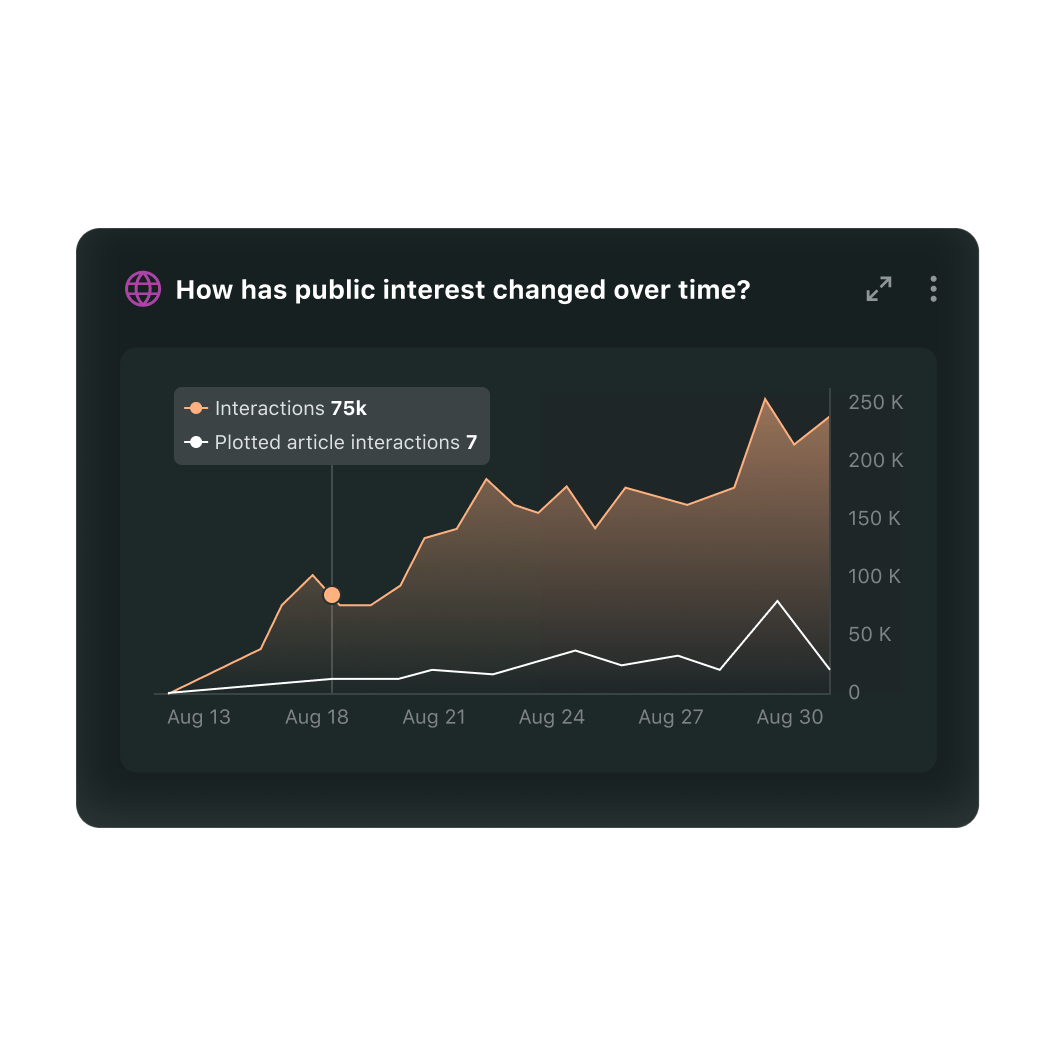
Timeline's Previous Period overlays a comparison line across your search window, so you can see at a glance whether interest is building or declining.
- Overlay a dotted comparison line for any equivalent prior period
- View the percentage change in public or media interest instantly
- Anchor real-time decisions in historical context without leaving the platform
Benchmark events side by side
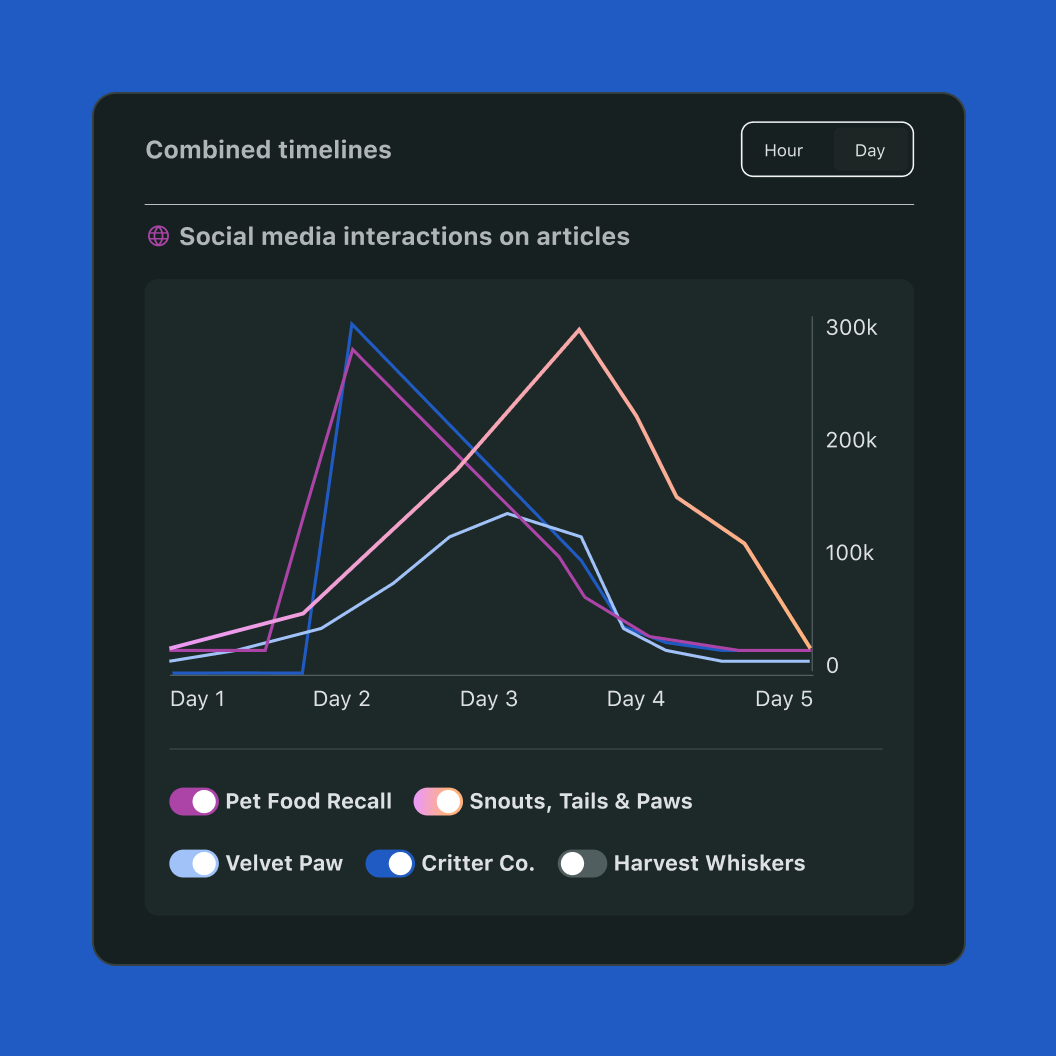
Timeline Compare plots two or more searches simultaneously on a single timeline. Teams use it to see how a live crisis compares to a past incident.
- Visualize any two events or topics on one timeline
- Identify which narrative is gaining more traction across platforms
- Make decisions grounded in relative context, not isolated data points
Mark the moments your team needs to see
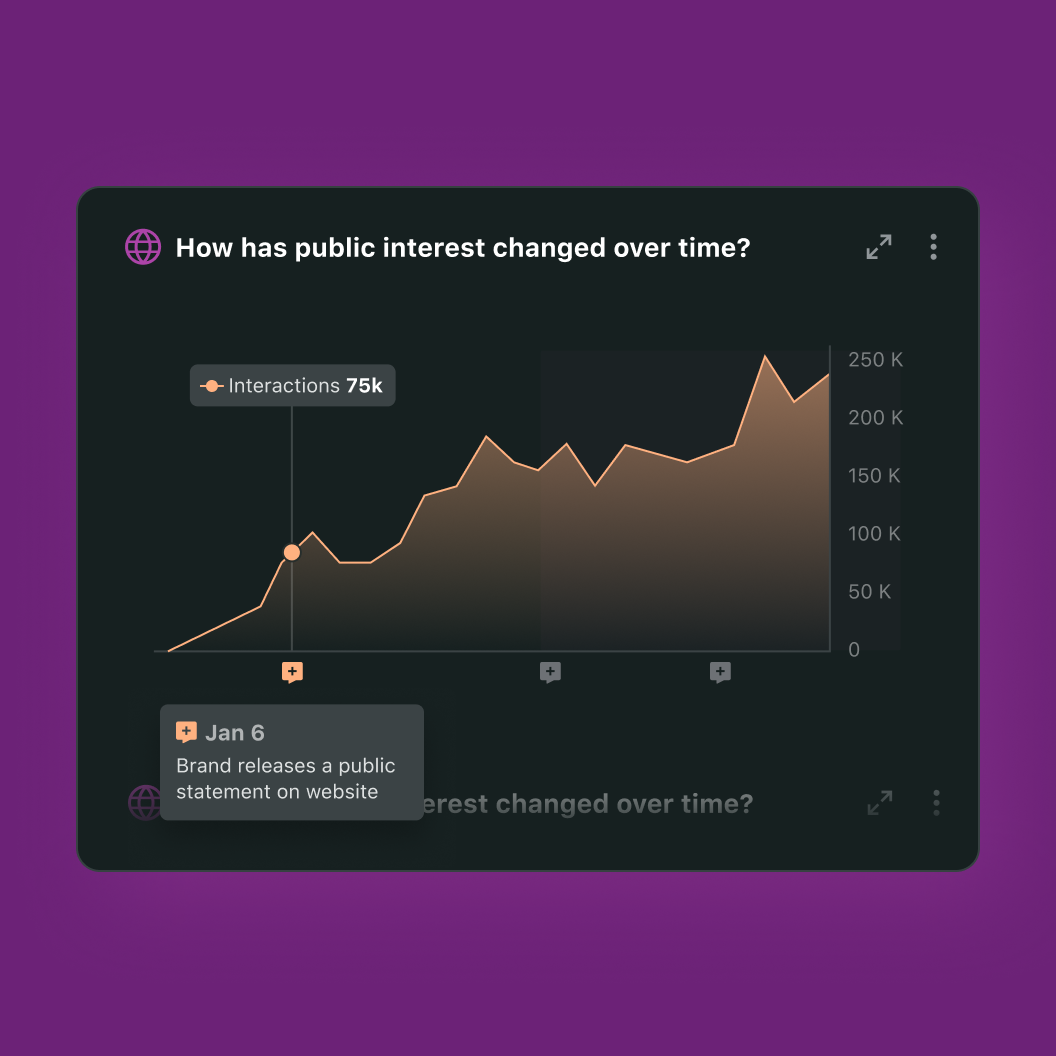
Timeline Notes lets you add annotations directly onto public and media interest graphs—so a viral post or a policy shift is visible to every teammate
- Annotate public and media interest graphs with key events in-platform
- Notes persist with saved searches and appear across shared dashboards
- Surface the 'why' behind every spike without a separate document
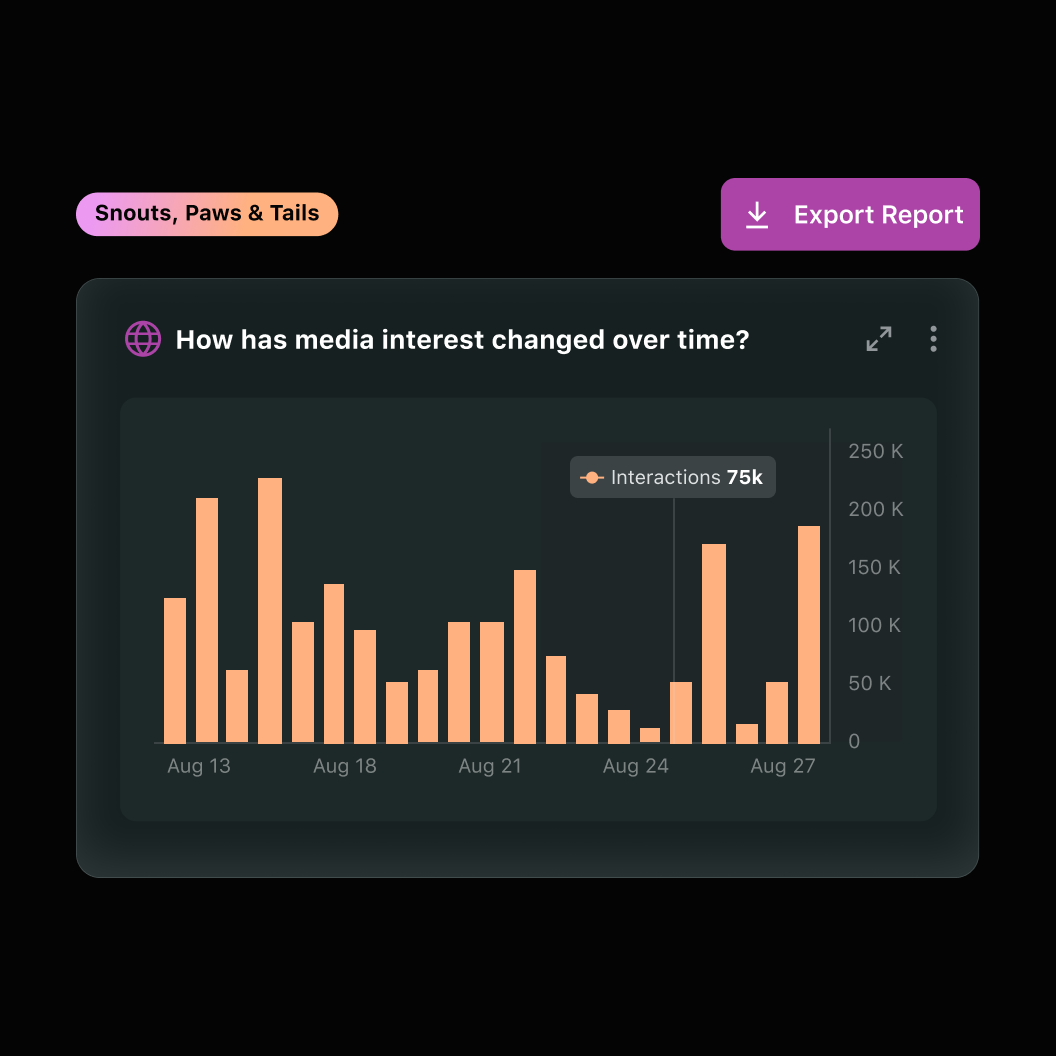
Share the insight without slowing down
Three export paths get your intelligence to the right person in the right format.
- Export public and media interest charts together as a single PNG for fast stakeholder updates
- Download the underlying timeline data and Timeline Notes as a CSV for analysis in Excel, Numbers or Sheets
- Use Report Builder to turn dashboards into executive-level presentations in a few clicks
Remove blind spots from real-time media monitoring
Every fast-moving story has turning points your team can't afford to miss. NewsWhip's Timeline puts those moments in plain view—across every platform, at every stage of a story's life.