Facebook analytics for small business success

Written by Mahnoor Sheikh
Published on July 3, 2026
Reading time 12 minutes
Table of Contents
For small businesses, Facebook isn’t just a social network—it’s a critical growth engine. Over two billion people use it daily to find local companies, read reviews and ask questions. But without analytics, it’s hard to know if any of that activity is helping your business.
So, which analytics should you track? If you’re only counting likes, followers and reactions, you’re doing it wrong. These metrics might be the most obvious, but they rarely prove whether your Facebook marketing strategy is producing tangible return on investment (ROI).
Focusing on metrics that tie directly to business results helps your small business make smarter, data-backed decisions. This guide explains which metrics to keep an eye on, and how to easily access and interpret them without drowning in dashboards.
Why Facebook analytics matter for SMBs
Facebook analytics show you how people interact with your business across the platform. You can see exactly which content gets attention, what drives traffic or clicks, what customers are saying about your products and what questions they’re asking.
Knowing this data helps you create content that’s proven to work, instead of guessing what your audience wants. This matters for small businesses because of two reasons:
- Limited resources. SMBs can’t afford to shoot in the dark. They need to be mindful of where they’re spending their time and money.
- Limited organic reach. With interest-based feeds and heavy competition, only a fraction of your followers see your posts. The rest is up to the Facebook algorithm, unless you pay to boost your content.
Analytics help you understand which formats, topics and publishing times give you the best chance of reaching the right audience and moving them to action.
Here are three specific ways Facebook analytics help SMBs:
Linking engagement directly to revenue
For SMBs, Facebook engagement only matters if it leads to a concrete business outcome, like sales or demo bookings. One way to connect user activity to revenue is using trackable links.
Unlike Instagram, Facebook offers plenty of opportunities to share clickable URLs:
- Feed and Group posts
- Link stickers on your Facebook Stories
- Page links (e.g., your website, location, other social accounts)
- Your main action button (e.g. Sign Up, Book Now, Call Now)
- Direct conversations via Messenger
- Event registration or ticket links
Use shortened, trackable links to easily monitor the clicks coming from your Facebook page.
Tracking your links helps you understand exactly what happens after someone interacts with your content. Did they click through to your website? Call your business or get directions to your local storefront?
For example, a boutique jewelry store could post about a new collection and share a custom short link directly to the product page. By measuring those specific clicks, they see exactly how many people moved from Facebook to their online store. Instead of just guessing based on a high view count, they can confidently say “this post sent 50 shoppers straight to our new collection.”
This kind of insight helps your business isolate the exact creative formats, messaging styles or promotional offers that drive real traffic so you can replicate what works.
Separating paid performance from organic reach
Facebook analytics help you keep paid and organic performance in separate buckets. Organic reach is the audience you earn for free, while paid reach is the audience you win through boosted posts and ads.
If you lump them both into one “reach” number, you’ll have no idea what’s actually working. Read apart, they answer two different questions:
- Organic reach shows how well your post performs without a cent behind it. High organic numbers mean the content genuinely resonates with your audience. They find it useful or interesting, which means the algorithm boosts it naturally.
- Paid reach shows how much attention your targeting, creative and budget are getting on your posts. Comparing paid reach to the number of clicks on your ads also tells you whether that attention is converting into action.
Smart brands use this data to spend their ad budget wisely.
For example, a post that earns strong engagement on its own is a proven candidate to boost. You already have evidence that people want it. Similarly, a post that only gets seen when you pay for it needs a second look before you throw another dollar at it.
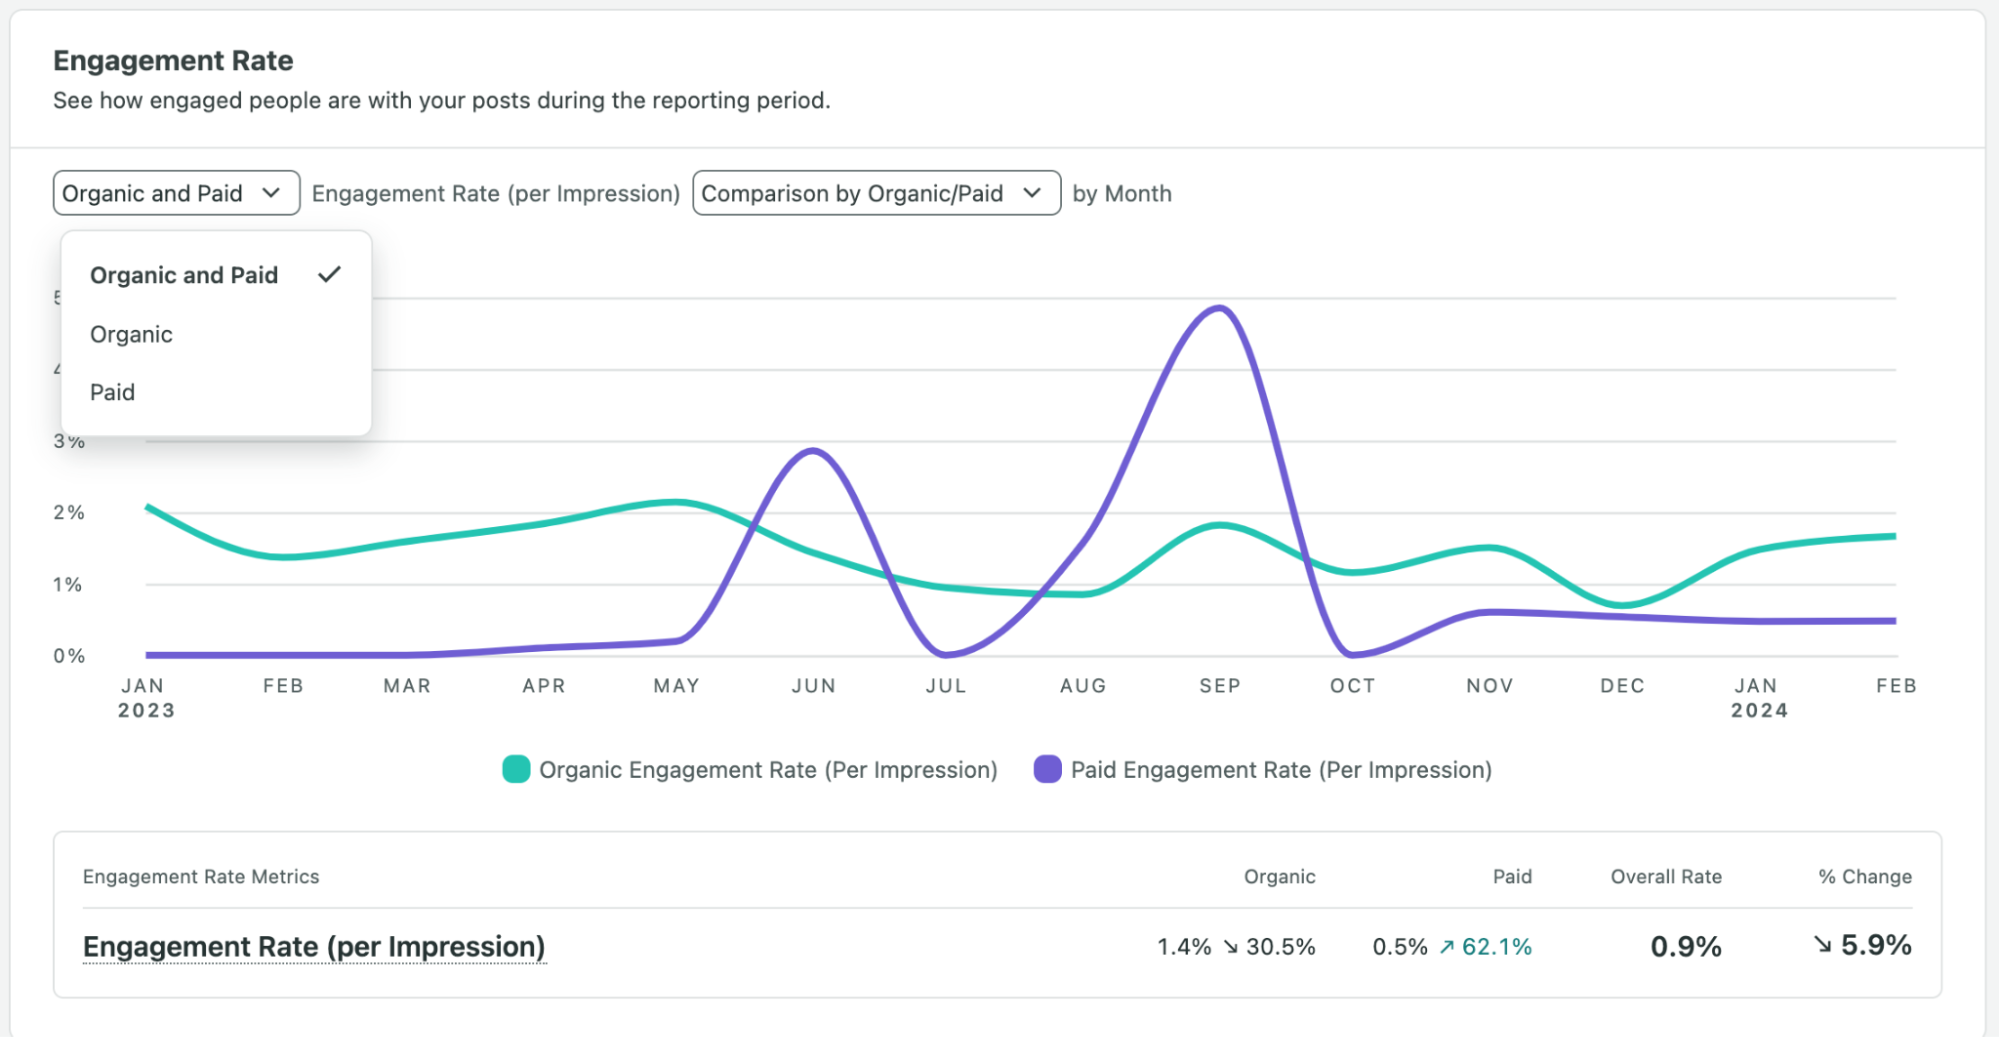
If you’re using Sprout Social to track your Facebook analytics, you can measure organic and paid engagement in one view, once you connect your paid account:
Improving your Facebook content strategy
Analytics help your small business build a stronger strategy over time. Instead of relying on your gut to plan content, you can use historical performance to decide what goes on your calendar.
Look at which formats, topics, captions and publishing times consistently perform well, then use that to tweak future content.
For example, pull up data from the last 30, 60 or 90 days. You might find insights like:
- Short customer story videos drive more comments than product-only posts
- Educational posts get fewer likes but more link clicks
- Event reminders perform best two days before the event, not the morning of
These patterns help you make better publishing decisions. You can create more of what works, reduce content that doesn’t support your goals and test new ideas with a sharper baseline.
Key Facebook metrics that impact small businesses
Facebook metrics for small business fall into several different categories:
- Reach and views: How many people saw your content, and how often.
- Engagement: Link clicks, shares, comments and reactions.
- Follower growth: New follows and the posts that triggered them.
- Audience demographics: Who your followers are.
However, not every metric carries equal weight. A simple Page like or a thumbs-up on your post might look like you’re getting popular, but it doesn’t reveal much about buying intent, content quality or brand health.
This is what small businesses should be looking at instead:
1. Link clicks and website referral traffic
If someone clicks on your link, it means they left their feed to take the next step, such as visiting your website or booking an appointment. Cross-check that data with referral traffic in your website analytics to see how many of those clicks stayed or bounced.
It’s also important to look at link clicks alongside comments and shares. They’re proof that your content connected with your target audience. These metrics also carry more algorithmic weight than passive likes because they require more effort from the user.
2. Video views and watch time
Short-form video (i.e. Reels) is the most popular content format from brands on Facebook, according to Sprout’s research. If video is part of your Facebook strategy (and it should be), here are two metrics that help you measure its performance on the platform:
- Views count how many people your video reached and whether it stopped the scroll in the feed.
- Average watch time shows how long they stayed. In other words, how well did your content hold attention after the opening?
Track them together to understand true video performance and how you can improve it further. For example:
- High views, low watch time: Your hook grabs people, but the rest loses them. Get to the point faster or tighten the core messaging.
- Low views, high watch time: The content is strong, but not enough people are pressing play. Rework your first few seconds or the thumbnail to draw attention.
- High views and high watch time: You’ve got a winner! Make more similar videos to replicate the success.
Note: Facebook deprecated the older “3-second video view” metric in June 2026, so it’s best not to build your reporting around it. Focus on views and average watch time instead, which give you a more accurate picture of both reach and attention on the platform.
3. Audience demographics and peak activity hours
Knowing who your Facebook audience is (and when they’re paying attention) keeps you from posting into a void. Here are two key audience metrics to look at:
- Demographics: Facebook breaks your audience down by age, gender and location, so compare that against your actual customer base. If most of your buyers are homeowners aged 35 to 60 within a few miles, but your followers skew 18-to-24 and spread across the country, your content is pulling the wrong crowd.
- Peak activity hours: Open “Active times” in Meta Business Suite to see the exact days and hours your followers are on Facebook, then schedule your posts to publish in those windows to get maximum engagement.
You want to make sure you’re creating content that’s attracting the right people. You might have great engagement rates, but if most of that engagement comes from people outside your service area or target market, it won’t help your small business grow.
And if you don’t publish during active hours, you might lose out on potential engagement just because your followers were busy or sleeping when your content went live.
4. Follower growth metrics
Follower count is one of those metrics that only look good on the surface. What matters more is the quality of your followers. Are they just passive users who occasionally like your posts or high-intent community members who regularly engage and buy from you?
Here’s what SMBs need to look at to understand true follower growth:
- Follower growth rate: This percentage shows how quickly your audience is growing over a specific time period. You can track follower growth in Facebook’s native analytics or a third-party social media analytics platform like Sprout.
- Spikes in follower acquisition: These are sudden increases in followers. You can usually spot them in the follower growth chart in your Facebook analytics tool. Trace spikes back to specific content formats to see what caused them.
To trace spikes manually, compare your follower growth chart in Meta Business Suite or Page Insights with your recent posts, Reels, ads and campaigns. Look at the dates when your followers increased more than usual, then check what went live around that time.
The downside is that manual checking involves a lot of tab-hopping between insights, ads and your content calendar.
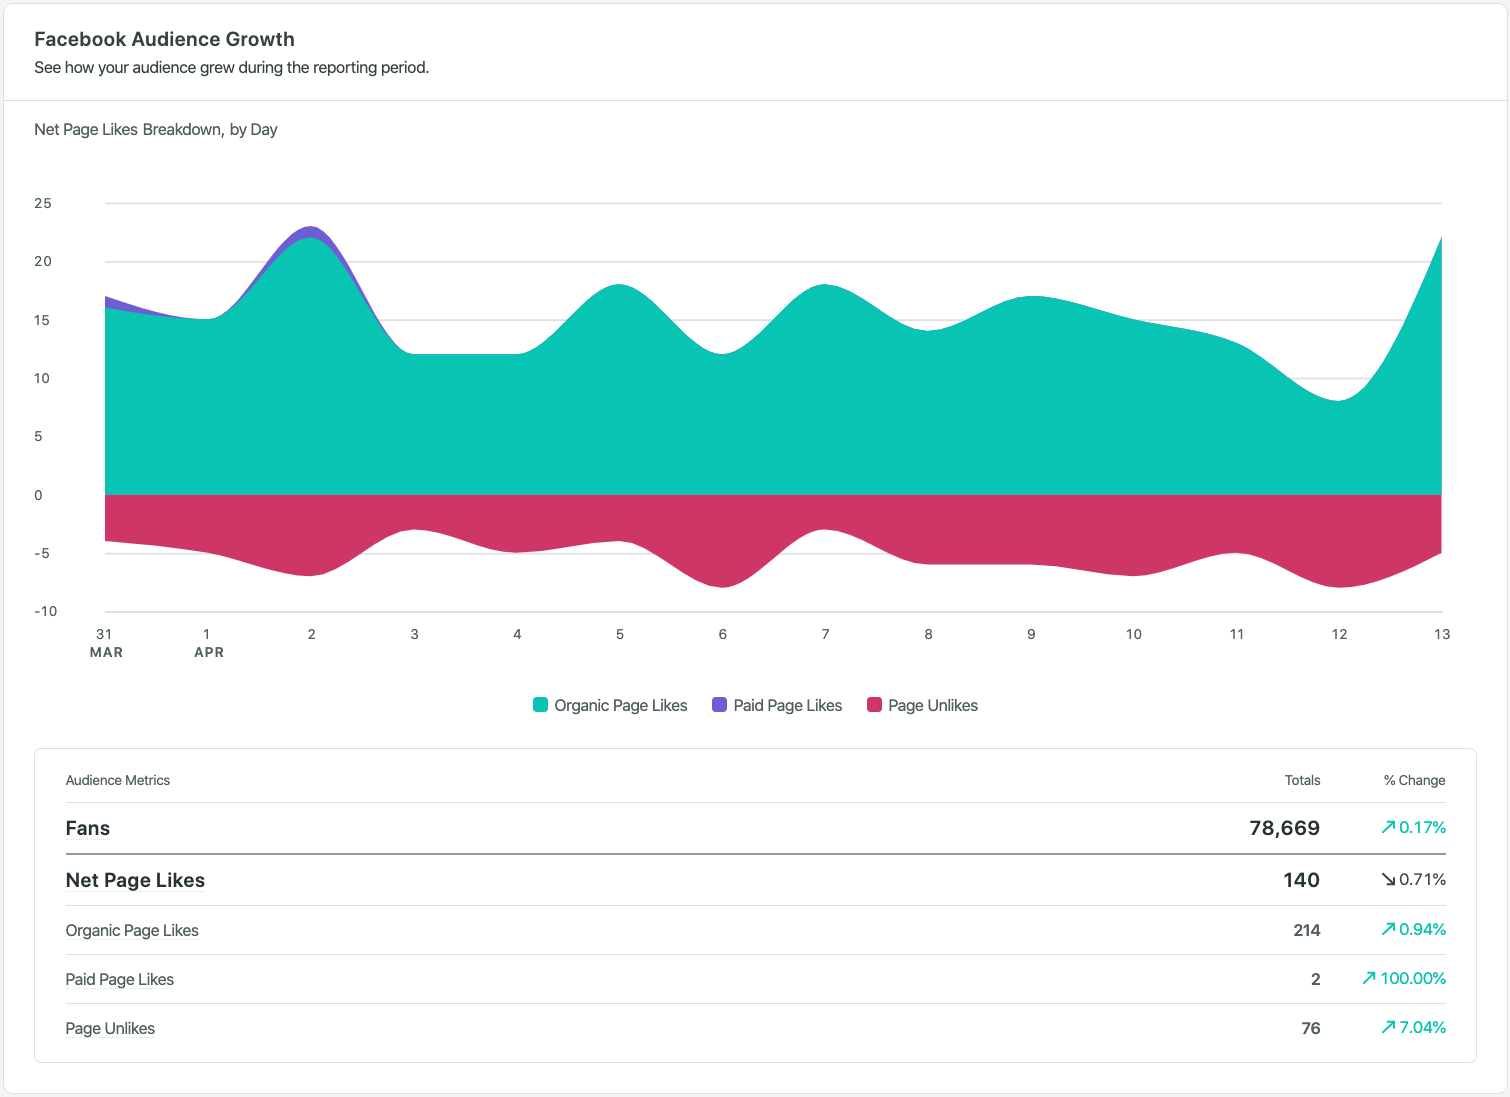
A platform like Sprout Social makes it easier by showing you audience growth, post performance and publishing data in one place.
Start by identifying audience growth trends in the Facebook Pages report.
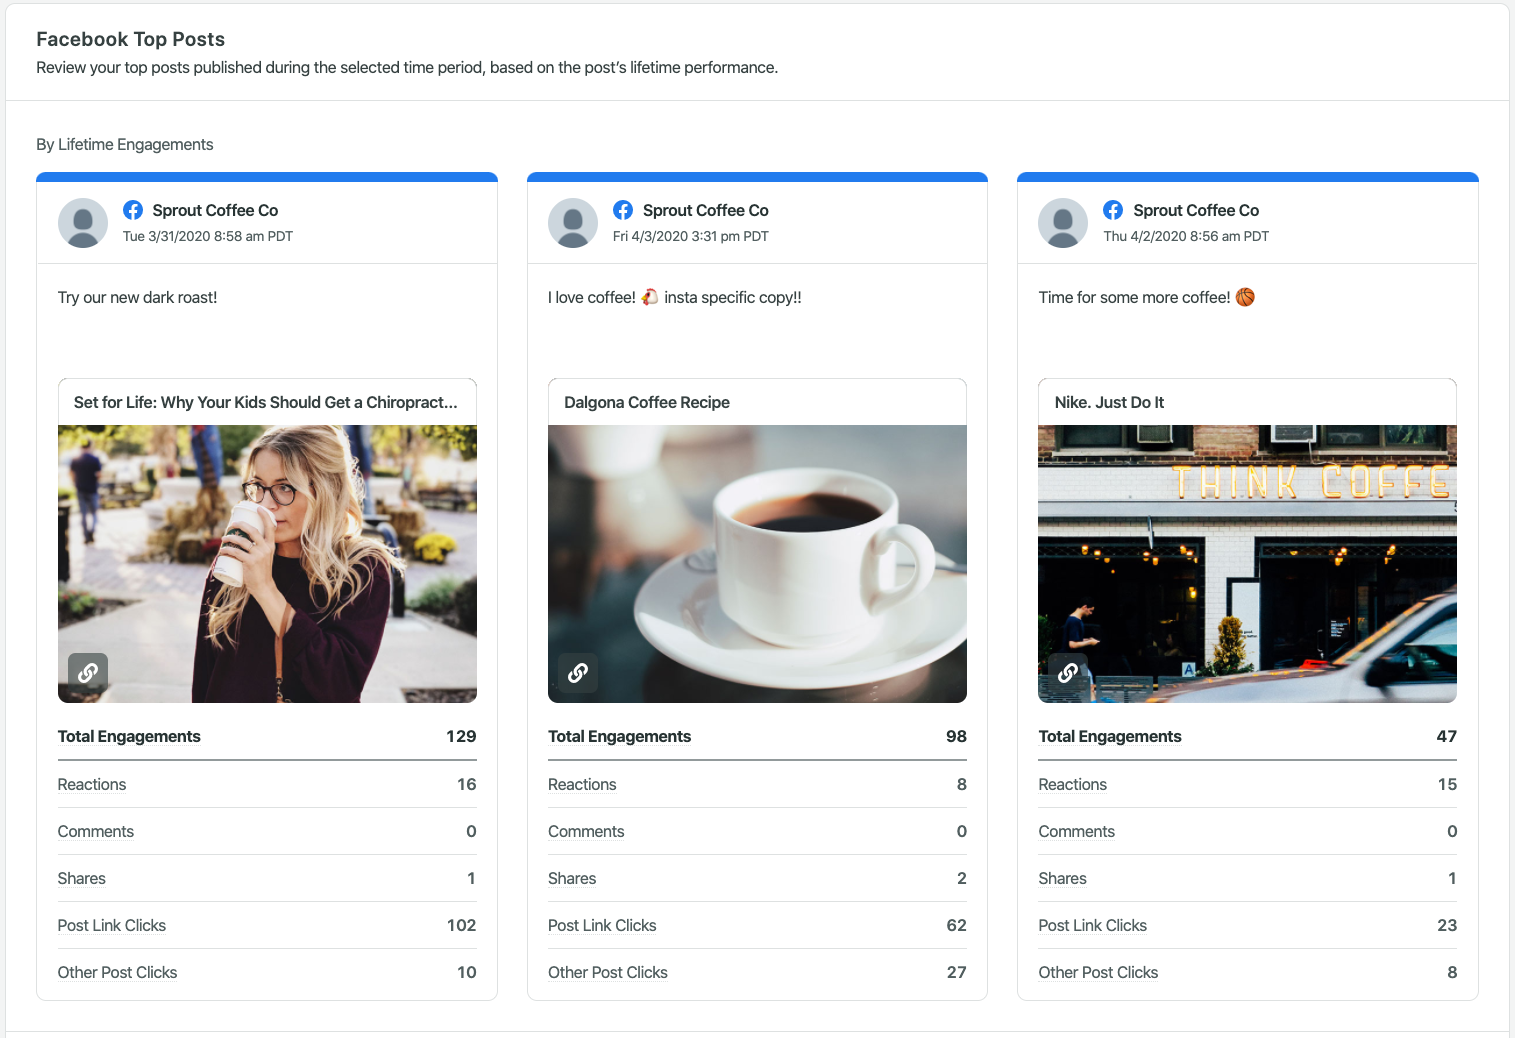
Then, view all the posts that went live during that time period and compare them side-by-side to understand performance trends—all in the same report.
5. Page recommendations and customer review sentiment
For most small businesses, Facebook acts as a digital storefront and local directory. Your Page is a public listing where customers go to check hours, location, photos and, most importantly, reviews and recommendations. While you can monitor reviews natively through Facebook, a social media management platform like Sprout Social lets you track and respond to reviews from Facebook, Google, Yelp, TripAdvisor and more in one place. Review management and reporting are available on Sprout’s Standard plan and above.
For local brands, social proof is a critical metric to track. You need to know what customers are saying online and how they feel about your products and services, as it’s one of the biggest influences on your reputation and sales. Specifically, look at:
- Volume and trajectory: How many recommendations are you earning? Are they steadily increasing? If the number is stalling, it’s to work on your brand awareness, improve customer satisfaction or proactively ask customers to leave reviews and recommendations.
- Underlying sentiment and themes: What are the actual words inside the reviews? Are people happy with your business? Are they especially fond of a particular feature? Is there a recurring concern with your service?
Taking the time to read reviews and respond to them timely can help you improve your business, save your reputation and even build loyalty in the long term.
How to access and interpret your Facebook analytics
There are three ways to access your Facebook analytics data:
- Meta Business Suite: The primary native dashboard for reach, views, engagement, audience and active times across Facebook (and Instagram).
- Professional dashboard and Page insights: In-app, post-by-post performance for individual videos and posts on Facebook.
- Third-party platforms: Tools like Sprout Social that gather analytics, reporting and publishing in one place and let you compare Facebook against other channels.
Here’s what your analytics look like in Facebook’s native professional dashboard:
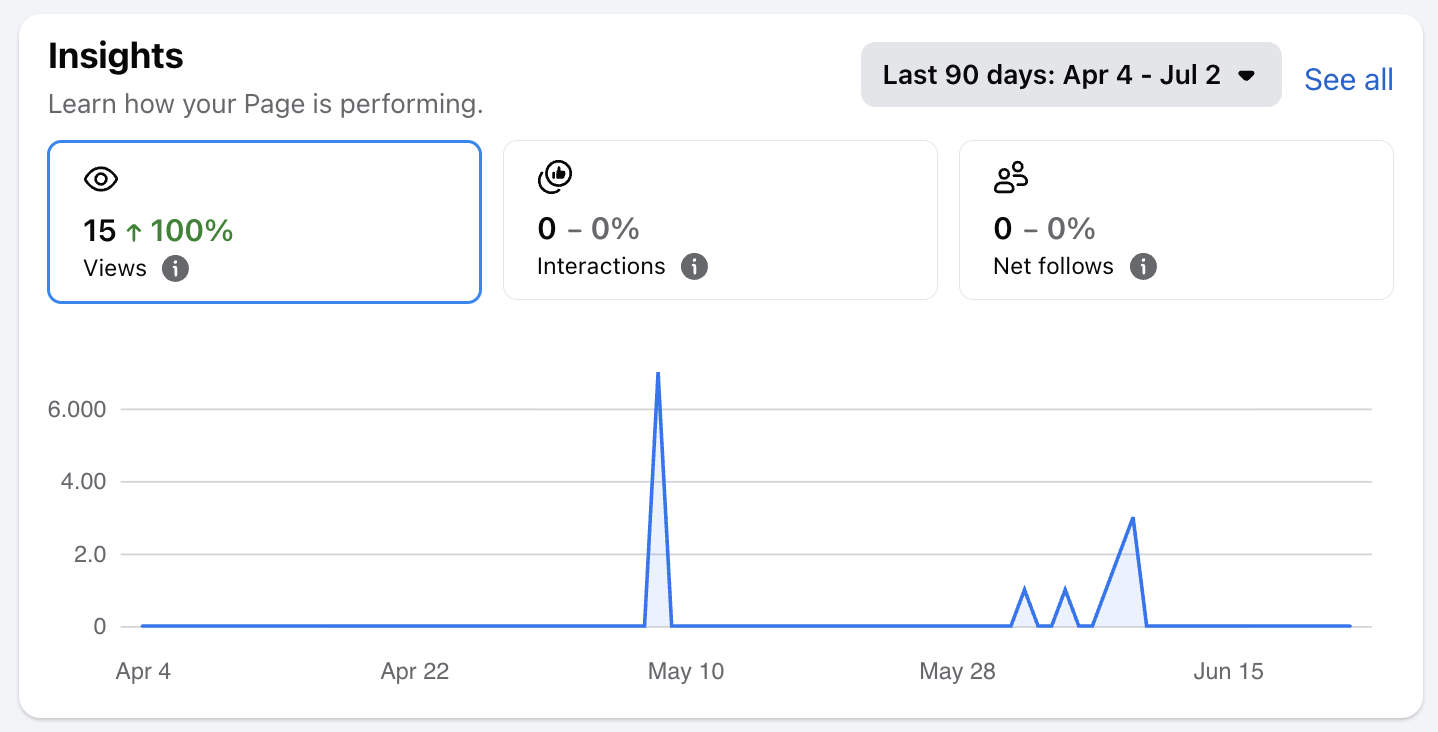
For most teams doing Facebook marketing for small business, finding the numbers is easy. Interpreting them without burning an afternoon is where they get stuck, because the data is scattered across multiple dashboards. That’s why most teams eventually move from native tools to third-party platforms with unified views.
Let’s talk about the challenges of native analytics and when switching to a third-party platform is a better idea:
The limitations of native Facebook analytics tools
For many SMBs, native tools are a good starting point, especially if you’re managing one or two Pages and need a basic view of content performance, audience and engagement.
However, as your business grows, so does the amount of data you need to track. Before you know it, you’re constantly switching between Meta Business Suite, Ads Manager, Page reviews, Messenger, website analytics and spreadsheets.
You’re also spending more time than you should taking screenshots, exporting numbers, calculating month-over-month changes and trying to explain what the data means. For lean teams, time is money, and this approach is simply too expensive.
Native tools can also make it harder to compare Facebook performance against other social channels. If you’re managing Facebook, Instagram, TikTok, LinkedIn or Pinterest at the same time, checking each platform separately can slow down your reporting process.
Knowing when to graduate to third-party software
Once reporting starts getting in the way of strategic marketing work, it’s time to upgrade your workflow from native tools to third-party software.
A social media management platform gives you a unified view of performance. Instead of looking at Facebook insights for small business in isolation, you can see how it fits into your larger social strategy.
Need a checklist? If you’re:
- Spending more time gathering data than acting on it
- Regularly sharing reports with team members, leadership or partners
- Relying on memory instead of concrete historical data
- Running Facebook alongside Instagram, TikTok or LinkedIn
It’s time to make the switch. A dedicated analytics platform fixes the fragmentation problem. Instead of wasting time finding metrics, you can focus on strategic tasks like creating great content and engaging thoughtfully with your audience.
Using Sprout Social to elevate your Facebook analytics
Sprout Social brings social media analytics and publishing into one workflow. Instead of jumping between tools, you can track Facebook performance and act on those insights from the same platform.
Wondering if it fits your small business budget? At $79 per seat/month, Sprout Social Essentials is built for lean but ambitious teams that would rather spend their week on strategy than on admin. Try Essentials free for 30 days, no credit card required.
Let’s take a closer look at how exactly SMBs can benefit from Sprout Essentials:
Automate your Facebook performance reports
Instead of manual screenshotting and data entry, you can automatically generate different types of reports in Sprout with a few clicks.
- Facebook Pages report: A Facebook-specific view of reach, engagement, video views, follower growth, audience demographics and paid vs. organic activity.
- Post performance report: A cross-channel, post-level breakdown of your content performance.
- Profile performance report: A high-level read across every connected profile that lets you analyze your social media performance and growth at a glance, such as engagement rate (shown below).
These reports aren’t just compilations of numbers. They help you answer questions like:
- Which posts pulled the most engagement?
- Is our paid spend earning its keep against organic?
- Is Facebook contributing as much to our bottom line as other social platforms?
You can also share live reports with your team or a stakeholder, or export a copy. Either way, you’re out of the spreadsheet and back to executing on what the data says.
Scale your best-performing Facebook content
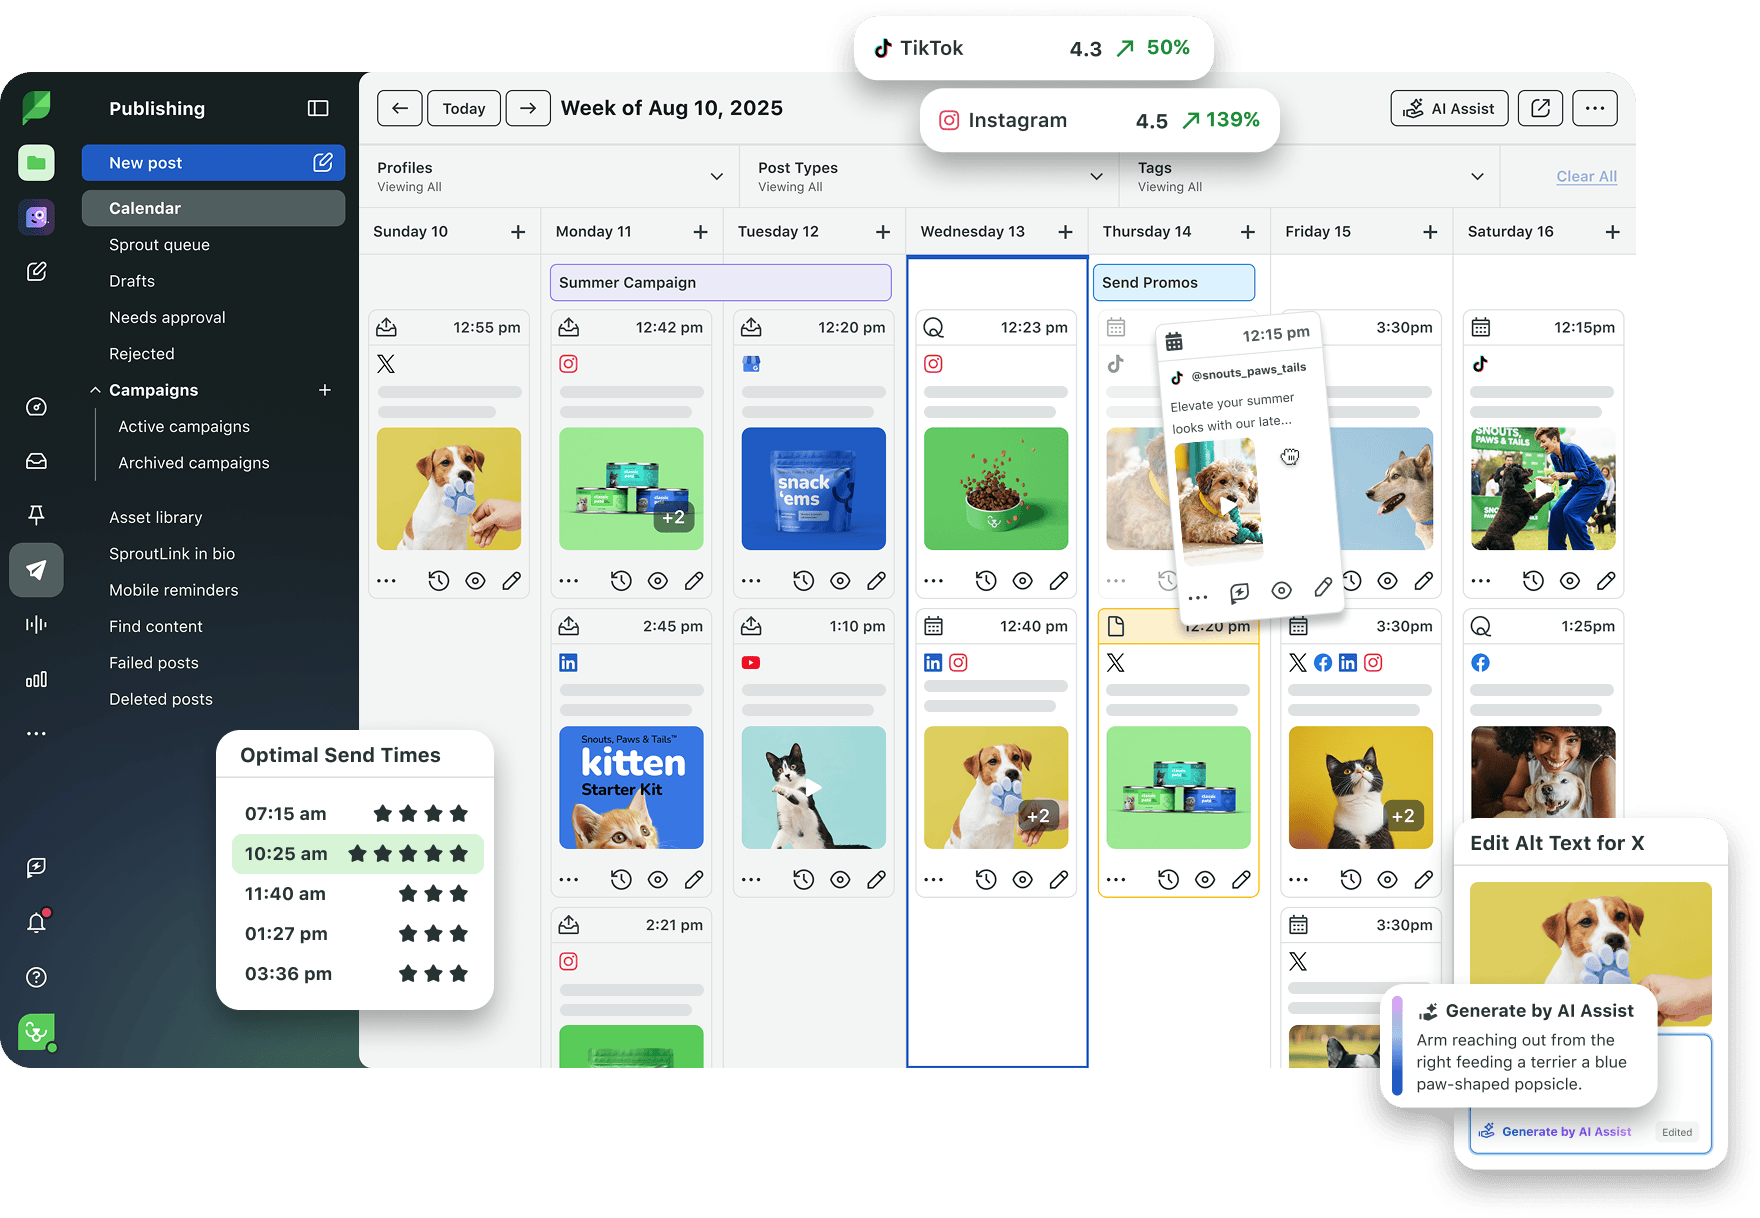
Once you know what works, your job is to make more of it without adding another tool to your stack. After you spot a winning format, Sprout helps you act on it right away with features like:
- A visual content calendar that shows your full Facebook publishing mix alongside your other channels at a glance.
- Advanced scheduling to plan videos, posts and photos in batches instead of planning or posting one at a time.
- ViralPost send-time optimization, which automatically publishes at the best times to post on Facebook for your business (i.e. when your audience is most active).
- A built-in image editor for quick tweaks and reusing approved creative without leaving the platform.
- Unlimited AI-generated alt text to make your images accessible without writing a description for every post by hand.
For example, a local pet supply store might notice that short educational videos about pet care consistently drive comments and clicks. The team decides to build a content series around it.
Using Sprout, they can:
- Find the data that proves those videos work
- Plan related posts in a shared content calendar
- Batch-create and schedule future videos
- Use optimal send times to publish during peak activity hours
- Track whether the new posts are performing well
- Compare results across Facebook and other channels
That’s the whole point of Facebook analytics for a small business: find what works, repeat it and stop guessing what to post tomorrow. Start your free Sprout Essentials trial today.
37 free social media strategy templates that will elevate your workflows
Published on December 5, 2025 Reading time 15 minutes

Share