How to use Instagram analytics to grow your small business

Written by Mahnoor Sheikh
Published on June 29, 2026
Reading time 10 minutes

Table of Contents
Summary
- Track metrics that drive revenue: Focus on high-intent actions like saves, shares, comments and trackable link clicks rather than vanity metrics like raw follower counts.
- Let data shape your strategy: Analyze past performance and audience growth spikes to identify exactly which content formats achieve your specific business goals.
- Upgrade your tracking tools: Move beyond manual native apps and use unified third-party platforms to automate reporting, centralize data and save your team valuable time.
Instagram analytics tell you how your posts perform and who your audience is. But small teams often chase the wrong numbers.
Likes and follower counts feel good, but they rarely tell you whether your Instagram marketing strategy is driving tangible return on investment (ROI).
You don’t need a statistics degree to understand what moves the needle. You need the right metrics and a system that turns them into action.
This guide breaks down which Instagram metrics matter most to small businesses, the best way to track them and how to interpret them to improve your Instagram strategy.
Why Instagram analytics matter for SMB
Instagram analytics show SMBs exactly what users are watching, saving and engaging with. Instead of “guessing what works”, you’re making data-backed decisions so your time and budget go toward formats that improve your bottom line.
Large brands can test campaigns and absorb a few weak posts along the way. But lean teams are dealing with limited resources they can’t afford to waste. For them, every piece of content has to move the business forward.
Analytics help small businesses achieve that goal in two ways.
Linking Instagram analytics directly to revenue
Engagement only matters to your business if you can connect it to a sale, a booking or a visit. This helps you tie social interactions to actual revenue. On Instagram, you can do that by tracking the links in your direct messages (DMs), Stories and bio.
- Instagram Stories let you drop a link sticker straight onto a post
- DMs let you send a link directly to an Instagram user
- Your link in bio is the permanent URL that lives on your profile
Make sure you’re using trackable URLs. Add UTM parameters to every link you share and your analytics will show you exactly which DM, Story or bio sent each visitor.
For example, a local beauty salon adds a link sticker to a Story showing a new facial treatment. The UTM tag traces 38 taps and nine new bookings straight back to the Story by Friday.
Sprout Social Essentials Tip: Use SproutLink to direct your Instagram audience to multiple landing pages from a single bio link. Then track and attribute traffic seamlessly through Sprout’s integrated Instagram analytics.
Leveraging Instagram analytics for strategic growth
Tracking Instagram insights for small business helps you make better decisions about what to post, who to target and where to spend your time.
The best place to start is historical performance. Look back at your top posts from the last 30, 60 or 90 days and identify the patterns behind them.
- Which formats performed best?
- Which posts drove follows, saves, shares, profile visits or website clicks?
- Which captions got people to comment?
- Which publishing times or days worked best?
Those patterns should shape your content calendar.
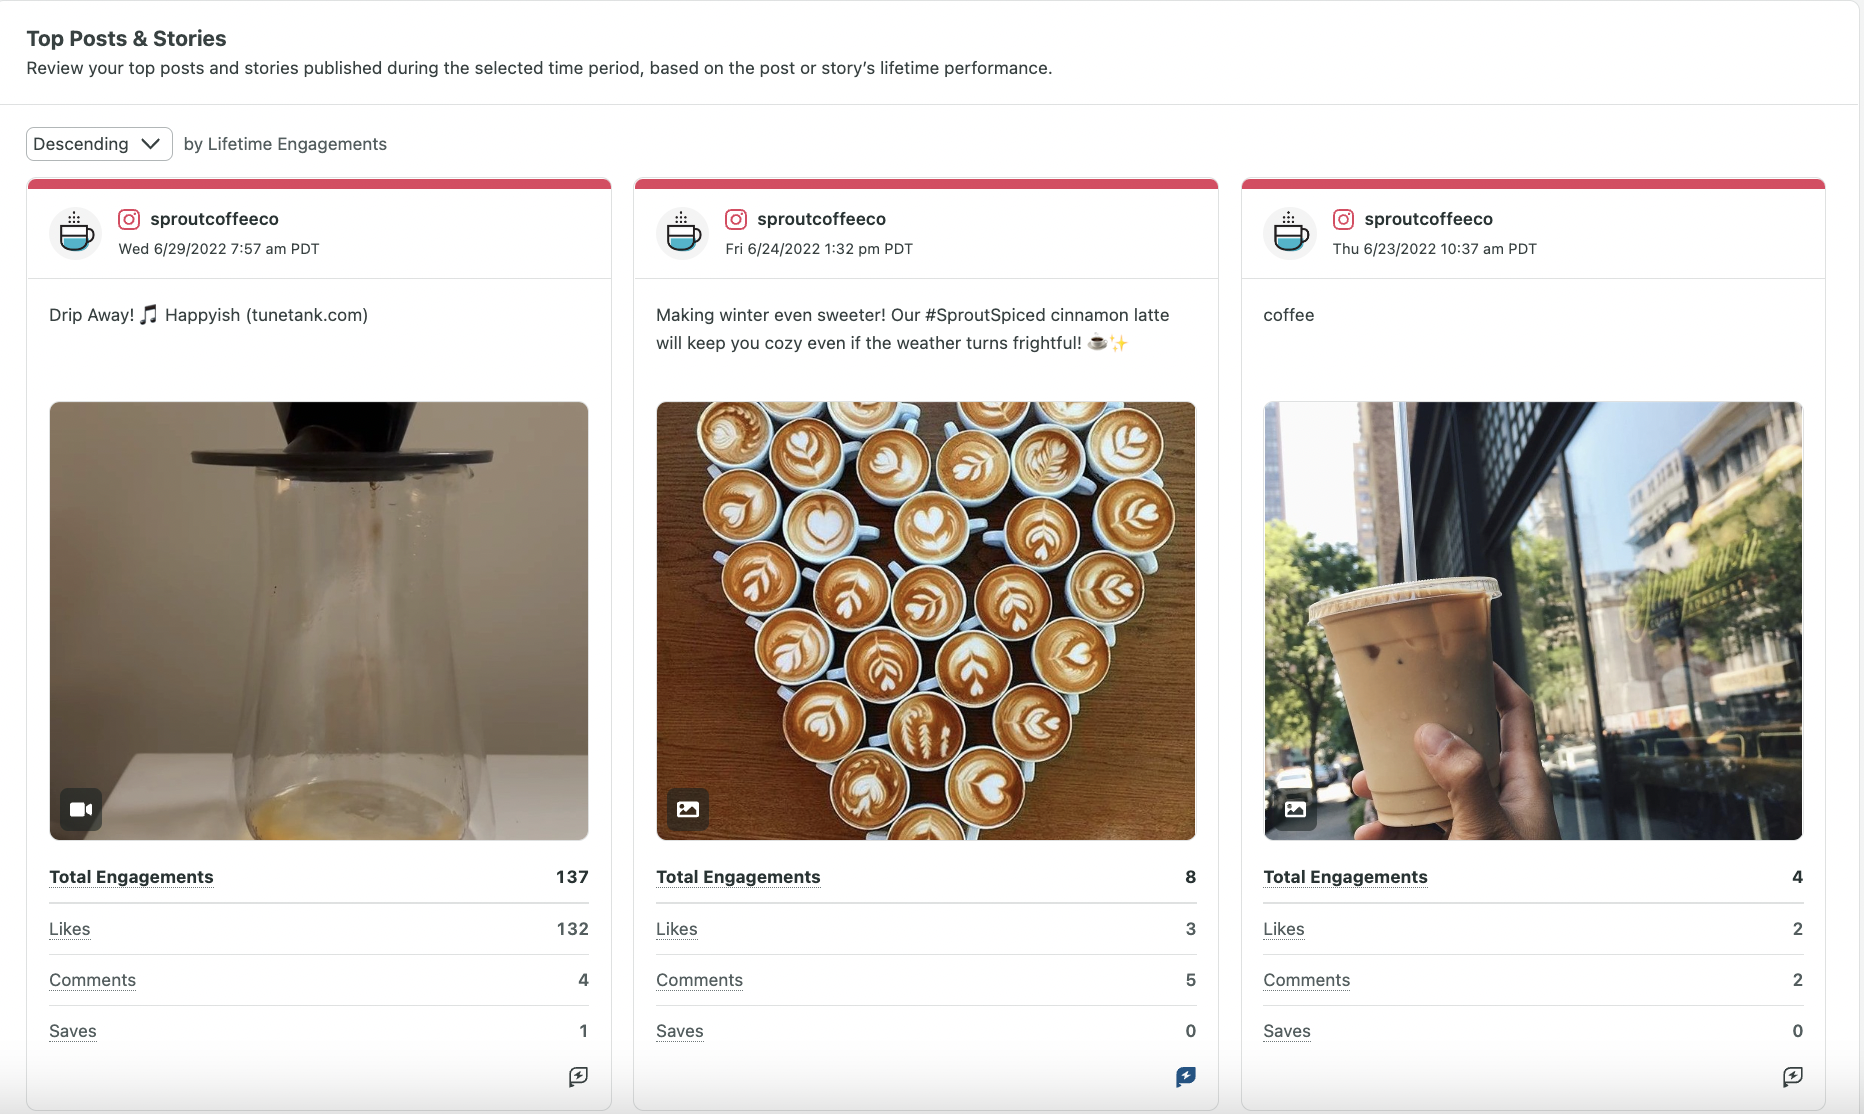
For example, a local coffee shop might notice that latte art Reels get the most reach, while “what’s new on the seasonal menu” carousels get the most saves and website clicks.
That tells the team how each format supports growth:
- Reels help new people discover the café
- Carousel posts help interested customers decide what to order or when to visit
The coffee shop can then double down on Reels or carousels depending on their business goal.
This is how Instagram analytics become strategic. Instead of just reporting on past performance, you’re using that data to adjust your publishing workflow and decide what to repeat, improve or stop doing.
Key Instagram metrics every small business must track
Instagram metrics for small business typically fall into several categories:
- Reach and impressions: How many people saw your content, and how often did it appear in feeds?
- Engagement: How many people interacted with your posts through likes, comments, saves or shares?
- Profile activity: How many people visited your profile, tapped your website or clicked your contact button?
- Follower growth: How many new followers did you gain, and which posts or formats triggered those spikes?
- Demographics and active times: What’s the age, gender and location breakdown of your followers? Which times and days are they most active?
But not every Instagram metric deserves the same attention. Some numbers look good in a report but don’t say much about business momentum.
Likes show that people enjoyed a post, but they’re mostly passive. A person can like something in half a second and keep scrolling.
Small businesses need to focus on metrics that show deeper intent and traction, such as comments, saves, shares, clicks and follower growth rate (instead of follower count).
But studying these metrics in isolation isn’t enough. You also need to look at how they connect together to get an accurate picture of your brand health.
For example:
- A post with high reach and low engagement might need a stronger hook or more relevant topic to convince people to interact.
- A post with lower reach but high saves might be worth repurposing or promoting as it clearly delivers long-term value.
- Lots of profile clicks but fewer website taps might indicate your posts are creating curiosity but your profile isn’t doing enough to move people to the next step.
Let’s dive deeper into these small business social media analytics.
Tracking engagement metrics within your Instagram analytics
Engagement metrics show how strongly your content resonates with your audience. For SMBs, tracking the right kind of social media engagement is key.
While likes are useful, metrics like saves, shares and comments tell you more about how interactive your content is because they require more effort from the user.
- Saves mean someone wants to return to your content later. It could be a recipe they’ll cook, a checklist they’ll use on Monday or a product they plan to buy.
- Shares mean someone put your brand in front of their own network. That’s free publicity, and it’s how small accounts reach people who’ve never heard of them.
- Comments mean someone stopped to respond. They also open a door for you to reply, which deepens the relationship and shows your brand has an active community.
Along with showing you how actively invested your audience is, these metrics tell the Instagram algorithm your content is worth distributing to more users.
Monitoring audience growth using Instagram analytics
With Instagram analytics tools, you can track the number of new followers you gain over time or through specific posts. But raw follower counts alone don’t matter much. You also need to look at the quality of your followers to assess true audience growth.
For small businesses on Instagram, 500 high-intent community members who engage and convert into customers are more valuable than 5,000 drive-by followers who barely interact.
To gauge follower quality, watch three things:
- Follower growth rate: The percentage your audience grows over a set period, which shows whether you’re building momentum or stalling regardless of your account size.
- Follower demographics: Who is your Instagram content attracting? Which age groups, genders and locations do your followers belong to? Do they match the characteristics of your top customers? If not, you need to revisit your content strategy.
- Growth spikes: When you gain followers faster than usual, trace it back to what caused the jump. It might be a specific type of content or visual format, like a product-focused post, an educational carousel or an entertaining Reel.
To trace a follower spike back to its source:
- Open your follower growth graph in Instagram Insights
- Note the days your followers jumped
- Check what you published right before each spike
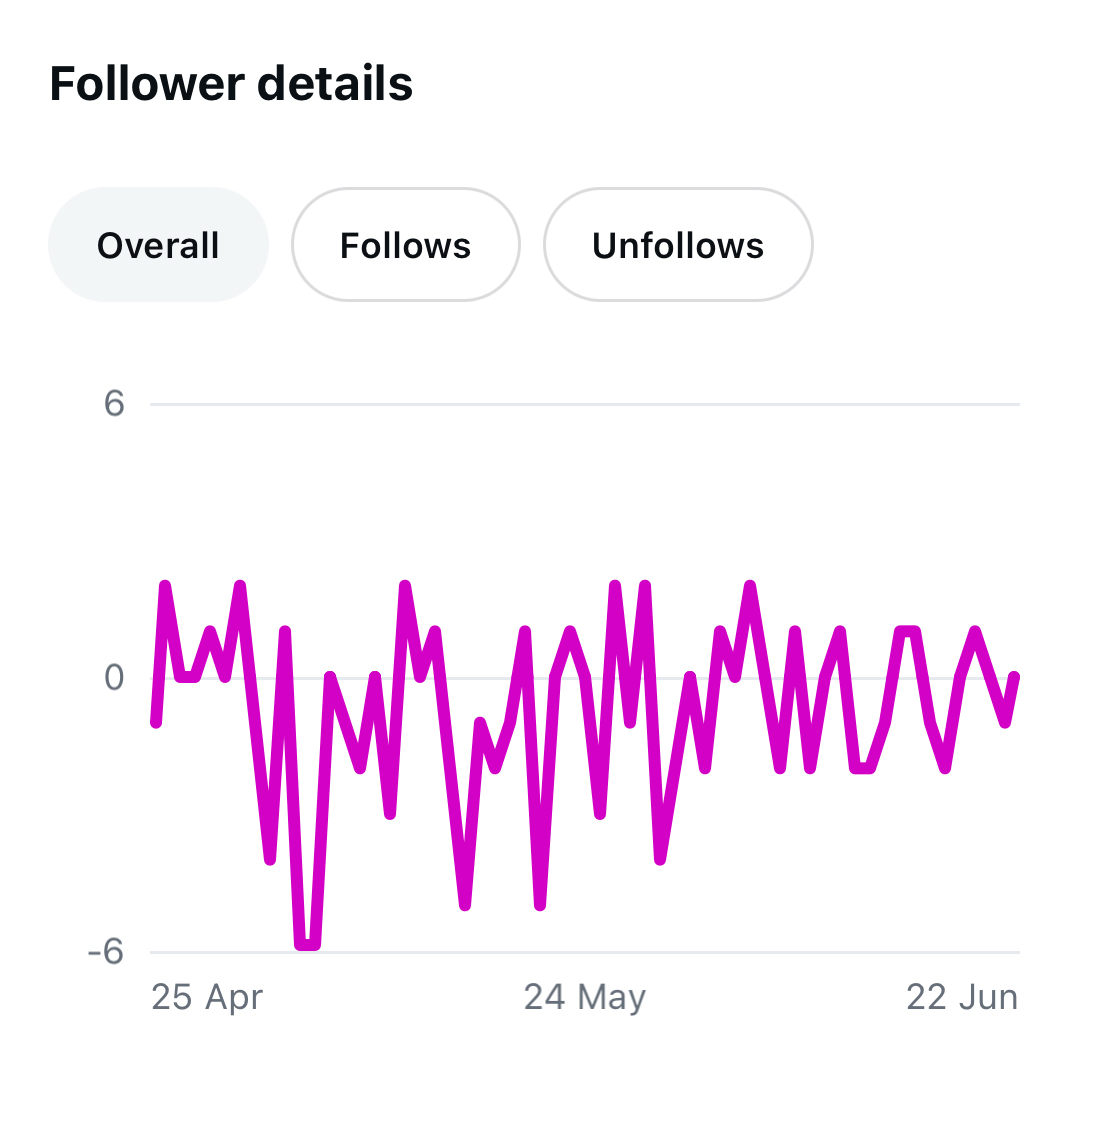
The downside is the manual work. You’re matching dates between the graph and your post history by hand, and Instagram’s short history window means older spikes disappear.
Sprout Social makes this easier by bringing profile-level growth metrics and post-level performance into one reporting workflow. Use the Instagram Business Profiles report to spot audience growth trends.
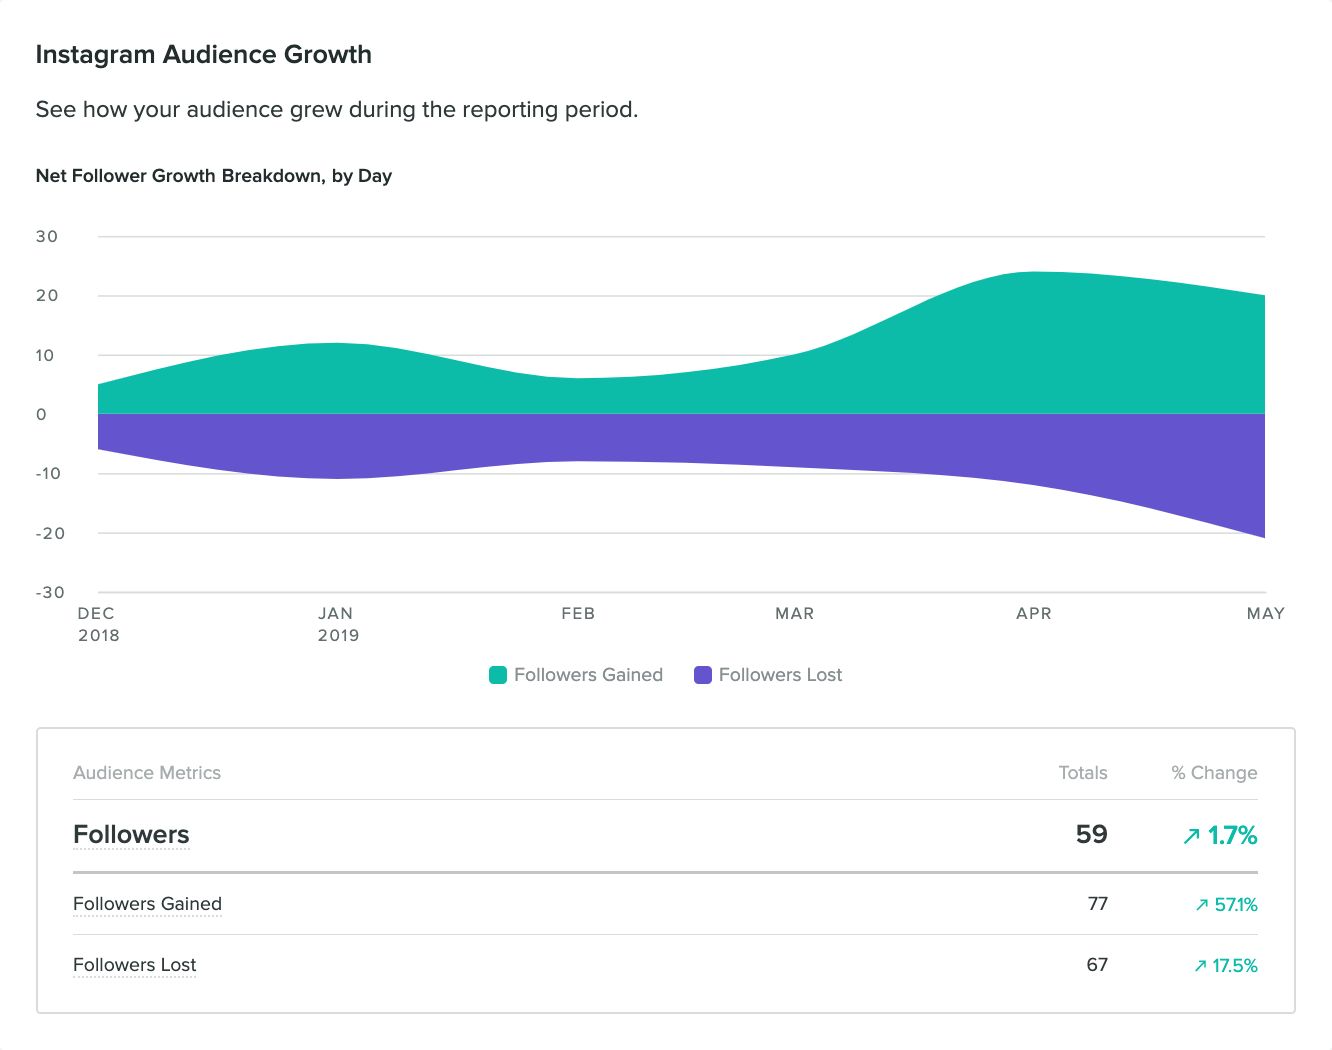
Then, analyze the posts and formats published around those spikes. Instead of manually checking each post, you can compare your content side by side in one view, making the whole process faster and more efficient.
Sprout’s Instagram report also breaks down the demographics of your followers, so you can see characteristics like age, gender, cities and countries in the same place.
How to access and interpret your Instagram analytics
You can access Instagram analytics in three ways:
- Instagram Insights: If you have a professional Instagram account, you can open your review account reach, engagement, follower changes and content performance inside the app. You can also open a specific Reel, post or Story to see how it performed.
- Meta Business Suite: This is another way to review Instagram performance, especially if you also manage Facebook. You can check reach, interactions, audience activity and performance from a business dashboard instead of only using the Instagram app.
- Third-party social media management platforms: These tools bring your Instagram analytics, reporting and publishing into one place. Platforms like Sprout Social also help you compare performance across networks in one view.
Accessing the data is easy. Interpreting it without losing an afternoon is where most small businesses struggle, because the numbers sit in fragmented mobile dashboards.
That’s why smart teams prefer third-party platforms over native apps. Sprout Social, for example, gives you a single source of truth you can quickly read and act on.
Let’s take a closer look at the challenges Instagram’s native analytics tools present and how moving to third-party software can help you overcome them.
The limitations of native Instagram analytics tools
As your brand grows, you’ll need more and more data to guide your decisions. And you’ll need it fast. This is when the “hidden tax” of native dashboards kicks in. You’ll find yourself constantly switching tabs or doing manual math.
Want to compare this month’s average engagement to last month’s? Screenshot, jot down numbers, open a calculator. Want to know your best-performing format across 30 posts? Scroll, tally, repeat. The historical window is short, so the data you need may already be gone.
And because Instagram only shows you Instagram, every other channel means another login and another set of numbers to reconcile by hand.
All of this extra admin work takes time, which small teams are already short on. Moving to a third-party analytics platform with unified dashboards frees you up for more strategic tasks, which is more cost-effective in the long run.
Knowing when to graduate to third-party software
Native tools feel free, but they bill you in time. Every hour spent screenshotting, app-hopping and building the same report is an hour you could have spent creating or selling.
Still unsure? Here’s a checklist. If you’re:
- Spending more time collecting data than acting on it
- Sharing reports regularly with your team, clients or leadership
- Relying on memory or notes rather than actual historical data
- Managing Instagram alongside Facebook, TikTok, LinkedIn or other channels
It’s time to move to a social media management platform.
A unified platform solves the core problem, which is fragmentation. Instead of hunting for metrics across separate apps, you pull every channel into one dashboard. This helps you spot gaps and opportunities faster, and turns endless numbers into a strategy you can execute.
Using Sprout Social Essentials to elevate your Instagram analytics
Instagram analytics are only valuable if they help you decide what to do next.
For most SMBs using social media marketing, finding the data isn’t the challenge. It’s turning dozens of metrics into action.
Sprout Social Essentials solves that exact problem. At $79/month, it’s built for small but ambitious teams that want to maximize their resources and focus more on strategy than on repetitive admin tasks throughout the week.
Instead of bouncing between apps and spreadsheets, you can track Instagram performance, identify trends and plan your next posts from a single platform. Spend less time reporting and more time acting on what the data tells you.
Try Essentials free for 30 days. No credit card required.
How Sprout Essentials makes it easier for SMBs to grow with Instagram analytics:
Automating your Instagram performance reports
Sprout Essentials replaces manual screenshotting and data entry with three reports you can automatically generate at any time:
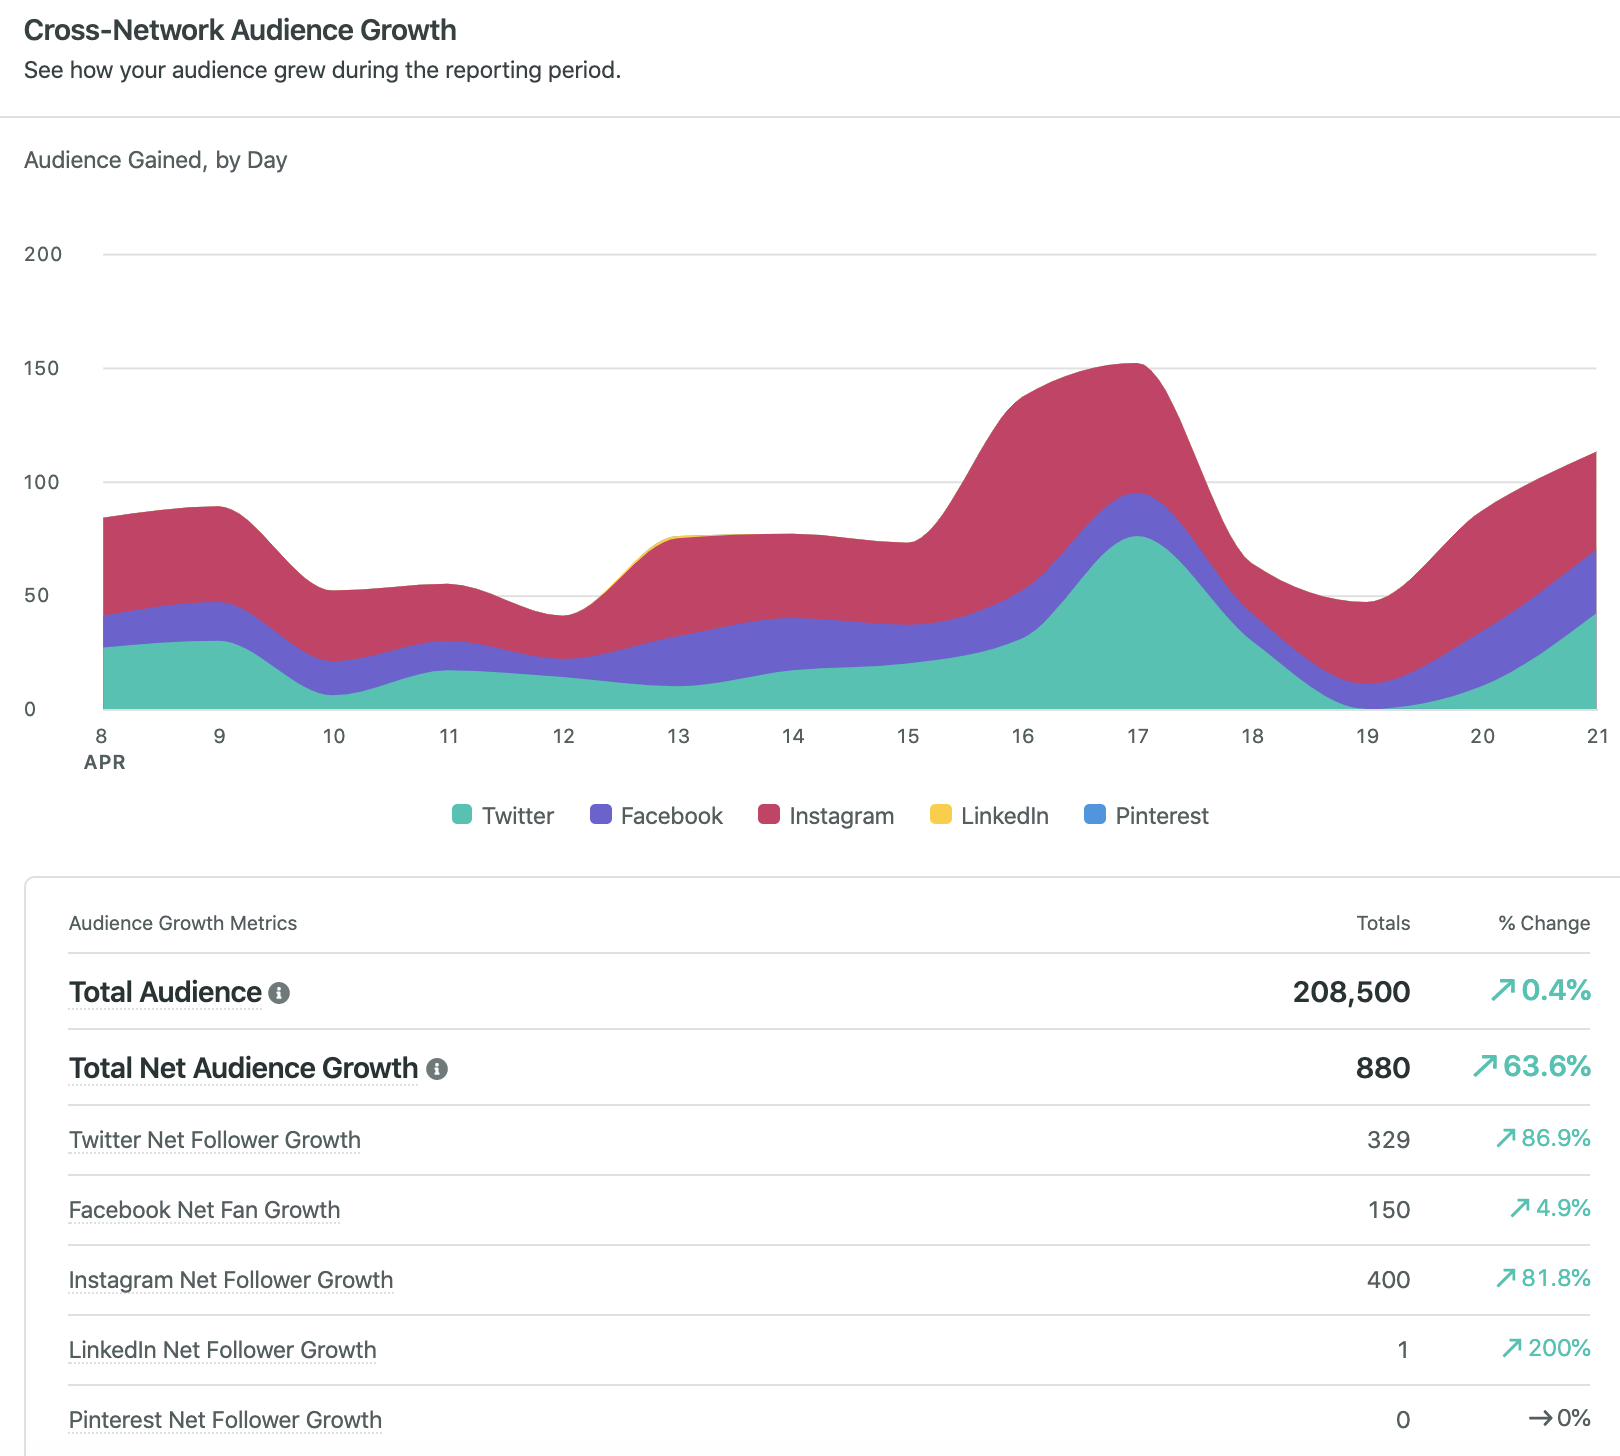
- Profile performance report: A high-level overview across all your connected profiles so you can evaluate your social media growth at a glance.
- Post performance report: A cross-channel, post-level breakdown that helps you understand what type of content resonated and why.
- Social media network reports: Track reach, engagement, audience growth, top-performing posts, demographics and more for individual networks (e.g., Instagram).
These reports make it easier to answer practical questions like:
- Did audience growth increase or slow down?
- Which posts drove the strongest engagement?
- Which channels are performing better than others?
You can also share these live reports directly with your team or download a copy. With automated reporting, small business owners spend less time in spreadsheets and more time executing strategy based on real-time data.
Scaling your best-performing Instagram content
Once you know which content performs best, the next step is creating more of it. Sprout Social Essentials helps you move from insight to execution without adding more tools to the workflow.
After identifying a winning format, create and publish similar content using features like:
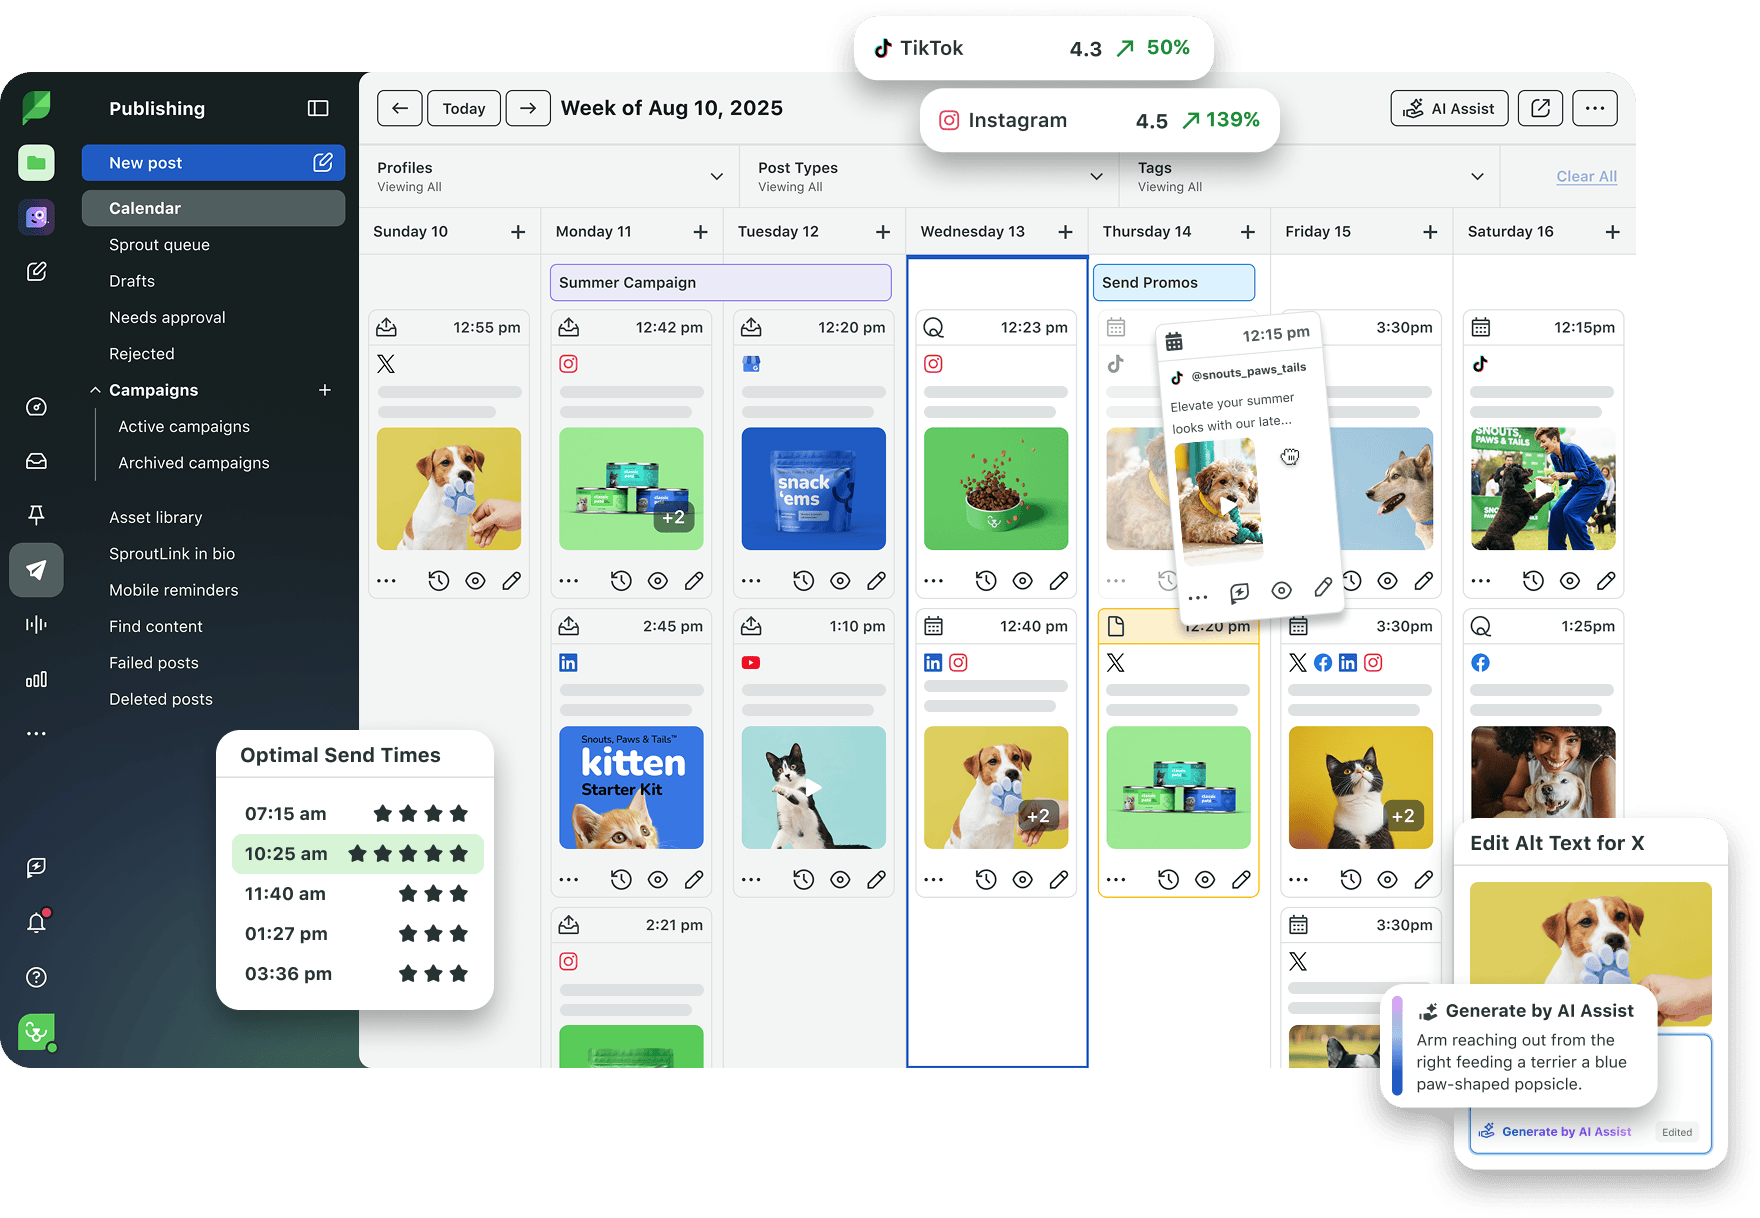
- Visual social media calendar: Plan your Instagram content alongside other scheduled posts so you can see your full publishing mix at a glance.
- Advanced scheduling tools: Batch and schedule Reels, Stories, carousels and other posts ahead of time instead of publishing manually from your phone.
- Send time optimization: Sprout’s ViralPost technology recommends publishing times based on when your audience is most active, so your posts get max engagement.
- Built-in image editor: Make quick visual adjustments inside Sprout, such as cropping, adding filters or resizing photos, so small edits don’t slow you down.
- Unlimited AI-generated alt text: Add accessible image descriptions faster without writing every version from scratch.
For example, a local bakery might notice that Reels of croissants coming out of the oven consistently drive engagement and follows. The team can turn them into a daily or weekly series around the baking process, such as “morning bake prep.”
Using Sprout, they can map the series in the visual calendar, schedule posts around peak engagement times, tweak the visuals and add alt text before publishing. Everything is done in the same platform, from analyzing performance to executing strategy.
For SMBs, that’s the ultimate goal of Instagram analytics: identify what works, repeat it consistently and spend less time guessing what to post tomorrow.
37 free social media strategy templates that will elevate your workflows
Published on December 5, 2025 Reading time 15 minutes

Share