Social Media Analytics
Social media analytics: The complete guide
Starting a social media strategy? Learn how analytics play a crucial role in shaping effective marketing, understanding audience sentiment and achieving ROI through data-driven insights.
Reading time 15 minutes
Published on July 1, 2026
Table of Contents
Summary
- Social media analytics are essential for monitoring and assessing the success of marketing efforts.
- The key significance of tracking social analytics is to prove ROI, evaluate the success of social media campaigns and guide informed decisions for social media strategies.
- The main areas of social media analytics include performance metrics, audience demographics, competitor insights, paid ad results, influencer impact and brand sentiment.
Your social media strategy sets the direction. Your social media analytics tell you whether you’re actually heading there.
Without social analytics, you’re guessing, posting content, running campaigns and reporting numbers to leadership with no real confidence behind any of it. That’s not a strategy. That’s hope masquerading as one.
Social media data analytics are the engine behind every smart marketing decision, from proving ROI to understanding your audience, benchmarking against competitors and spotting trends before they peak. Every major social platform offers native analytics, and purpose-built social media analytics tools go significantly deeper. They connect cross-network data in one place so you can act on insights faster.
This guide covers why social media analysis matter, which metrics to track, the different types of analytics available and which tools help you measure performance at depth.
What is social media analytics?
Social media analytics is the process of collecting, measuring and interpreting data from social media platforms—including metrics like reach, engagement, impressions, follower growth and conversions—to evaluate content performance, understand audience behavior and demonstrate the business value of social media.
This helps marketers understand which types of social media content best resonate with their audience, so they can shape and adapt their strategy accordingly. Reviewing social media data analytics empowers teams to make data-informed decisions about how to transform their marketing efforts and grow their businesses.
Marketers conduct social media analysis natively on platforms like Instagram, TikTok and X (formerly known as Twitter), or use social media management software like Sprout Social to dive deeper into the numbers.
Ready to stop guessing and start proving your impact with automated, presentation-ready reports?
Why social media analytics matter
Tracking social media data isn’t just about collecting numbers; it’s about turning those figures into decisions that move the business forward. For many teams, toggling between native platform dashboards makes it nearly impossible to compare performance across platforms or understand what’s driving results.
That’s why brands switch to a unified social media management tool. With all your data in one place, you surface insights faster, collaborate better and spend less time in spreadsheets.
Here are four key ways social media analytics drive real business impact:
- Trendspotting: Identify emerging conversations and content opportunities before they peak
- Brand sentiment: Understand how your audience feels about your brand in real time
- Goal setting: Use performance data to set realistic, evidence-based targets
- Proving ROI: Connect social activity to measurable business outcomes for executive reporting
1. Trendspotting
Trendspotting is the act of pinpointing upcoming trends before they’re mainstream.
According to The 2025 Sprout Social Index™, 93% of consumers agree it’s important for brands to keep up with online culture. Keeping a close eye on your social media analytics can help you do just that. Some of the trends your social media analytics can help you determine include:
- Which platforms are gaining or losing traction and popularity
- Topics of interest your audience is talking about
- Types of ads that capture attention
- Rising influencers and products in your niche or industry
- Content formats your audience engages with most
When you analyze them properly, your social media analysis and reports are a huge support for identifying what you should post more of, what types of content are trending and what your audience wants to hear more about in the next quarter or year.
Sprout’s Listening tools make it straightforward to surface emerging trends across your industry and see which conversations are driving action—before competitors spot them.
By setting up Listening Topics, you can track keywords, hashtags and brand mentions across channels, even if you’re not tagged. These insights reveal shifts in audience language, competitor activity and broader cultural movements, allowing you to jump on trends before they lose momentum.
And with Sprout’s handy, free templates like the Social Insights Slide Deck, it’s easy to collate your data and turn it into decisions that stakeholders can act on.
Book a demo to try trendspotting with Listening
2. Brand sentiment
Brand sentiment is how people feel about your brand. It includes all positive, neutral and negative feelings that are discussed online. By looking through your social media data analytics, with help of sentiment analysis software, you can review and measure your brand sentiment.
This reveals whether customers are satisfied, surfaces issues that need fixing and highlights opportunities to improve the product or experience.
For instance, Sprout‘s Listening dashboard (available as a paid add-on or via the demo) includes sentiment charts, top keywords and volume trends that help visualize changes in how people perceive your brand. These features show you which topics, emotions and shifts are driving conversation.
Using this information, you can understand how your audience is feeling and why they feel that way in real time. That clarity helps you make smart campaign pivots, prepare better launches or get ahead of potential crises before they escalate.
Plus, competitive analysis lets you compare sentiment trends against rivals. When you view your brand’s sentiment alongside your competitors, you can see whether a downturn is unique to your messaging—or part of a broader industry shift. Tracking sentiment over time also gives you a reliable read on perceived value, showing whether customers see your product as worth the price, so you can adjust your messaging before it affects demand.
3. Setting social media goals
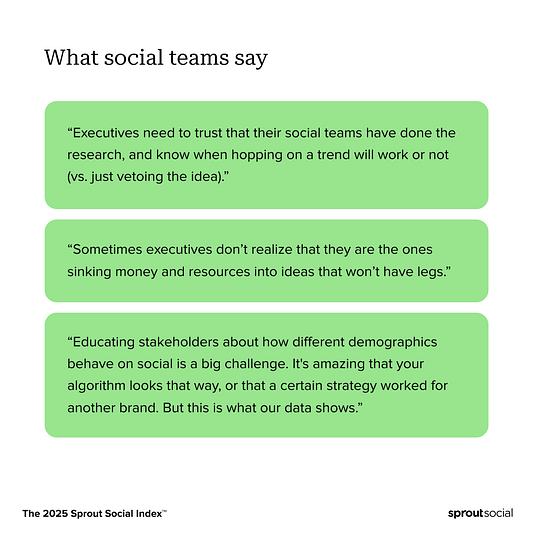
The 2025 Sprout Social Index™ found that almost half of individual contributors say their executives only somewhat understand the value of social media, and another 41% report their greatest fear is company leadership not trusting them to publish content that will perform best. The best way to build that trust? Show the numbers.
Your social media analytics hold the key to proving impact and setting realistic, data-backed goals that align with business priorities. Instead of relying on assumptions, analytics help you identify which channels and content are driving engagement, so you can refine your strategy and set benchmarks for growth.
Standard and tag-based reports make this process easier. They allow you to:
- Track KPIs across your social media accounts.
- Filter performance by campaign or content type.
- Set measurable goals tied directly to engagement, reach or conversions.
When paired with Sprout’s Social Media KPI Template, you can clearly map social performance to broader business outcomes and showing exactly where your strategy is moving the needle so goals are ambitious but grounded in real data.
For example, if your Instagram analytics show you’re growing by 10 followers per week, aiming to double your audience in one quarter doesn’t tally with the data. A more effective goal is to increase your growth rate to 20 followers per week, then build from there.
4. Proving ROI
Proving the value of your social media efforts is what secures executive support and unlocks greater investment in your strategy. Leadership needs clear, measurable returns—and your social data analytics provide exactly that proof of social media ROI.
According to the 2025 Impact of Social Media Report, 56% of marketing leaders say social media drives revenue for their businesses. By effectively tracking your social media analytics, you can gather data and demonstrate social media statistics that further strengthen your case.
Sprout Social offers you that proof by connecting your content to real business outcomes using tools like the Tag Performance Report, which tracks how specific campaigns, posts or content themes drive engagement and conversions. Combine that with the Sent Messages Report to monitor performance at the individual post level, including clicks, reach and engagement.
Want to dig in deeper and track revenue impact? Add UTM parameters to your links and monitor conversions through your site analytics to highlight the posts that drive web traffic, sign-ups and purchases.
And if your team needs to report to leadership, you can use Sprout’s Premium Analytics (available via a demo) to build custom dashboards with graphs, widgets and text-based notes that connect your results directly to your business goals. Sprout’s Executive Social Media Scorecard Template gives you a plug-and-play framework to summarize KPIs, visualize trends and present outcomes in a clear, digestible format.
Key social media metrics to track
Not every metric deserves the same attention. The right ones to track depend on what you need social to do for your business, and that answer changes depending on where you are in your strategy.
Start by matching your social media metrics to your goals. That keeps your reporting focused and makes it far easier to communicate results to stakeholders who don’t live inside the platform every day.
Awareness metrics
Use these when your goal is reach, visibility or brand recognition. These metrics tell you how many people your content is reaching and whether your presence is growing over time.
- Impressions
- Reach
- Video views
- Share of voice
- Follower growth
Engagement metrics
Use these when you want to understand how strongly your content resonates. High engagement signals that your content is earning attention, not just consuming space in a feed.
- Engagement rate
- Likes
- Comments
- Shares
- Saves
- Replies and mentions
Traffic and conversion metrics
Use these when social needs to drive action beyond the platform. These metrics connect your content directly to business outcomes like web traffic, leads and revenue.
- Clicks
- Click-through rate
- Website sessions from social
- Conversions
- Leads
- Sales and revenue
Customer and community metrics
Use these when social supports service, loyalty or retention. According to The 2025 Sprout Social Index™, 73% of social media users expect brands to respond within 24 hours. These metrics show you whether you’re meeting that standard and where you’re falling short.
- Response time
- Resolution rate
- Sentiment score
- Customer satisfaction signals
The principle’s simple: track fewer metrics with more purpose.
What are the types of social media analytics?
To offer some clarity, here’s a side-by-side view of the different types of social media analytics, what they measure and how Sprout’s tools can support each type of analysis.
| Type of Analytics | What it Measures | Sprout Tool or Report |
|---|---|---|
| Performance analysis | Impressions, reach, clicks, likes, shares, views, sales | Profile Performance Reports, Sent Messages Report |
| Audience analytics | Age, gender, location, device, interest areas | Audience Demographics in Profile Reports, Listening (demo) |
| Competitor analysis | Follower counts, engagement rates, top posts, share of voice | Competitive Reports, Listening Topics, Benchmarking Tools |
| Paid social analytics | Ad clicks, conversions, CPC, CTR, spend, ROI | Paid Performance Reporting, Tag Performance (campaign tags) |
| Influencer analysis | Reach, interactions, hashtag usage, influencer performance | Influencer Marketing by Sprout (demo), Listening Topics |
| Sentiment analysis | Positive, neutral and negative mentions across social | Listening Dashboard (add-on), Reviews Feed, Smart Inbox |
Performance analysis
First and foremost, you need to measure the overall performance of your social media efforts. This includes social media metrics including:
- Impressions
- Reach
- Likes
- Comments
- Shares
- Views
- Clicks
- Sales
You can easily gauge all of this within your Sprout Social dashboard:
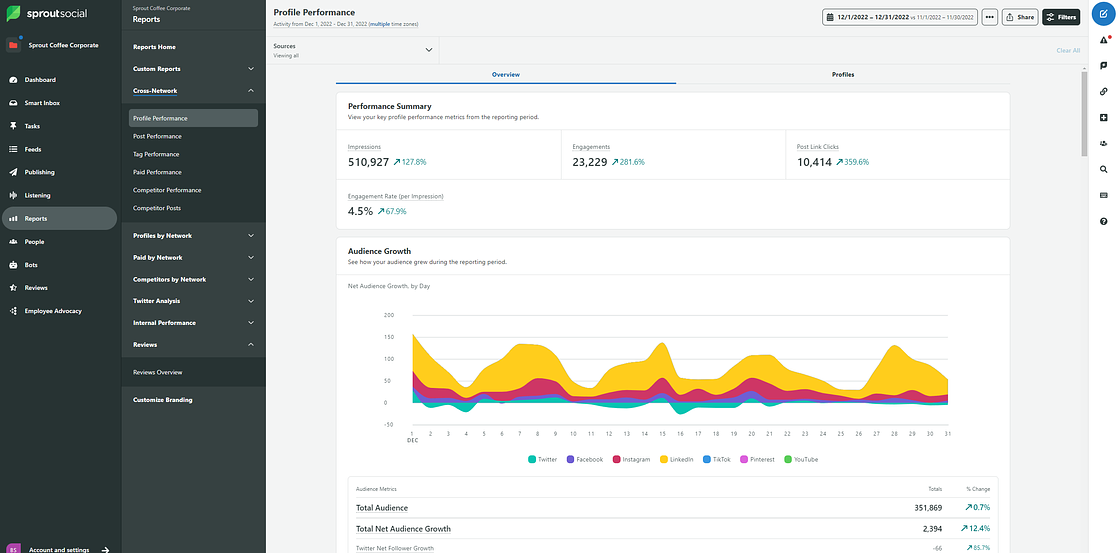
You can use Sprout’s reports to showcase how your marketing content is performing and identify which types of posts resonate with your audience best.
Audience analytics
Next, you’ll want to take a look at your audience analytics. This will help you discover which demographics your content is reaching—and ensure they match up to your target audience. If not, you may need to adjust your content strategy to better attract your ideal customer profile.
Audience analytics will include data like:
- Age
- Gender
- Location
- Device
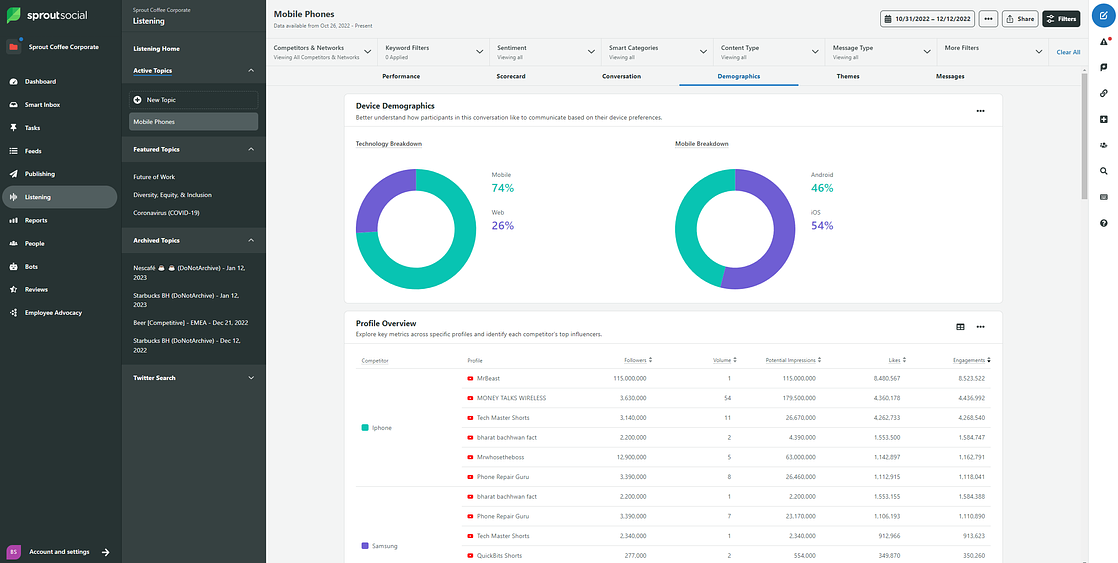
With Sprout Social, you can also gather audience analytics about specific topics related to your industry, which can help you build out your customer profiles. Here’s an example of what that could look like for one of your topics:
Competitor analysis
Another key area to look into is how your competitors perform on social media. How many followers do they have? What is their engagement rate? How many people seem to engage with each of their posts?
You can then compare this data to your own to see how you stack up—as well as set more realistic growth goals. Using a tool like Sprout, you can gather all of this data in one place and measure it network by network.
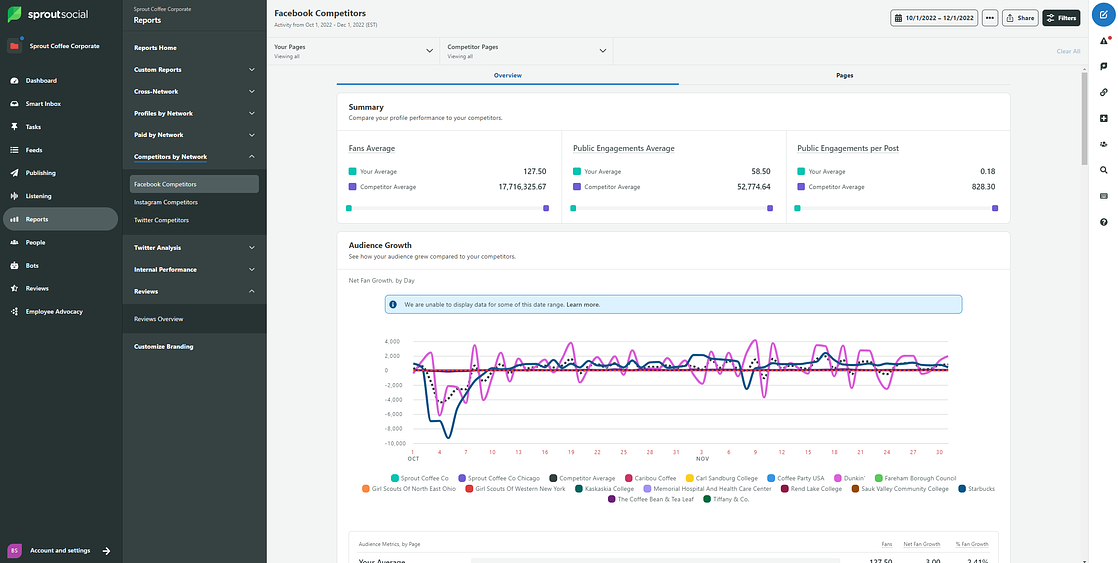
Pay attention to how your benchmarks stand up to your competitors and consider adjusting your social media strategy to take advantage of opportunity gaps. Our insights into social media benchmarks by industry can help frame your data within the broader landscape.
Paid social analytics
When you’re putting money behind specific social media posts, you want to make sure they’re driving results. This is why you absolutely need to pay close attention to your paid social analytics.
Some of the most important ad analytics to measure include:
- Total number of active ads
- Clicks
- Click-through rate
- Cost-per-click
- Cost-per-engagement
- Cost-per-action
- Conversion rate
- Total ad spend
Each social media platform that you run ads through will have its own dashboard to provide you with all of this information. You may also want to maintain your own tracking spreadsheet to monitor total ads and ad spend across platforms.
Influencer analysis
If you’re running influencer marketing campaigns, tracking the success of these partnerships is essential to proving ROI. We recommend using the five W’s + H of influencer marketing to inform your strategy and measure ROI at each stage of the buyer journey.
Some of the data you’ll want to keep track of includes:
- Number of posts created per influencer
- Total number of interactions per post
- Audience size of each influencer
- Hashtag usage and engagement
This can help you gauge overall engagement from your influencer campaigns. If you have an affiliate marketing program, you can designate promo codes for each individual influencer to use so your team can track how many sales each partner drives as well.
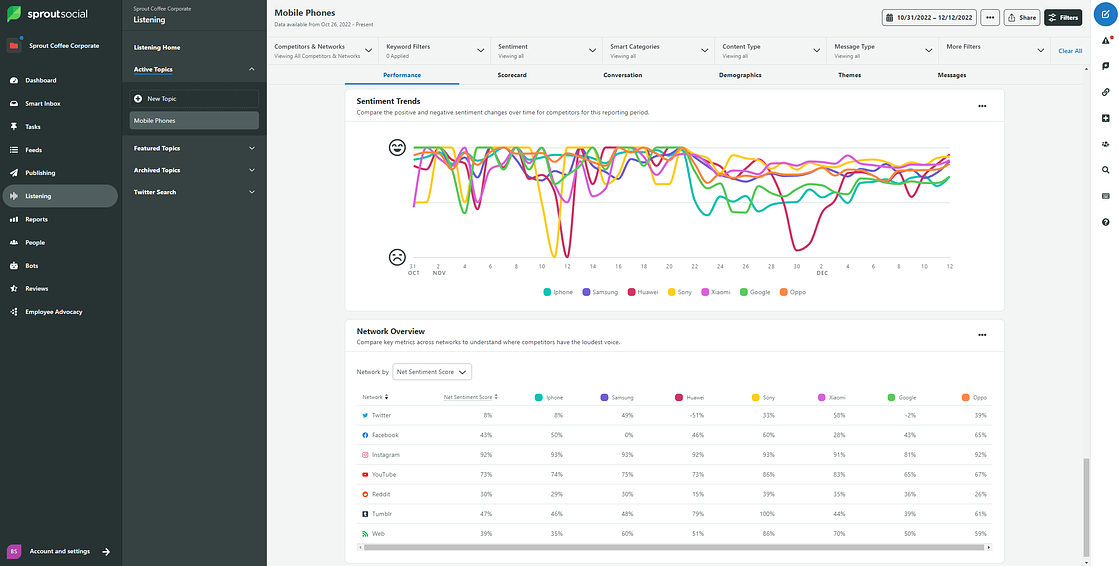
Sentiment analysis
The last major segment of social media analysis you’ll want to track is brand sentiment. Earlier, we talked about how social media analytics tools can help you determine and measure sentiment analysis. But if you want to dig even deeper, use social listening to gauge specific connotations around your brand.
Sprout’s Social Listening dashboard helps measure your brand sentiment, showcasing how users feel about your brand or relevant keywords and topics. You can also use sentiment analysis in Sprout’s Inbox and Reviews Feed.
What to look for in a social media analytics tool
The best social analytics tool does more than collect data. It supports your understanding of what happened, why it happened and what to do next. According to the 2025 Impact of Social Media Report, 58% of teams rated as experts at measuring the business impact of social rely on social media management tools to do it.
If you’re evaluating platforms, prioritize these capabilities:
- Cross-network reporting so you can compare performance across all your channels in one place—no more toggling between native dashboards
- Custom dashboards that match the way your team and executives review results
- Audience insights that reveal who you’re actually reaching versus who you’re trying to reach
- Competitor benchmarking so you can measure your share of voice and spot opportunity gaps in the market
- Sentiment and listening data that explain the context behind the numbers, not just the numbers themselves
- Campaign tracking via tags, UTM links and content themes to tie social activity to specific business outcomes
- Automated reporting that eliminates manual exports and saves your team hours every week
- Collaboration features so insights flow across teams—not just stay locked in the social team’s inbox
Your analytics platform should eliminate work, not create more of it. It should surface the right insights fast, cut through noise and help your team move from data to decision without friction.
How to use social media analytics for small businesses growth
Global brands rely on data science teams to parse complex listening metrics. Lean teams need speed. For solo marketers and growing business owners, analytics isn’t about tracking every possible data point—it’s about focusing on what drives high intent traffic and revenue.
When time is your most valuable asset, pulling numbers into a spreadsheet every Friday afternoon is a tax on your productivity. The secret to scaling organic growth quickly is moving past vanity metrics and manual tracking. A social media growth tool like Sprout Social Essentials makes tracking the leading indicators of business momentum easy and affordable.
By monitoring your audience growth trends, analyzing post-level performance to see which formats drive meaningful saves and shares and measuring outbound profile clicks via Link in Bio, you can isolate exactly what converts. Once you know what drives quality traffic to your storefront, you can stop guessing and create more of what works. Our dedicated SMB analytics guide to Instagram dives deeper into what you should be tracking and why.
What are the best social media analytics tools?
The right social media analytics tool depends on your team size, the platforms you manage and how deeply you need to connect social data to business outcomes. Here’s a breakdown of the top options and what each does best:
| Tool | Best for | Key features | Networks supported | Standout capability |
|---|---|---|---|---|
| Sprout Social | Teams managing multiple accounts across enterprise, mid-market and SMB | Cross-network reporting, Report Builder, Premium Analytics, AI Assist via Trellis, Listening, Influencer Marketing and Smart Inbox | Facebook, Instagram, TikTok, X, LinkedIn, Pinterest, YouTube | Unified analytics + publishing + listening in one platform |
| Google Analytics | Tracking how social drives web traffic and conversions | Traffic source reporting, audience demographics, conversion tracking, campaign ROI | All platforms (via UTM tracking) | Connects social traffic to on-site behavior and revenue |
| Rival IQ | Agencies and brands needing competitive benchmarking | Competitor analysis, social listening, hashtag analytics, influencer tracking, social audits | Facebook, Instagram, X, TikTok, YouTube, LinkedIn | Side-by-side competitive performance reporting |
1. Sprout Social
Sprout Social gives you the power to go beyond surface-level metrics and prove the impact of your social strategy.
With cross-network analytics, you can track performance on an individual network or view them side-by-side in one unified analytics dashboard. No more toggling between Facebook analytics and TikTok analytics. You see them clearly in one place, making it far easier to compare performance, spot patterns and act fast with confidence.

When it comes to reporting, flexibility and speed are built in. Sprout’s Report Builder lets you build custom dashboards using drag-and-drop widgets for key metrics, tags and campaign views. Adapt the format to match your audience, whether you’re reporting weekly wins or executive KPIs.
Need deeper insights? Premium Analytics unlocks advanced tools like:
- Create custom, shareable dashboards with stakeholder-specific views.
- Add text annotations to highlight goals, insights and campaign outcomes.
- Use AI Assist to generate real-time summaries of what’s working and why.
Sprout is also built to scale with your team. Assign different reporting permissions, collaborate across profiles and monitor live trends, solving bottlenecks from limited access or disjointed workflows.
Dig beneath the surface of performance metrics to understand why people engage with Sprout’s Advanced Listening add-on. Listening helps you analyze brand sentiment, track your share of voice and uncover the topics and trends your audience actually interacts with. Filter conversations by emotion, keyword or competitor mentions for a clear picture of how your brand fits into the broader landscape.
Now pair that with Sprout Social Influencer Marketing. Measure ROI on creator partnerships, identify which influencers align with the conversations your audience is already having and discover new creators who match upcoming trends, all backed by data-led decisions.
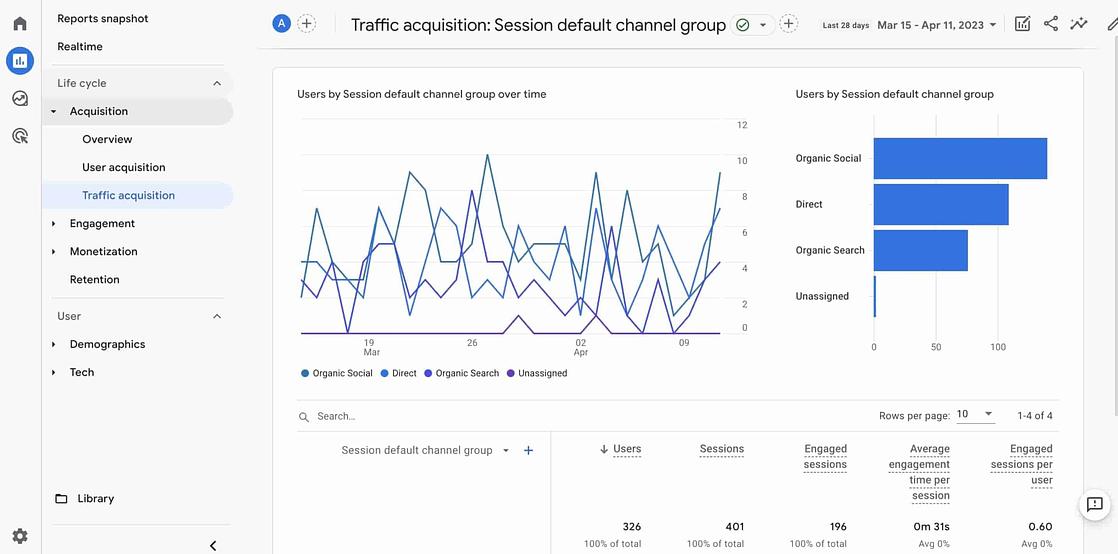
2. Google Analytics
Google Analytics isn’t solely for social analytics, but it’s a staple for social media practitioners and leaders. You can create reports to monitor:
- How your social media efforts drive web traffic and lead generation
- Which social networks fuel the most traffic
- Audience demographics
- ROI of your social media campaigns
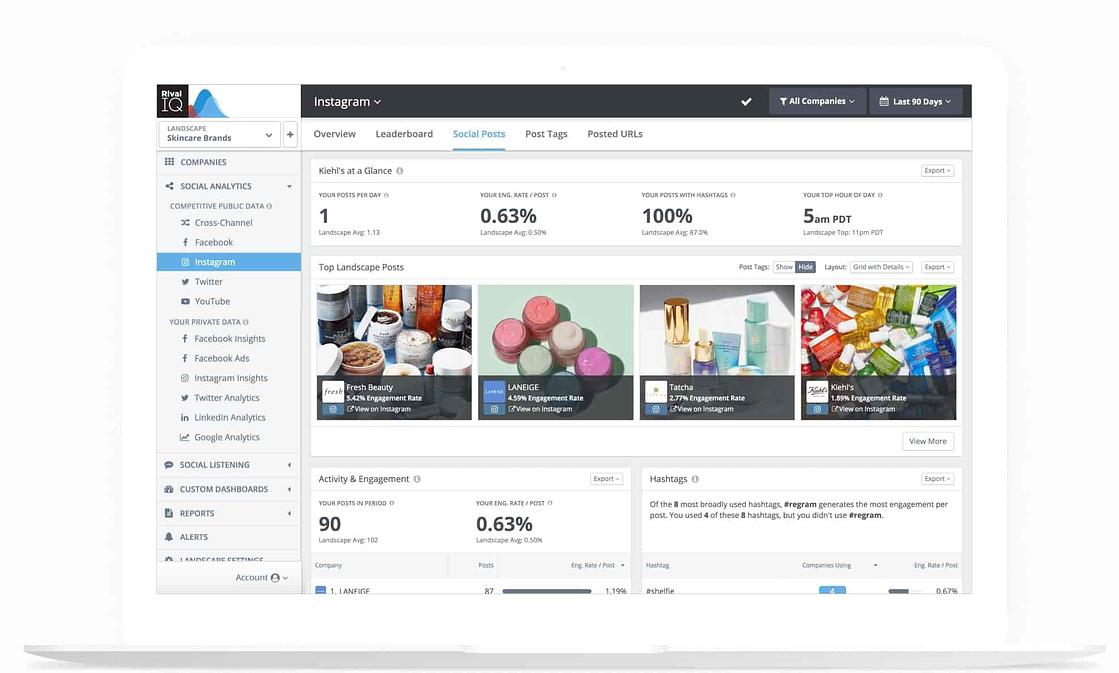
3. Rival IQ
Rival IQ specializes in competitive intelligence and customized analytics reporting across multiple social media platforms, including YouTube. The platform covers competitor analysis, social listening, influencer tracking, hashtag analytics and social media audits. It’s a strong fit for agencies managing multiple clients or brands that need deep competitive benchmarking alongside their own performance data.
How to build your first report in Sprout Social
Ready to turn your data into decisions?
With Sprout’s Report Builder, it’s straightforward. Create customized reports that showcase the metrics your team and stakeholders care about most—all on one platform.
Here’s how to build your first report inside Sprout Social.
1. Sign up for your free Sprout trial
Start by creating a Sprout Social account using your business email. This step ensures you’ll get access to the full trial experience, including core analytics features like Report Builder, Sent Messages and Tag Performance.
Once you’ve signed up, pick the social accounts you’d like to link to integrate Sprout with your social media.
2. Head to the Report Builder
Once you’re in the Sprout dashboard, navigate to the Reports tab in the left-hand sidebar.
From there, click on Report Builder to launch the customization view.
3. Choose a report type
Sprout offers a few starting points. You can:
- Start with a blank report
- Use a template (like cross-network performance or Instagram overview).
- Build from a pre-existing report you’ve created earlier.
Pick the option that fits your goals. Templates allow you to customize later, so they’re great if you’re just getting started.
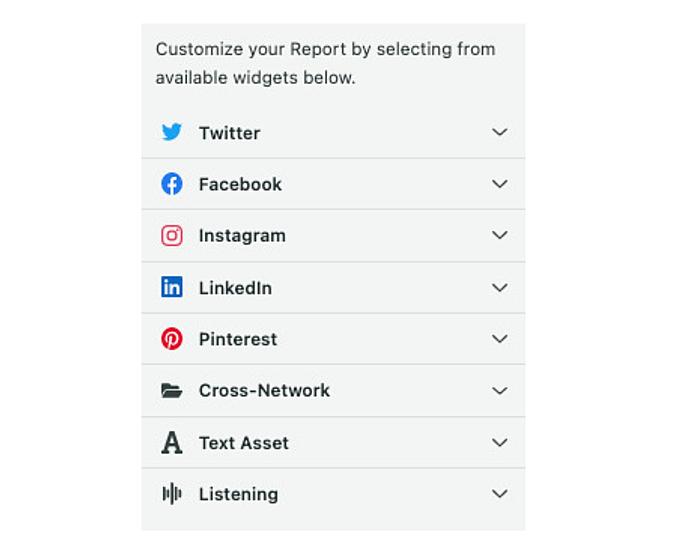
4. Add your widgets
Next, add your widgets.
Widgets are drag-and-drop reporting blocks that help you visualize your performance data. They pull directly from your connected social profiles and are grouped by data source, like Facebook, Instagram, LinkedIn, Cross-Network and Listening (if enabled).
Each source comes with its own set of widget options. Tailor your report to focus on the platforms and metrics that matter most to your team.
Popular widget types include:
- Key metrics (like engagement, reach, clicks and impressions)
- Top-performing posts per platform
- Audience growth over time
- Tag performance (to track specific campaigns or content themes)
- Custom text blocks to add context or call out takeaways
Drag the widgets you need into your report layout. They’ll update in real time to reflect your most recent data.
5. Customize your layout and visuals
Customize your social media reports so their layout and visuals make sense to your team.
Change the report title, reorder sections, adjust formats and add text annotations to give stakeholders context. Customization also helps highlight performance wins, campaign milestones or areas for improvement.
Using Premium Analytics (or testing the demo)? Try adding advanced widgets and custom, branded visuals to your reports.
6. Share your report
Once your report looks the way you want it, you can:
- Download it as a PDF.
- Share it via a dynamic link with auto-updating metrics.
- Schedule it to be delivered to your team weekly or monthly.
Sprout also makes it easy to plug these insights into leadership-ready formats. Use the Social Media Analytics Template to present your KPIs clearly.
Turn your social media data analytics into decisions
The brands winning on social aren’t just posting more; they’re measuring smarter. Every data point tells you something. Every report is an opportunity to earn more trust from your team, your leadership and your audience.
Start a free Sprout Social trial and see how a unified analytics platform transforms raw data into the decisions that move your business forward.
FAQs about social media analytics
What is social media analytics?
Social media analytics is the process of collecting, measuring and interpreting data from social media platforms—including metrics like reach, engagement, impressions, follower growth and conversions—to evaluate content performance, understand audience behavior and demonstrate the business value of social media.
What's the difference between social media analysis and social media reporting?
Social media analytics is the process of collecting and interpreting data from your social media platforms. Social media reporting is how you package and communicate those insights to stakeholders. Analytics finds the story, reporting tells it.
How do I track my social media analytics?
There are tools built for social media tracking. You can read more about them in our post on the best social analytics tools, or you could try out Sprout Social’s Analytics tools for free today!
How often should I review my social media analytics?
Check performance weekly to catch shifts early and keep your content strategy on track. Review broader trends monthly or quarterly to make sharper decisions about budget, channel investment and campaign planning.
What social media metrics matter most to executives?
Executives prioritize metrics tied to business outcomes: reach, conversions, revenue from social, leads and customer response performance. Connect your social data to those outcomes and you’ll earn both attention and budget.
Can social media analytics improve my paid social performance?
Yes, your organic analytics reveal which messages, formats and audience segments earn the most attention, and that intelligence directly informs your paid targeting and creative decisions. Strong organic insights consistently produce stronger paid results.
Additional resources for Social Media Analytics
Social media analytics: The complete guide

Social intelligence isn’t the future, it’s right now

How to use social data for target audience analysis

14 of the best social media analytics tools for your brand in 2026

Snapchat analytics: How to find the metrics that actually matter


How to build a LinkedIn dashboard that proves your social ROI

Organic reach: What it is and how to improve it in 2026

YouTube analytics: How to analyze your YouTube data

13 YouTube analytics tools to improve your marketing in 2026

LinkedIn analytics: The complete guide for tracking metrics in 2026

7 AI tools for data analytics: A marketer’s guide

What is attribution modeling for social media marketing?

The social media metrics to track in 2026 (and why)


6 skills social media analysts need in 2025 and beyond


Thanks for the memories: How to use the power of nostalgia marketing

Reach vs. impressions vs. engagement: What’s the difference?

How to use Google Analytics for stronger social media reporting

How to set and achieve meaningful social media goals

Pinterest analytics: a guide for marketers


Social media SWOT analysis: what it is and how to do it


Share