How to use Google Analytics for stronger social media reporting

Written by Annette Chacko
Published on July 25, 2023
Reading time 10 minutes
Brands need the context social media metrics provide to meet today’s dynamic consumer space and take their business to the next level.
That’s why leaders from more than 700 companies surveyed in the 2023 State of Social Media Report revealed that 85% of their business decisions were strongly informed by social data and insights. And 56% claimed they soon planned to invest more resources in social media data analysis.
Yet, 69% of business leaders believe social media data and insights are currently underutilized at their organization.
So, how do you bridge this gap between strategy and execution? How do you ensure your social media reporting is contextual to your organization’s overall objectives? And how do you show the true impact of your metrics with effective data storytelling for executive buy-in?
Google Analytics (GA) offers solutions to these multi-pronged questions around social media analytics.
With practical data such as tracking your social efforts against actual revenue-generating clicks, sign-ups and subscriptions, and giving you in-depth audience insights, Google Analytics provides contextualized social metrics to elevate your marketing strategy without overshooting your budget.
Read on to find out how Google Analytics for social media helps with stronger reporting.
Why use Google Analytics for social media measurement?
There is a growing urgency among business leaders to harness the power of social per The 2023 State of Social Media Report.
Google Analytics enables you to measure your social metrics holistically and adds context to your regular reports so they align with your broader marketing goals. Specifically, it helps you in three crucial ways:
Build an effective top-funnel and mid-funnel social strategy
Top-of-funnel social media efforts aim at attracting new visitors and measuring audience behaviour such as web traffic, impressions and average time on site. It’s critical to track how well your brand awareness campaigns are running. The mid and mid-bottom funnel is centered toward converting these new visitors into qualified leads and quantifying the amount of purchase intent in your funnel.
However, mid-funnel efforts cannot be brought to fruition unless you capture more of that hard-earned, top-funnel traffic.
Google Analytics enables you to capture funnel metrics such as goal completions and identify where conversion discrepancies are occurring so your top-funnel and mid-funnel efforts are in sync with each other. Together, these efforts prove your social media return on investment (ROI) and show the impact on business growth.
Social media managers need to highlight the impact of both top-of-funnel and mid-bottom funnel metrics in their reporting so executives and stakeholders see the real value social adds to the overall revenue pipeline.
Align your social metrics to your business goals
Social metrics don’t live in a vacuum. They need to be aligned to the broader marketing efforts and org-wide business goals. Only then will you get the real measure of your social strategy.
For example, it’s vital to identify which social platforms are driving the most traffic to your website but also to know how visitors are interacting with your content. Or if your business objective is to increase website traffic, you should also track overall traffic coming from your social accounts and measure user engagement individually.
Similarly, if your goal is to drive more qualified leads and increase sales, Google Analytics for social media enables you to compare key performance indicators against competitors, traffic sources and hashtags or keywords so you’re able to modify your campaigns accordingly.
This capability is necessary to plan subsequent social campaigns for repeated success because contextual metrics don’t just fuel success for social but also wider business goals.
Understand your target audience
Social metrics from GA tell you audience demographics, their online behavior, interests and where they spend their time online. These metrics help you build compelling content and social tactics that resonate with your audience—both necessary to drive user engagement and successful campaigns more strategically.
For example, based on your audience demographic, you could decide which tactic, such as a live product demonstration or a launch promotion with a special offer, would give you maximum brand amplification and ROI on social.
How to set up Google Analytics for social media reporting
Follow these steps to set up Google Analytics for social reporting and get a better understanding of the impact of your social efforts on marketing campaigns and company revenue.
Identify the questions you want to answer
Identify the most important metrics you want to track based on your SMART (Specific, Measurable, Achievable, Relevant and Timely) goals. Ask yourself critical questions like:
- What social channels are driving the most new users to my website?
- Which social accounts give me maximum website engagement?
- How often do users visit my brand and how do they engage with my content?
Using questions like these as north stars help you gauge key areas like month-over-month engagement rates and traffic source fluctuations, and dig deeper to find out what’s causing them.
This is critical to building a narrative for your data storytelling to highlight how your social efforts are paying off in relation to your organization’s broader marketing strategy.
Set up data collection in GA
You can set up data collection and start tracking web data in Google Analytics in three steps: Create a Google Analytics 4 (GA4) property, add a data stream and use a Google Analytics code.
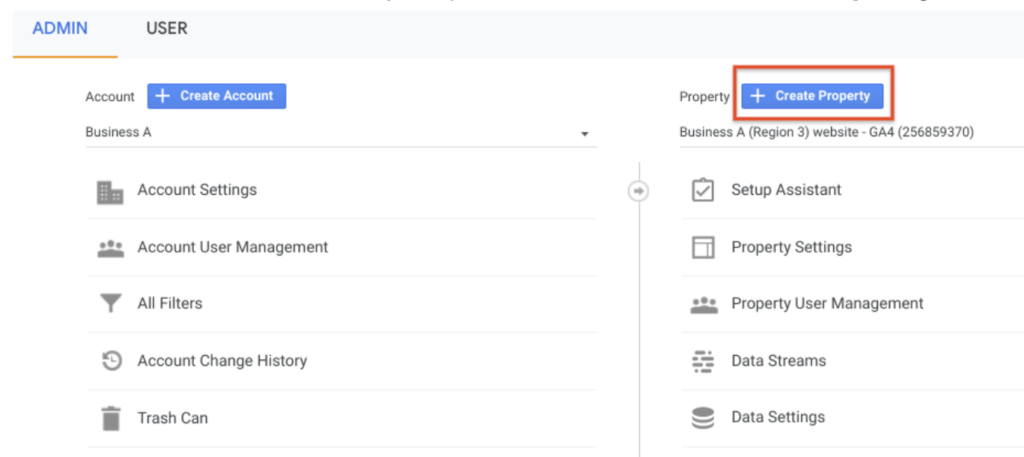
Create a new Google Analytics 4 property
To create a new GA4 property from your admin page, click Create Property in the Property column. Note: Look at the Account column to make sure that you’ve selected the right account.
Enter your business name for the new property and select the reporting time zone and currency. Changing the time zone for an existing property may give you a spike in data because of the time shift.
Select your industry category and business size. Click Next.
Choose how you want to use Google Analytics for social media to get the relevant report necessary for your goals. For example, if you choose “Generate more leads,” the reports will help you measure lead generation. And so on.
Click Create. You now have a new GA4 Property.
Add a data stream
Once you’ve created your new property, you must add data streams so the tool can track your app and website performance.
In the Property column, click Data Streams > Add stream (iOS app, Android app, or Web).

To see data in your new Google Analytics 4 property, either tag it to the website builder or to a CMS-hosted website like WordPress or Hubspot. You can also add the Google tag to your web pages directly by using Google Tag Manager.
Using a GA code
To measure your web performance data with a Google Analytics tracking code, you need to add a short JavaScript measurement code to each web page.
This code tracks and collects information on how a new user interacts with your page so you’re able to compare how different web pages are performing and make informed decisions to make changes, if necessary, to meet your targets.
Create social media conversion events in GA
Goals in Google Analytics 4 are now called conversion events. Conversion events are user activities that evaluate the effectiveness of your social and digital marketing campaigns and contribute to your success rate.
Properly configured conversion events provide critical information about your social performance. For example, measure the efficacy of your lead generation efforts by tracking how often users submit a contact form on your website.
Migrate goals to GA4 and configure your conversion events in the following ways.
Migrating goals to GA4 conversion events
To migrate your Universal Analytics goals to Google Analytics 4 conversion events, go to your Google Analytics Admin account. From the Property column, select the GA4 property set for data collection on your website. Once there, choose:
Property column > Setup Assistant > Set up conversions > click on the Actions icon > Import Universal Analytics
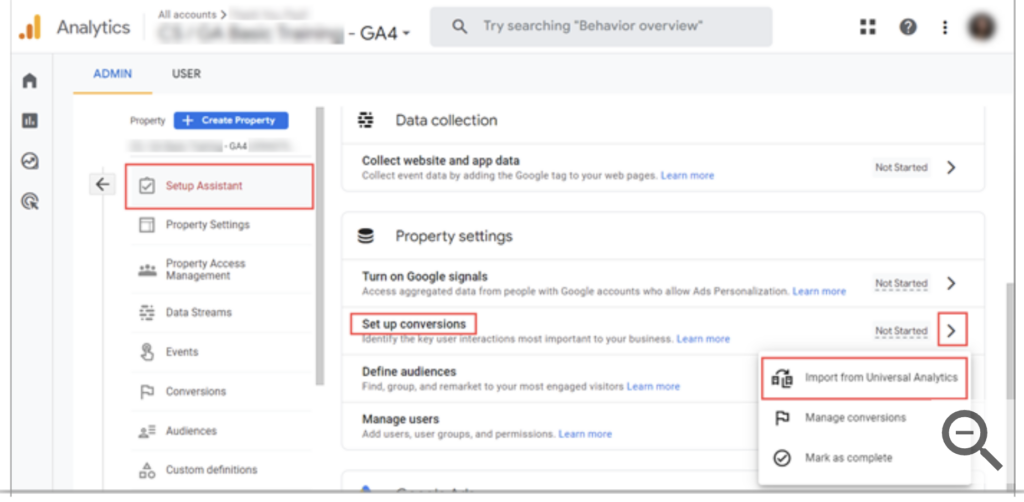
Once in the “Import existing goals from your connected property panel”, select the goals you want to recreate as conversion events in your new Google Analytics 4 property. A confirmation message will pop up when the goals you’ve selected are successfully recreated as conversion events.
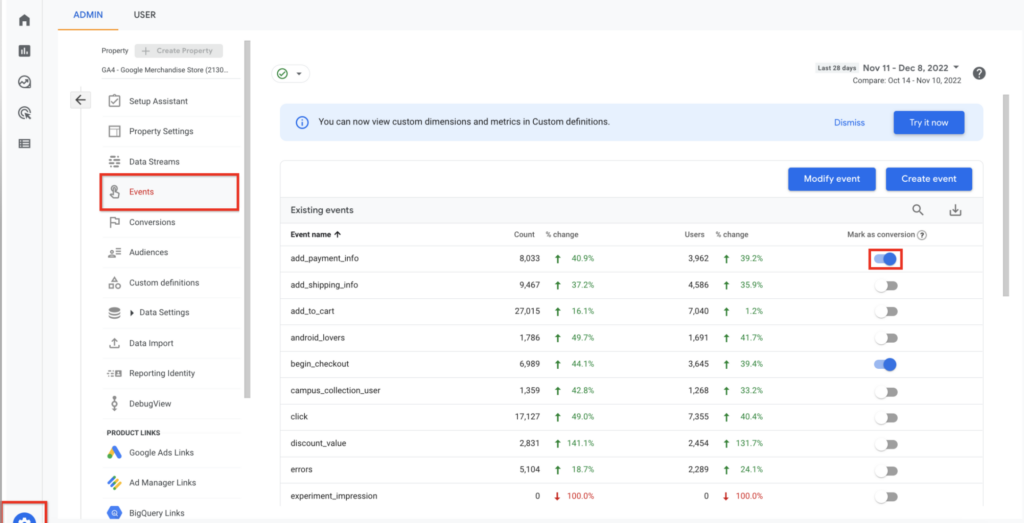
Marking events as conversions
To mark a conversion event, you need to identify an important user interaction and mark it in GA4. Examples of these could be in-app purchases, web purchases or app-store subscriptions.
To mark an existing event as a conversion, go to:
Admin > Property > Events > Existing Events > toggle “Mark as conversion”
4 social media insights to track in Google Analytics
Google Analytics for social media gives you several social insights. Here is a breakdown of the four main ones:
Audience demographics
An in-depth understanding of your target audience is critical to the success of your social campaigns and overall organizational goals. Get these insights from GA metrics for a granular view of customer demographics through the Demographic details report.
The report pulls metrics from visitors who visit your website or app and have consented to share information. It gives you key details like location, age, gender, ethnicity based on the language used and even their interests.
To get these reports, go to:
Google Analytics > Reports > User Attributes > Demographics details
You also get metrics such as the average time your site was in focus in a visitor’s browser or an app was in use on a person’s device (average engagement time). You also see new users, engaged sessions per user and new visitor count.
User acquisition from social
Get important user acquisition details from different social channels on your website to see how each channel is performing so you can allocate your budget more wisely.
Discover the types of visitors coming to your website with GA4’s User acquisition and Traffic acquisition reports, and filter them to see how many are coming from organic or paid social.
User acquisition report
The User acquisition report helps you understand how new users find your website or app for the first time. It focuses on new sessions and tells you where they originate from, regardless if the visitor is new or returning. This includes direct traffic—users who visit your website by directly entering the URL into their browser address bar.
You can get many dimensions, or attributes of your data, in this report. A dimension describes your data whereas a metric helps quantify the data. For example, a few different dimensions in the User Acquisition report are First user campaigns, First user Google Ads ad group name and First user source. When you pair these with a specific metric, like New Users, for example, you can see the number of New Users that had a “first user source” of social media before arriving at your website.
Traffic acquisition report
The Traffic acquisition report shows you where your website and app visitors are coming from, both new and returning users. In comparison, the User acquisition report only shows data on new users.
Web engagement
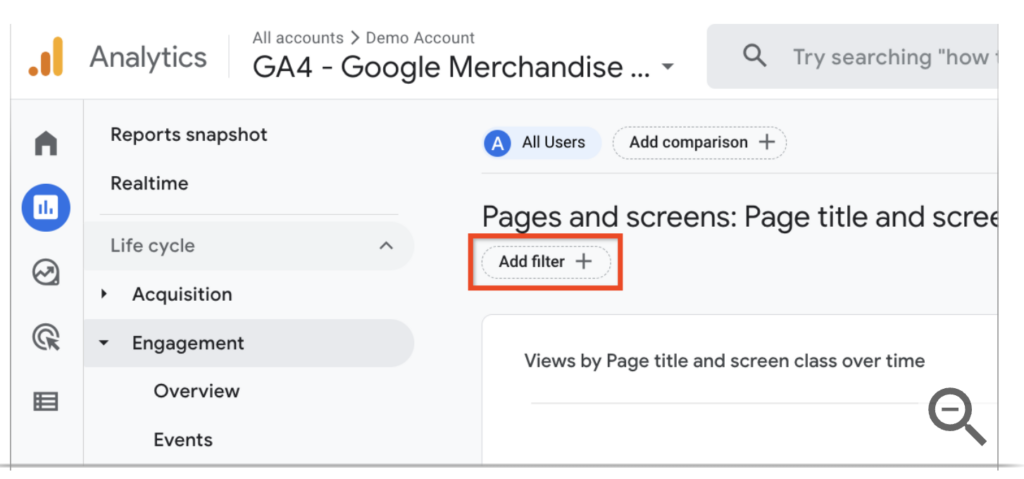
Find web engagement insights from Google Analytics for social media with the new Pages and Screens reports. These reports show the pages on your website and screens on your app people visit and engage with.
This gives you a fair idea of how visitors consume your content and interact with the website throughout the user journey.
To get these reports, go to:
Google Analytics Admin > Reports > Engagement > Pages and screens
Apply a filter to the report to view data for one page or screen and refine your analysis to find trends in factors such as ad units, regional performance and others essential for your goals. Also, get real-time reports and summary cards.
Web engagement reports help you identify the actions a user takes after visiting a page or screen. This lets you measure its impact on conversions and revenue.
When you create the user path exploration and select the page or screen as your starting point, you’ll get the top five pages or screens your users viewed after the first-contact page or screen.
This will give you a clear view of how impactful your content and social tactics are and where you need to make adjustments to boost effectiveness.
Conversions and conversion paths
Conversion and conversion paths reports in Google Analytics enable you to troubleshoot website and content performance and track trend declines. These metrics, when represented on a social media dashboard, quantify your team’s performance across social channels and accounts clearly. Here’s a closer look.
Conversion reports
The Conversions report gives you information about each conversion event caused by a trigger so you understand the impact of your social marketing on your conversion rate. These conversions could be from lead form submissions, email subscriptions, unique page views or sessions and even sales.
To get conversion reports, go to:
Google Analytics Admin > Reports > Engagement > Conversions
Another important Google Analytics feature for social media reports is the Conversion path report.
Conversion paths reports give you an insight into your customers’ paths to conversion, and how different attribution models played a role in those paths. Get clearly demarcated data visuals to quickly see which social channels are working best to initiate, help and close conversions.
Metrics include Conversions, Purchase revenue, Days to conversion and Touchpoints to conversion.
To get these conversion path reports, go to:
Google Analytics Admin > Advertising > Attribution > Conversion paths
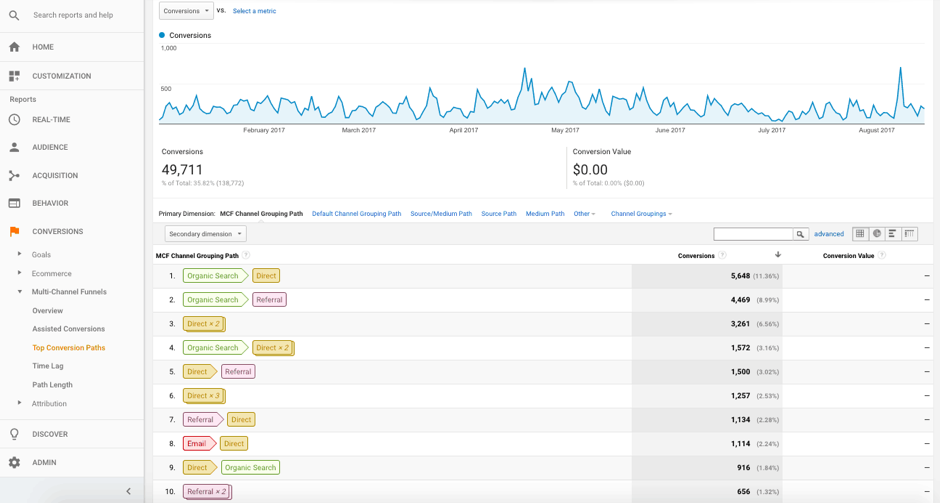
Top conversion paths
Among the many filters at your disposal, Top Conversion paths is the most insightful.
These reports help you identify all the social media platforms driving visits to your website. You understand the path your users take before they convert and see the frequency of conversions from each path.
This gives you a fair understanding of how well your social media marketing is working in terms of leading visitors down the sales funnel.
Harness social reporting to elevate your marketing efforts
Social media is all about connecting with your audience and building a solid brand presence, regardless of your industry. Metrics from Google Analytics help you harness this power to build, measure and track impactful strategies for social media and marketing. Thoughtfully showcasing these insights to share how social impacts your organization with your leaders and other team is therefore critical to secure executive buy-in.
Present your findings in a meaningful way to reap the benefits of your hard work. Use this toolkit for templates and resources to build a compelling narrative for your social reporting.

Share