How to analyze Twitter data for actionable insights

Written by Alex York
Published on November 4, 2025
Reading time 11 minutes

Table of Contents
With a 280-character limit, it’s easy to think of X (formerly known as Twitter) as a basic platform. But top marketers see success by looking beyond the feed and digging into the massive, real-time stream of Twitter data to inform their social media strategies.
But Twitter data means more than just your own posts and impressions of your Twitter analytics. It’s a vast landscape of public conversations, audience demographics, content performance and emerging trends.
A common problem for companies is they don’t know the best route to take when analyzing this massive volume of information. This means brands struggle to understand why a piece of content performed well or fell flat, what their audience truly thinks, or how their competitors are positioning themselves.
That’s why brands are turning to social data as a key source of business intelligence—one that supports marketing decisions and provides crucial insights across the organization. Understanding how to analyze Twitter data thoroughly helps keep your brand out of the dark.
What are Twitter analytics?
Twitter analytics is a set of comprehensive performance measurements that track how your content performs on X (formerly Twitter). These analytics include engagement metrics (likes, reposts, replies), reach data (impressions, profile visits), audience demographics and conversion tracking that reveals which posts drive website traffic and business outcomes.
Understanding these analytics is the first step to refining your strategy, proving your impact and driving real business results from the platform. The data you collect shows you how a campaign performed and what trends to follow in the future.
The social media landscape is always shifting, and X is no exception. The platform has updated its analytics features, which changes how some data is accessed and displayed.
Staying on top of these updates ensures your reporting is accurate and your strategy remains effective. This guide covers what you need to know right now to navigate X’s analytics successfully.
What is Twitter data?
Twitter data is a broad term for the vast amount of information generated on the X platform. While this sounds vague, it’s because the data can be grouped into three main categories:
- Public and API data: This is all the public-facing content on the platform: every post, reply, profile and hashtag. Developers, researchers and analytics tools like Sprout Social use the X API to access and analyze this data for large-scale trends, brand sentiment and competitive insights.
- User archive data: This is a user’s personal data. As a user, you can request a “Your X archive” file, which contains your entire post history, account details and more. This is primarily for personal record-keeping.
- Performance and analytics data: This is the most valuable category for marketers. It’s the set of metrics that measures how your content performs, who your audience is, and how your account is growing.
For the purpose of this guide, when we refer to using Twitter data, we are focusing on how marketers can leverage both public/API data for insights and performance data for strategy.
With this combined information, you can know audience demographics, track clicks on your profile or monitor brand health—not just how many people saw your post. This is just the tip of the iceberg, but understanding how to analyze this specific data allows you to find patterns and improve your content.
How to Measure Twitter Data
You can access and measure your Twitter data through a few different avenues. Depending how robust you want your analytics, there are diverse options to give you oversight or in-depth analysis.
In this article, we’ll talk about the two ways we recommend pulling and measuring your Twitter data for marketing: the native X Premium Analytics tool and Sprout’s advanced analytics suite.
How to use X’s native analytics tool
X’s built-in analytics tool, now part of the Premium subscription, gives you access to additional data beyond shares, likes and reposts. The platform has consolidated its data into a 6-tab dashboard, making it easier for marketers to track performance and optimize social strategies.
As of now, X Premium Analytics breaks up your data into six main sections:
1. Account Overview
This is your high-level Twitter dashboard, typically showing a 7-day summary of your account’s performance. It’s designed to give you a quick, at-a-glance look at your most important metrics and how they’re trending. You can expand your view to a specific date range or preset 7-day, 2- or 4-week, 3-month or 1-year options.
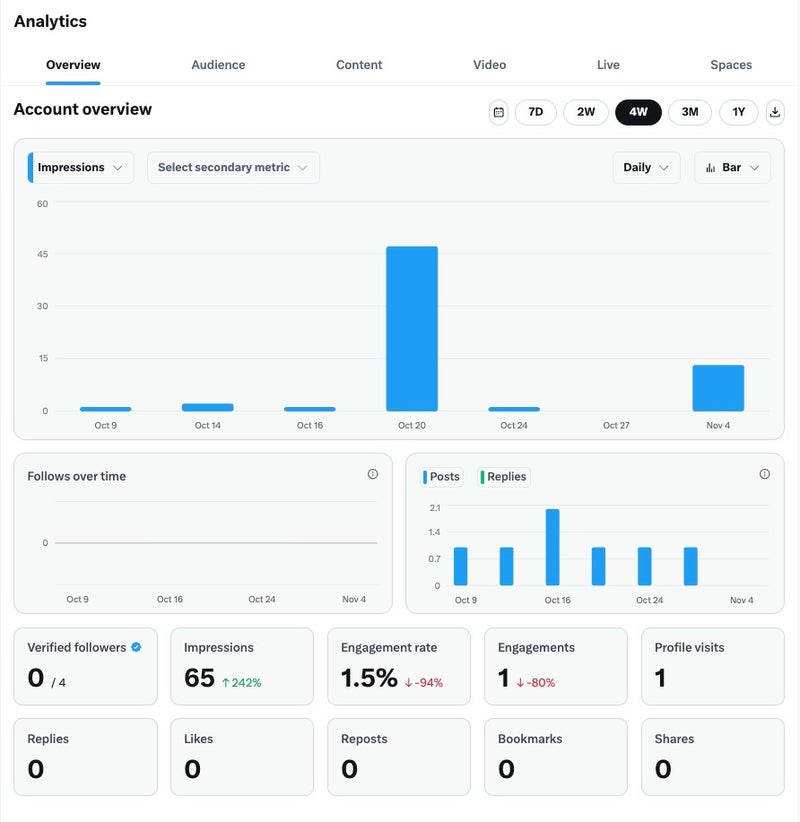
Key Twitter data metrics you can find on the Overview tab includes:
- Posts: Total number of posts you sent.
- Post impressions: Total number of times a user was served your posts in their timeline or search results (including whether it was seen or not).
- Profile visits: Total number of times your profile was viewed.
- Replies: Total number of replies your posts have had by other users.
- Engagements: Total number of interactions your posts have had.
- Followers: Total number of followers, plus how many new followers you’ve gained since the previous period.
In the Overview tab, you can combine a primary metric with a secondary metric to compare growth and correlation of data.
2. Audience Insights
The Audience Insights tab is crucial for understanding who your followers are, not just what they like. While it can take time to populate this data, it provides valuable demographic and behavioral insights.
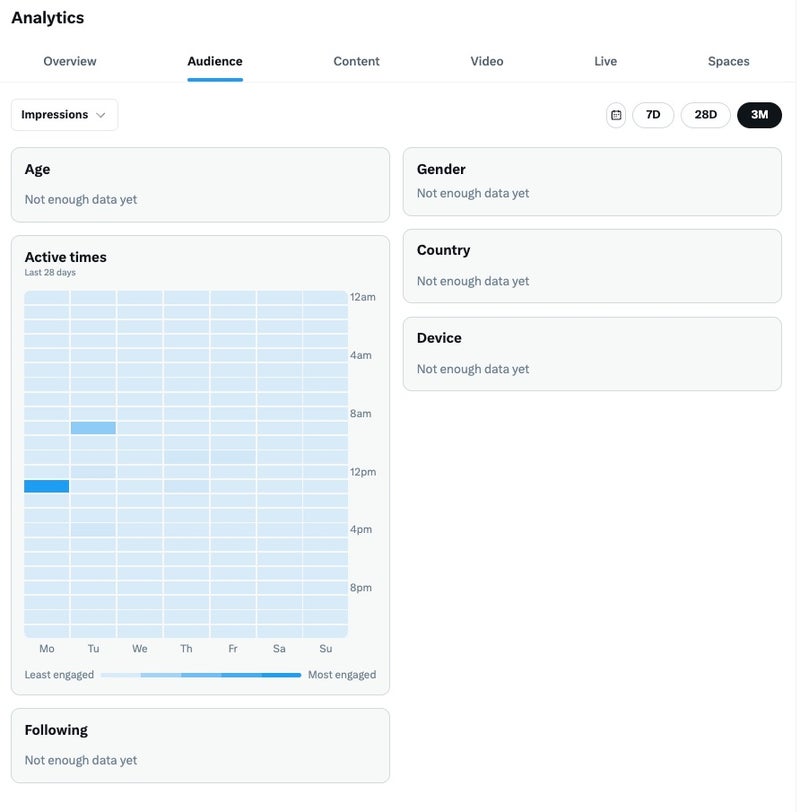
The Twitter data in this section include:
- Demographics: See breakdowns of your audience by Age, Gender, Country and Device (iOS, Android, etc.).
- Active Times: A heatmap that shows the days and times your followers are most active and engaged on X. You can use this to optimize your posting schedule.
- Following: Data on your follower-to-following ratio and growth trends.
Use this information to your advantage and know what type of content resonates the best with your audience.
3. Content Insights
The Content tab in X Premium Analytics provides a complete feed of your recent posts, allowing you to sort them by performance. This is where you’ll spend most of your time analyzing post-by-post success.
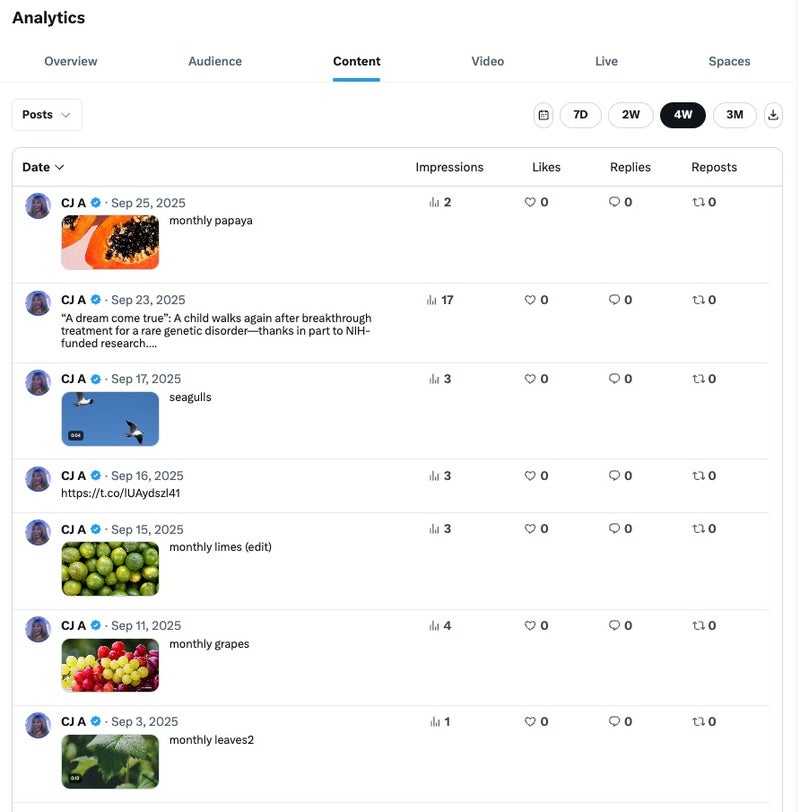
You can click on any individual post to get a detailed Post Analytics view.
Content activity gives you a broad view of the individual posts and their impressions, likes, replies and reposts for a specific day or time period. Through the Content section, you can also export the data from your Twitter profile to a CSV file and choose your specific timeframe.
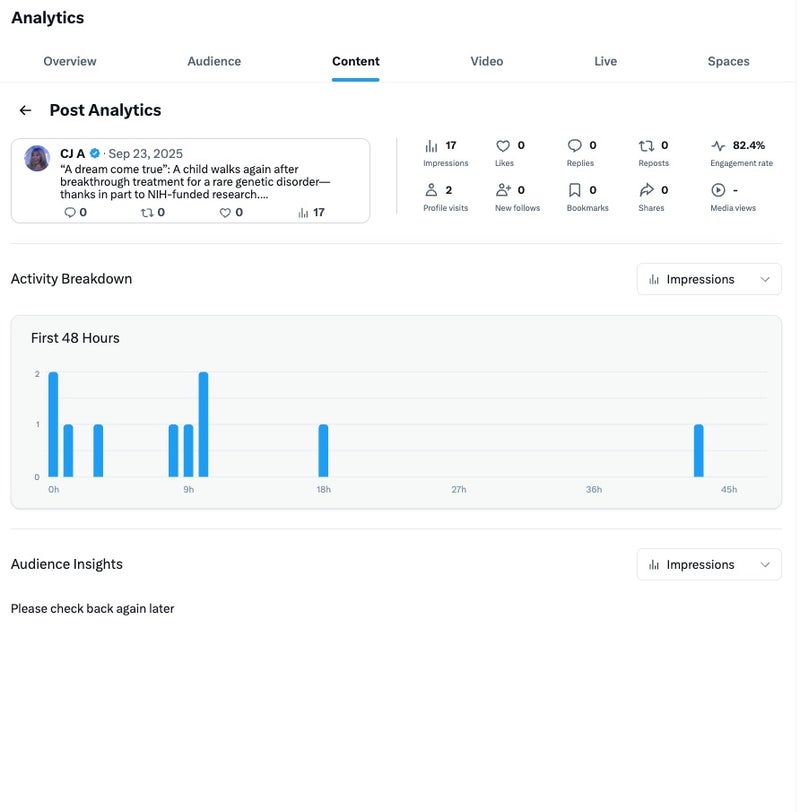
The main Post Analytics drill-down (as seen in your screenshot) includes:
- Top-line metrics:
- Impressions
- Engagement rate
- Likes
- Replies
- Reposts
- Detailed outcomes:
- Profile visits: How many people clicked your name or avatar from that post.
- New followers: The number of accounts that followed you directly from that post.
- Bookmarks: How many users saved your post.
- Shares: The number of times your post was shared.
- Media views: (If applicable) How many views your video or image received.
- Activity Breakdown: A 48-hour graph showing the lifecycle of your post, so you can see when it gained the most traction.
4. Video Insights
The Video Insights dashboard is dedicated entirely to your video content performance. It helps you understand not just how many people saw your video, but how long they watched.
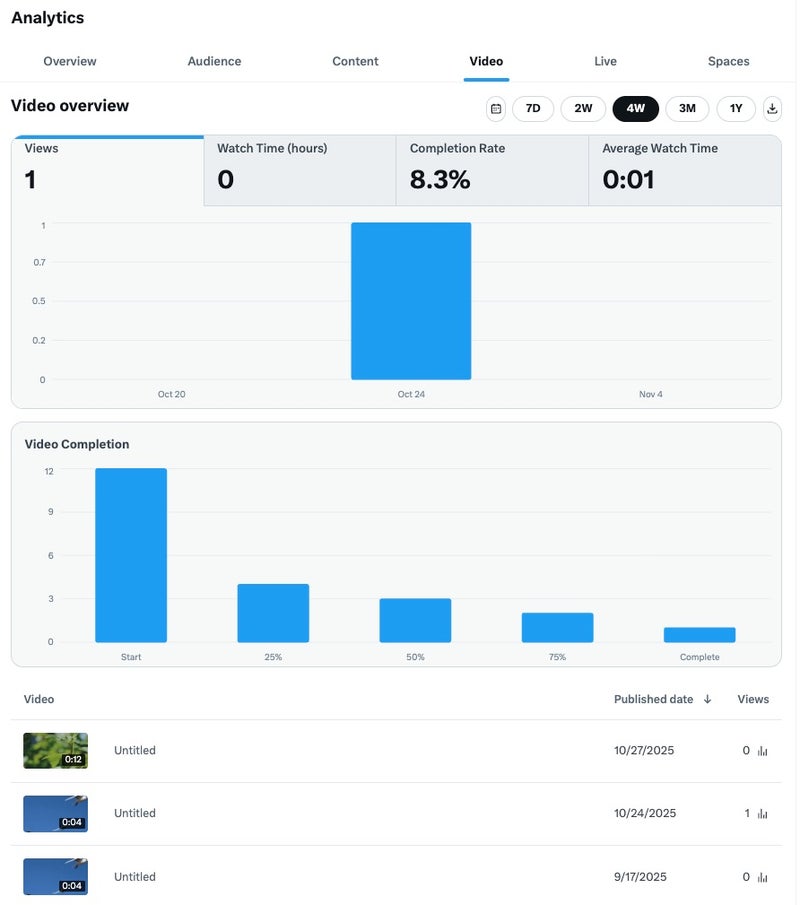
Whether it’s promoted or standard video, this is absolutely critical to measuring your social media video process.
Key metrics in the Video overview tab on X Premium Analytics include:
- Views: Total number of video views.
- Watch Time (hours): The cumulative time people spent watching your videos.
- Completion Rate: The average percentage of your video that users watched. This is a critical metric for understanding audience retention.
- Average Watch Time: The average duration a user spent watching a video.
This tab also features a Video Completion funnel, showing you the drop-off rate at the Start, 25%, 50%, 75% and Complete milestones.
5. Live Insights
If you use X Live for broadcasts, the Live tab will house all your performance data.
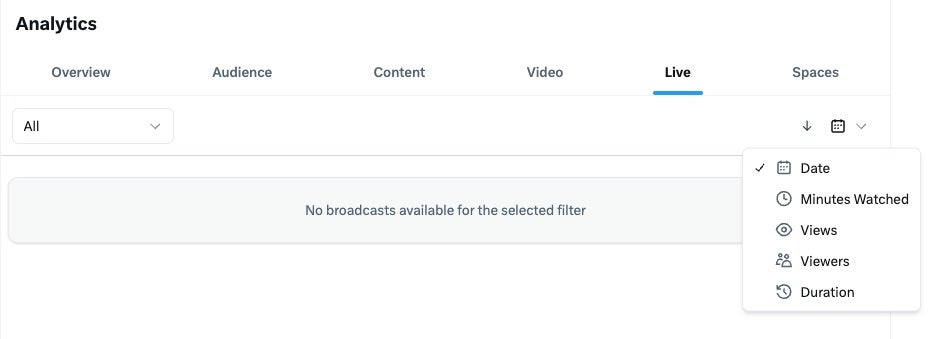
While the dashboard will show “No broadcasts available” if you don’t use the feature, the available data points include:
- Minutes Watched
- Views
- Viewers (Peak concurrent viewers)
- Duration
6. Spaces Insights
Similarly, the Spaces tab is dedicated to your X Spaces (live audio rooms). It allows you to analyze the success of your audio content and see who is participating.
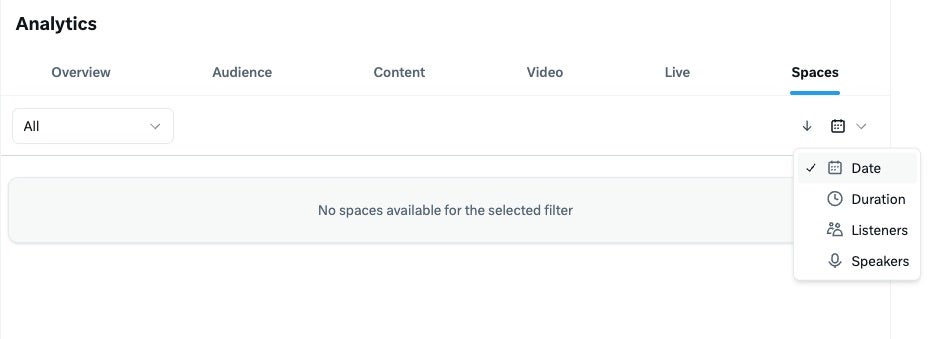
The key metrics it tracks are:
- Duration
- Listeners (Total and peak live listeners)
- Speakers (Who spoke and for how long)
Key Twitter metrics that matter for business
Not every metric deserves your attention. The difference between a data-informed strategy and getting lost in the numbers comes down to focusing on metrics that align with your business outcomes.
Here’s what you need to track, grouped by your strategic goals:
Metrics for brand awareness
- Impressions: The total number of times your post was served. This is your core metric for content visibility.
- Reach: The number of unique users who saw your post. This measures the breadth of your audience.
- Follower growth rate: Indicates brand health and the effectiveness of your content strategy at attracting new followers.
Metrics for audience engagement
- Engagement rate: Measures content appeal by dividing total engagements (likes, replies, reposts, etc.) by impressions. This is your north star for content quality.
- Replies and reposts: Show that your content is valuable enough to spark conversation or be shared.
Metrics for driving action and conversions
- Click-through rate (CTR): Reveals how effectively your content drives action (e.g., website visits, downloads) by dividing link clicks by impressions.
- Post link clicks: The raw number of clicks on your links, crucial for lead generation and traffic-focused campaigns.
Metrics for customer care and brand health
- Response metrics: Measures customer experience through your average response time and response rate.
- Sentiment via Listening tools: Tracks the overall tone (positive, negative, neutral) of public conversations about your brand, products, or competitors.
Align your measurement strategy with your objectives. This turns Twitter data into a competitive advantage.
Using Sprout Social’s Twitter Analytics Tools
Even though Twitter stepped up its analytics game, Sprout Social lets marketers go above and beyond. Through our powerful Twitter analytics tools, social businesses gain deep insights into keyword, demographic and hashtags analytics.
One of our most robust tools included in our suite is the Twitter Profiles Report. This presentation-ready Twitter report goes the extra mile with tackling Twitter data from one or multiple profiles so you can extract actionable insights for multiple teams across your business.
Do you know how well your content is performing? Are users engaging with your posts? Have new users responded to your content? These are all important questions you should ask yourself about your Twitter data.
Twitter Performance Summary
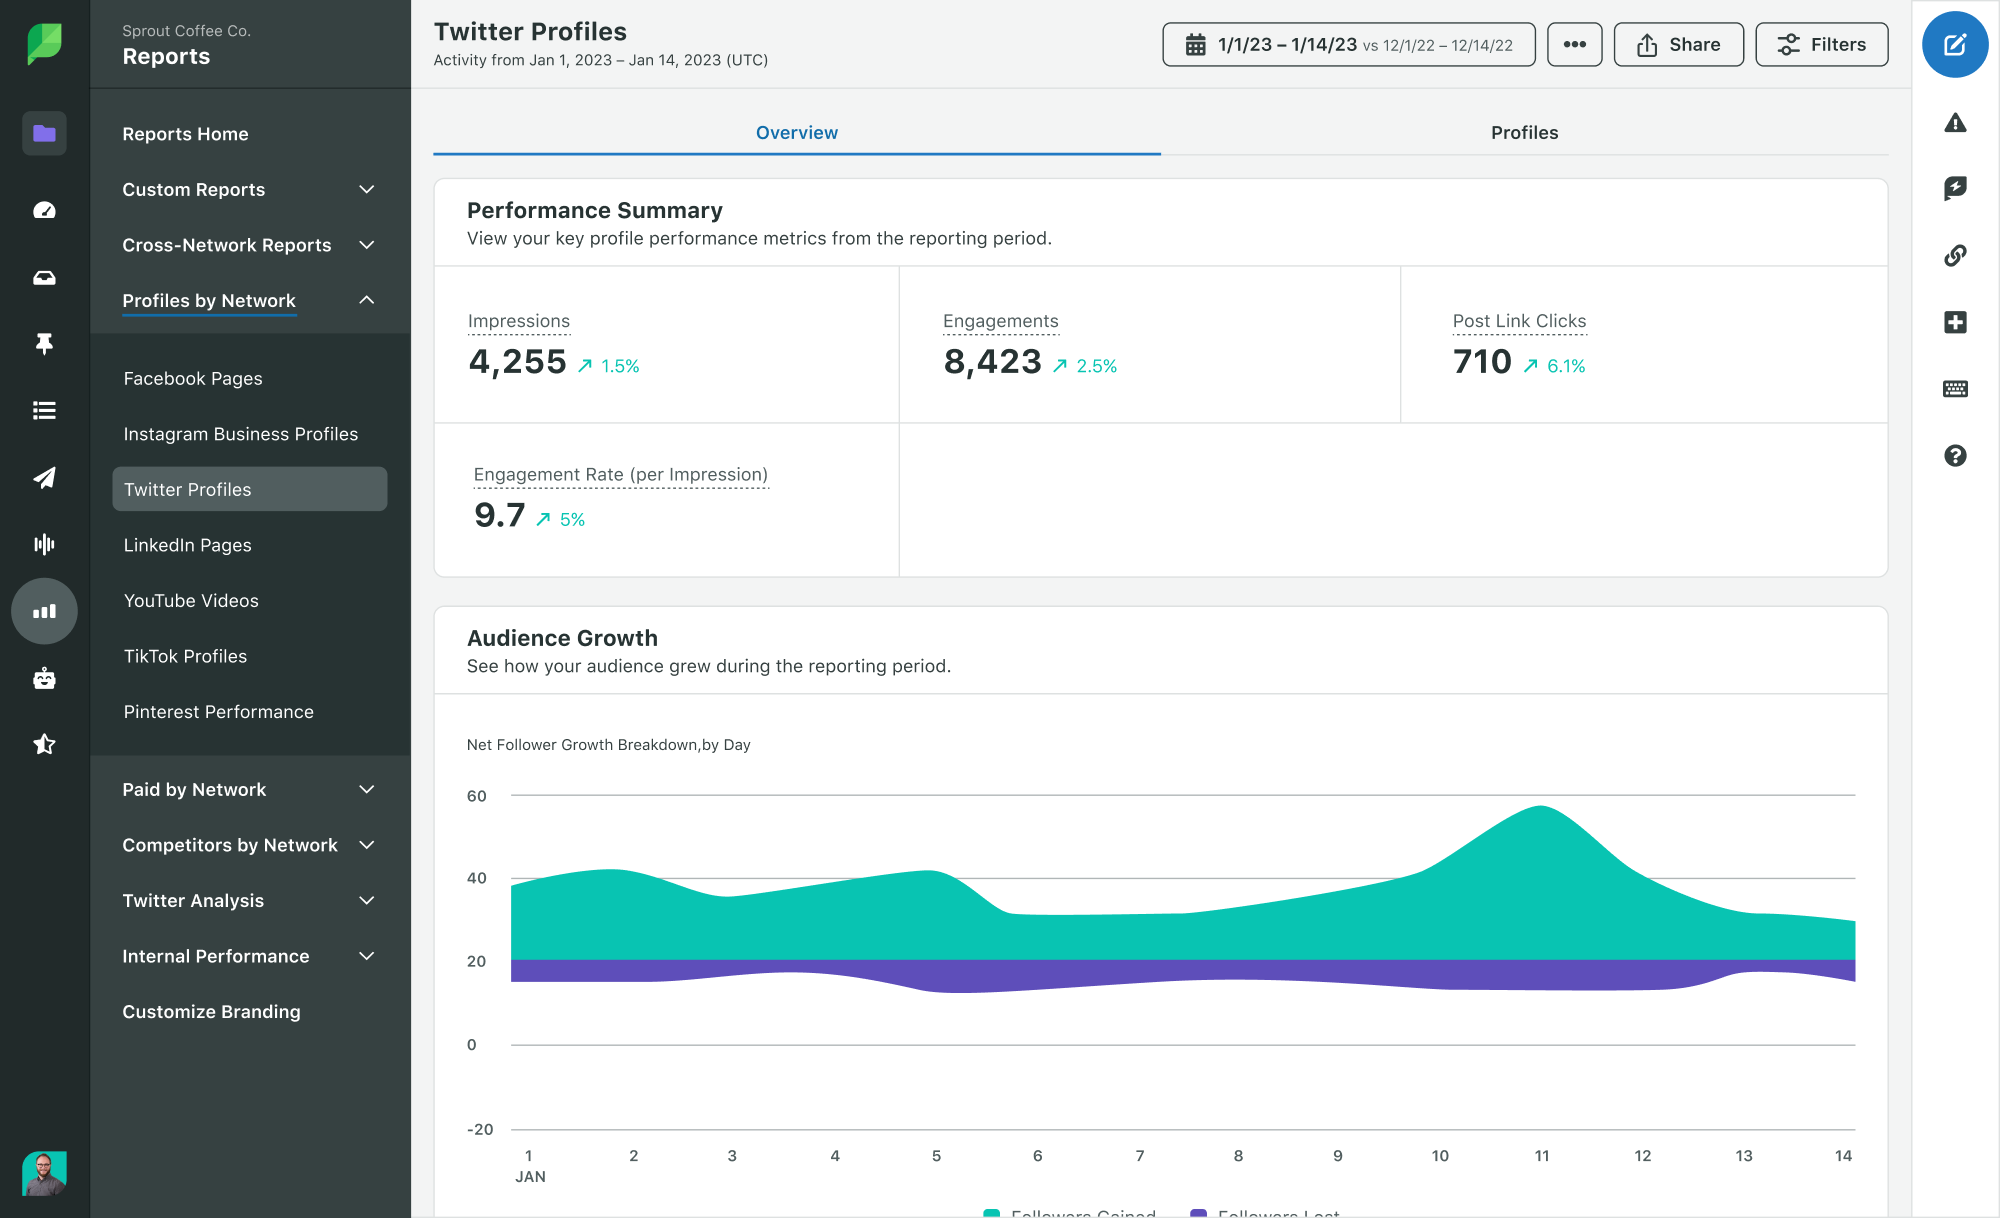
Sprout Social’s Twitter Performance Summary provides key statistics at a glance in your selected report time frame. For the Twitter profiles you select you can view:
- Organic Impressions
- Engagements
- Post Link Clicks
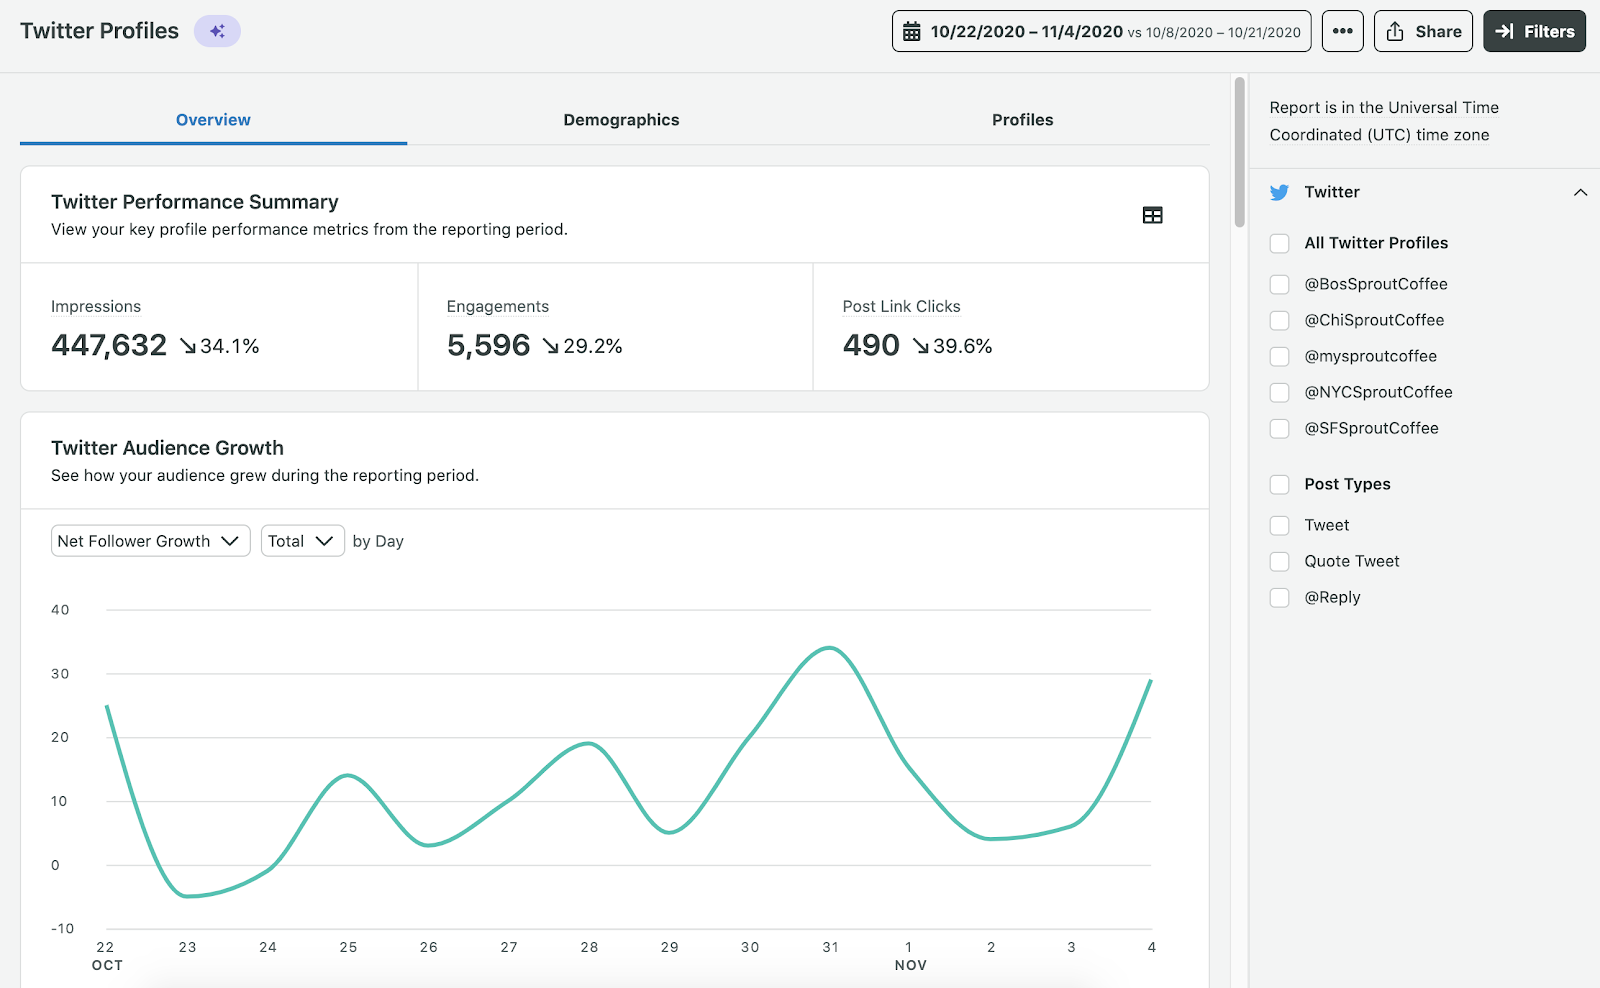
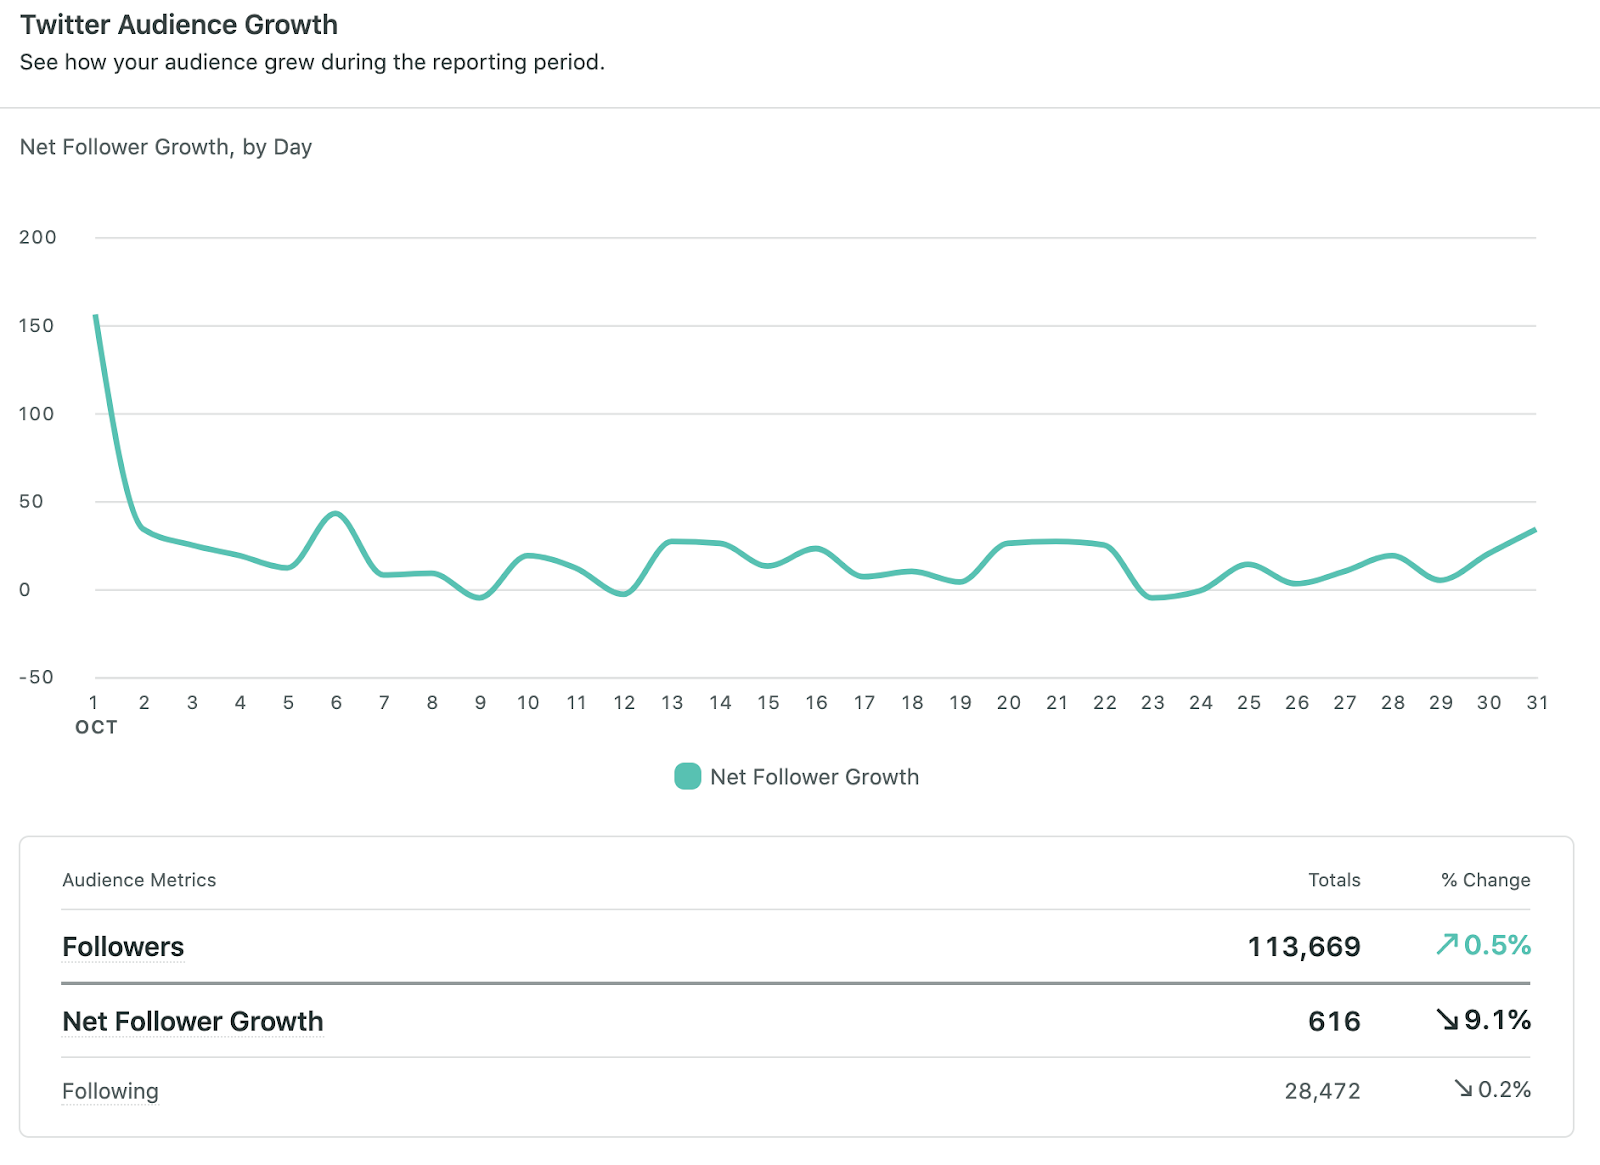
Audience Growth
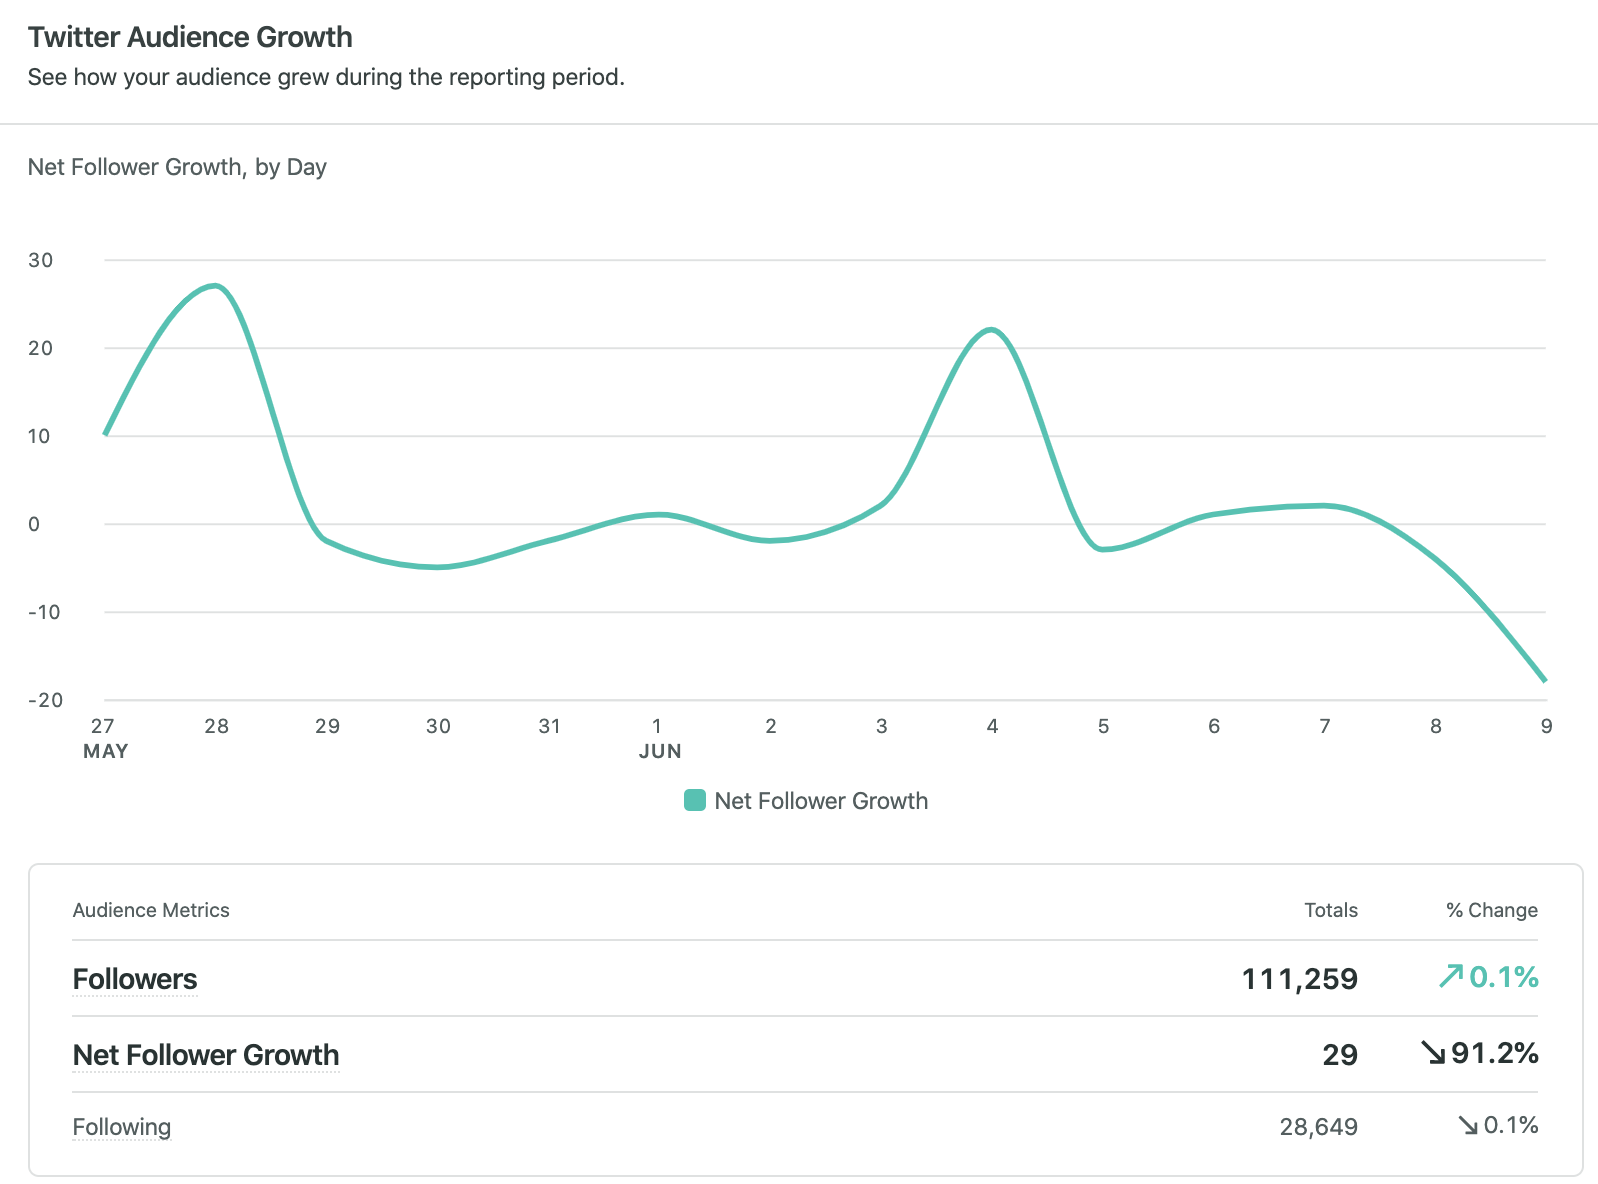
This section breaks down your follower growth during a selected time frame. Measuring your audience can help you plan new content strategies to reach out to more people.
Look for similarities in content published and audience peaks in this report to better plan your posts. You can get details of important Twitter metrics such as:
- Followers: Total amount of Twitter followers you had on the last day of the reporting period.
- Net Follower Growth: The net number of Twitter followers you acquired during the reporting period.
- Following: Total number of users you’re following on Twitter on the last day of the reporting period.
Twitter Publishing Behavior
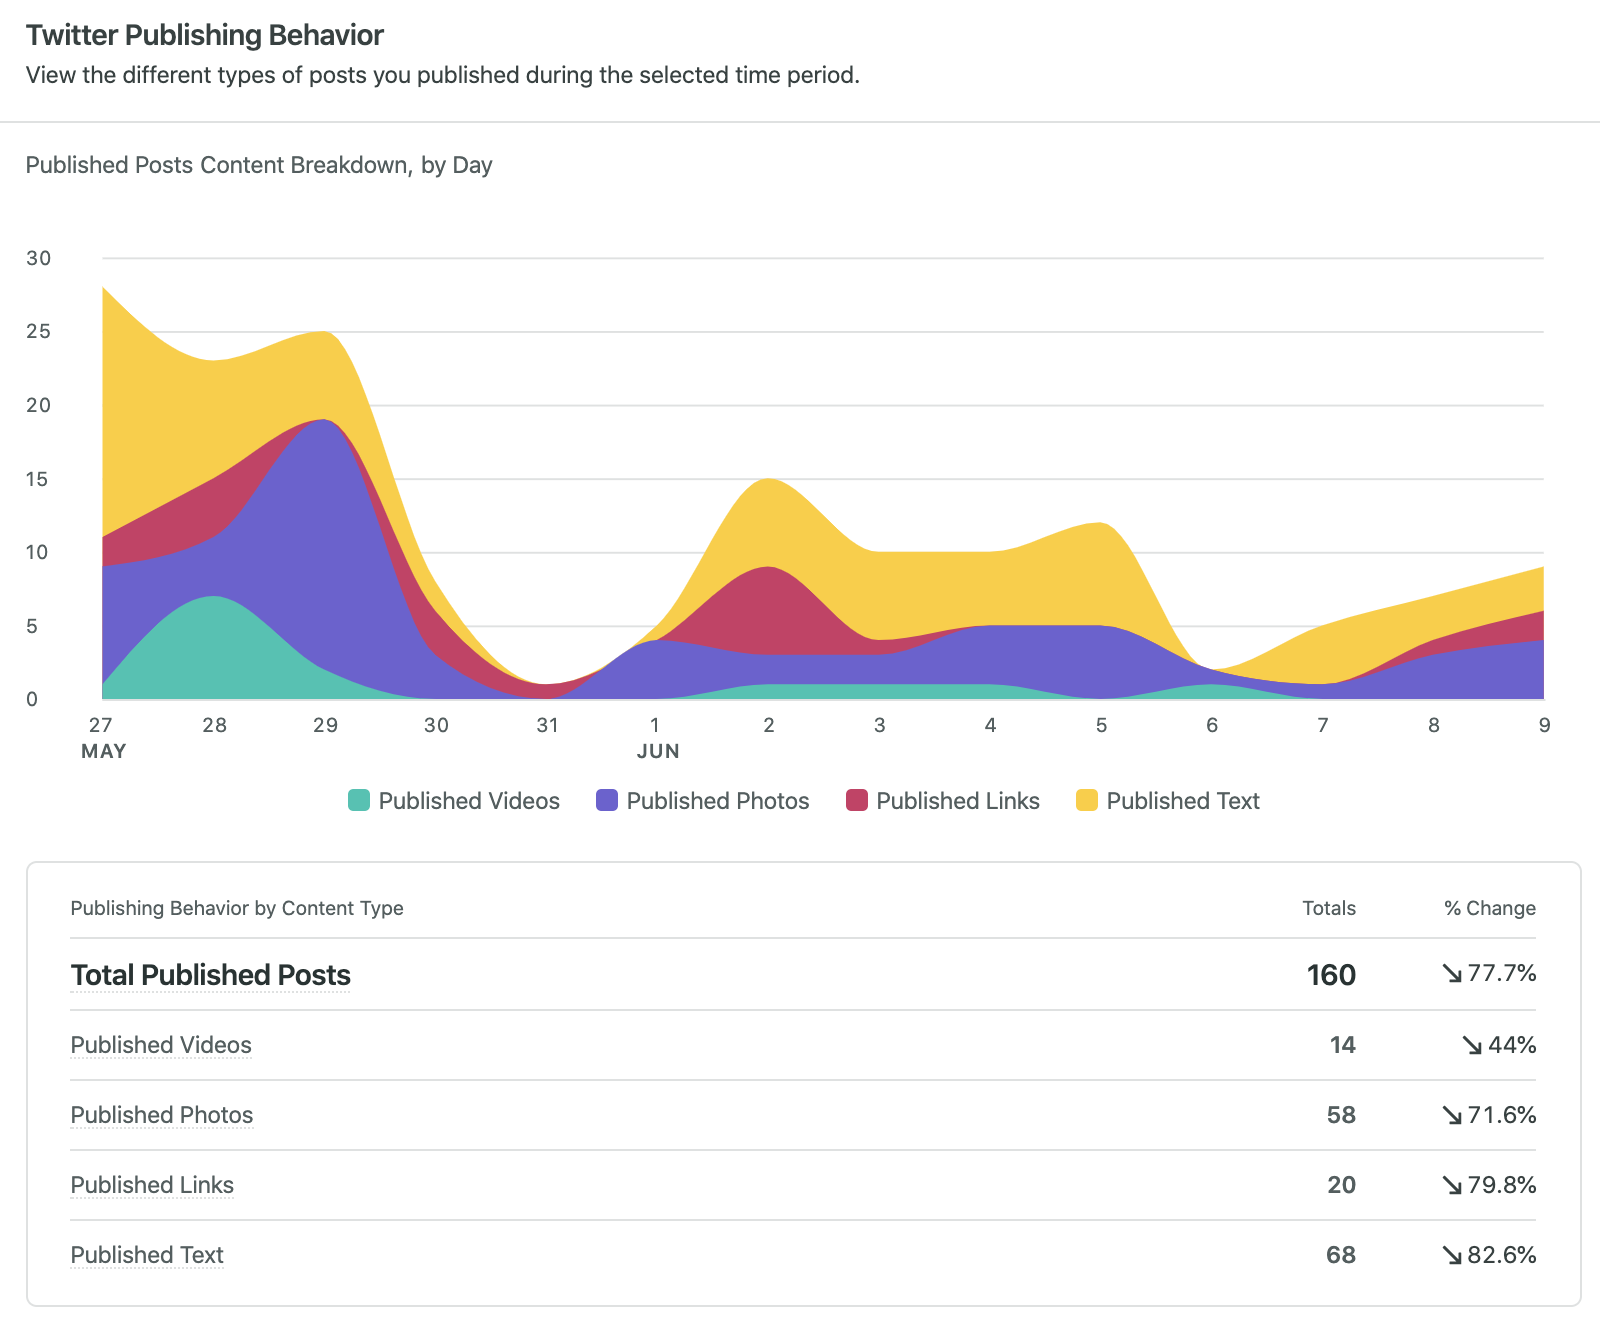
In the Publishing Behavior section, you can see the different types of posts you published during the time period you selected. Dive in and see the total number of video, photo, link and text posts for your reporting period.
Your Top Posts
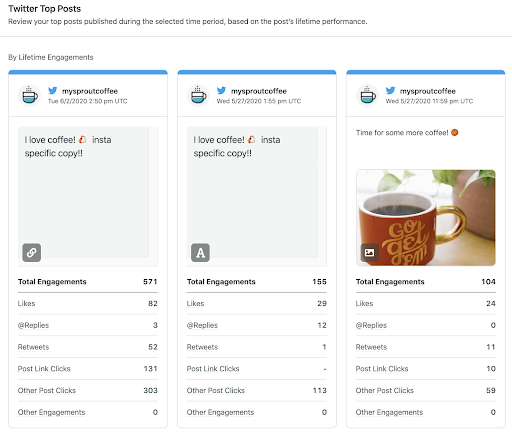
Every second, people send 6,000 posts on Twitter. This equals roughly 500 million posts per day.
But how do you know which of your posts are performing best? In the Twitter Top Posts section, you can quickly review the top posts published during your reporting period.
You’ll get better insight on how many likes, replies and reposts each post received. This supports your future decisions on how to structure posts and what types of content your audiences engage with the most.
Twitter Impressions
If you want to get more granular, the Twitter Impressions section of the report provides you with a high-level overview of the amount of impressions your posts received per day for the reporting period.
You can see how many times your content was viewed by the Twitter community and compare these impressions to your engagement to better optimize your social strategy.
Twitter Engagement
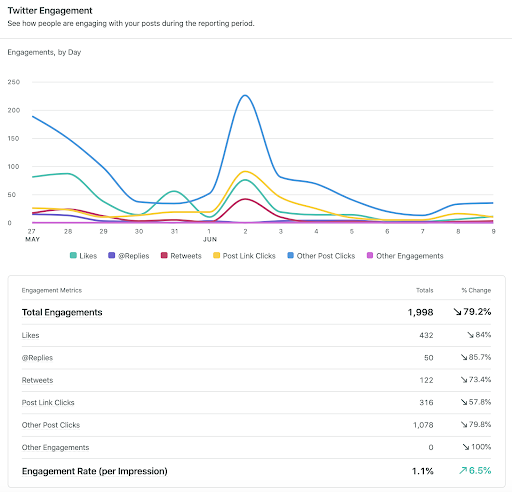
Sprout helps you visualize Twitter trends with unique audience engagement metrics. Unlike Twitter’s audience reporting, you’ll dig deeper with Sprout’s custom reporting on things like:
- Likes
- Replies
- Reposts
- Post Link Clicks
- Other Post Clicks
- Other Engagements
- Engagement Rate per Impression
With custom date ranges, you can get more information on your audience engagement Twitter data. This will help your brand know what specific time periods drove the most engagement and reach with your audience.
Audience Demographics
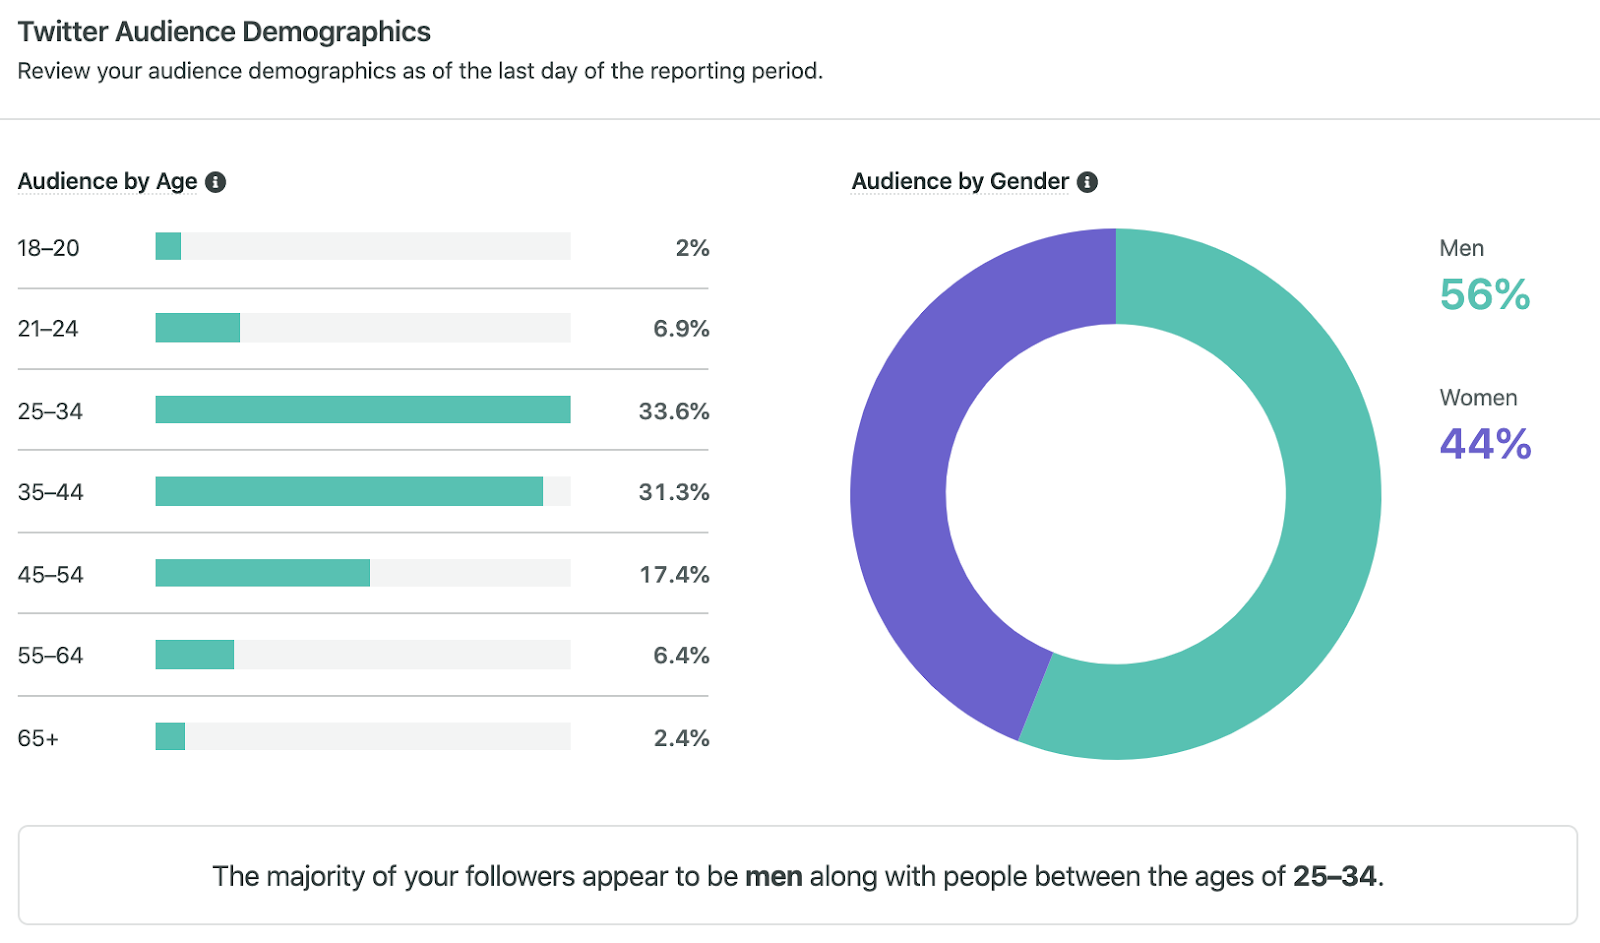
Instead of switching between different Twitter profiles and analytics tabs, Sprout provides your audience demographics all within the same report. Make sure you know what audience you’re effectively reaching to better promote and market your content.
Twitter Stats by Profile
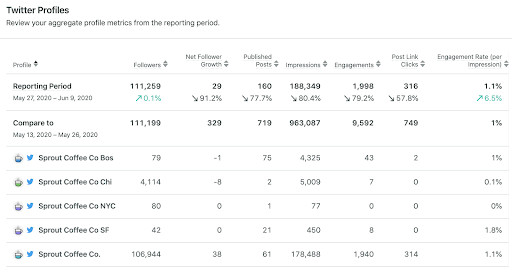
If you have multiple Twitter accounts for your brand, it’s nice to see how each profile stacks up against one another with basic Twitter metrics. With the Twitter Profiles section of the report, you get a top-level view of your Twitter data per profile such as: followers, net follower growth, engagements and total impressions.
Twitter analytics best practices
Having access to data is one thing. Turning that data into competitive advantage is another.
Here’s how successful brands approach Twitter analytics to drive consistent results.
1. Set clear, measurable goals.
Start with your business objectives, then work backward to identify the Twitter metrics that align. Want to drive website traffic? Track CTR. Building brand awareness? Focus on reach. Trying to improve customer satisfaction? Monitor response times and sentiment.
2. Establish a consistent reporting cadence
Daily check-ins spot immediate issues. Weekly deep-dives reveal emerging patterns. Monthly and quarterly reviews connect your Twitter performance to larger business outcomes.
3. Benchmark performance over time
A single metric means nothing without context. Compare week-over-week, month-over-month, and year-over-year to identify genuine trends. Also, benchmark your performance against competitors and industry averages.
4. Test, measure and optimize
Use your analytics to run controlled experiments. Try different posting times, content formats or messaging approaches. Track the results. Keep what works, discard what doesn’t.
5. Connect Twitter metrics to business outcomes
Your executives care about revenue, customer acquisition costs and brand equity. Use your social media data to build the bridge between social metrics like engagement and business results like leads and sales. This is how you prove ROI.
Take your Twitter analytics to the next level
You’re now equipped to move beyond surface-level metrics and start analyzing Twitter data with purpose. The insights you uncover don’t just sharpen your content strategy—they demonstrate the undeniable value of social to your entire organization.
Marketing executives don’t want to waste money on something that is hard to prove profitable. Collecting, measuring and analyzing the right Twitter data with a powerful tool is how you back up your social media marketing efforts with in-depth analytics and prove ROI.
But the truth is native Twitter analytics only take you so far. Limited historical data, basic reporting capabilities and time-consuming manual processes hold teams back from the speed and sophistication today’s market demands.
Sprout’s Smart Inbox centralizes all Twitter interactions, while our Advanced Analytics provide unlimited historical data and automated report generation.
The most successful brands on Twitter aren’t just collecting data—they’re turning insights into action with platforms built for scale.
Ready to see how Sprout Social’s comprehensive analytics suite transforms your Twitter strategy? Start a free trial to explore the platform’s features.
FAQs about Twitter data
How long does Twitter store analytics data?
Native Twitter analytics typically provides access to data for a limited time period, often restricting historical access to just the past 90 days. For comprehensive historical analysis, a platform like Sprout Social stores your Twitter data indefinitely once your profiles are connected.
Can I export Twitter analytics data for reports?
Yes, you can export data from both native analytics and third-party tools. Sprout Social simplifies this with customizable, presentation-ready reports that are easily shareable, saving hours of manual work in spreadsheets.
What's the difference between impressions and reach on Twitter?
Impressions represent the total number of times your Tweet appears on timelines or in search—this includes multiple views from the same person. Reach measures the number of unique users who saw your Tweet.
How often should I check Twitter analytics?
The ideal frequency depends on your goals. We recommend a quick daily check-in on key metrics to catch immediate issues. Conduct a more in-depth weekly or monthly review to analyze trends and inform your upcoming content strategy.

Share