36 essential Instagram metrics to measure performance in 2025

Written by Savanna Sargent
Published on July 7, 2025
Reading time 11 minutes

Table of Contents
The only constant in life is change, and that’s especially true for social networks. Meta in particular is no stranger to evolving their networks, and Instagram in particular is doubling down on creators.
Instagram made a significant shift in how it measures and displays content reach, moving away from the long-standing “impressions” and “plays” metrics to a new, universal “views” metric. This update also includes renaming “plays” to “views”, and applies across all content types, making views the primary metric shown in dashboards and Instagram analytics tools. The aim is to better enable creators in particular to track and measure their success.
This change reflects Meta’s intent to provide a clearer, more unified picture of how often content is actually seen or played, regardless of format—offering brands and creators a more granular look at true audience engagement.
As brands adjust to this new measurement standard, understanding which Instagram metrics to track—and how to interpret them—has never been more important for evaluating content performance and refining social strategies. This article will walk you through what ‘views’ actually mean and 36 other Instagram metrics you can track.
What are Instagram metrics?
Instagram metrics are measurements of performance that help you gauge how your Instagram content is doing and how your audience is responding to it. Instagram metrics include how many people viewed, interacted with and liked your content.
We’ll talk about specific social metrics later on, but some of the key Instagram metrics you should be measuring include reach, impressions, engagement rate and follower growth.
Why you should track your Instagram metrics
If you manage your Instagram account without ever looking at your social media analytics, you’ll be left in the dark when it comes to understanding the results of your efforts.
These efforts likely coincide with company or department goals (or even just your own Instagram KPIs), which will naturally help inform which Instagram metrics you should be reporting on.
Therefore, when answering the “why,” you’ll also reveal your key IG metrics to report on. Here are three reasons why you should be tracking your Instagram metrics.
Instagram metrics show which content your audience prefers
If you’re testing different types of content, you need to check out your post metrics to see which types are getting the most attention. Having this knowledge helps you create an Instagram content strategy that resonates with your audience by consistently posting their preferred types of content.
Instagram metrics keep your strategy in line with company objectives
If your current goals are to increase your company’s engagement, you’ll want to make sure you’re actually making that happen. Same goes for if you’re wanting to increase views or post traffic. You need to be able to check the metrics to measure growth to see if you’re hitting your KPIs.
Instagram metrics help you measure specific campaign success
If you’re running a major campaign on Instagram (let’s say for a product launch, holiday sale or important partnership), you want to know how well the campaign is performing. Your Instagram metrics let you see this so you know if you need to adjust your messaging or not.
How to track Instagram metrics
In order to view insights and metrics on Instagram, you need to have an Instagram business or creator account. Once you have a business account you can view Instagram metrics on a social media marketing platform like Sprout Social or natively via the app.
How to track Instagram metrics using Sprout Social
Sprout Social makes it easy to track your performance with clean, visual reports.
From an overview of reach and engagement to follower growth to post-level breakdowns, all your data is laid out in a way that’s easy to understand and act on.
Below is a quick step-by-step for accessing your Instagram metrics in Sprout.
Step 1: Don’t have a Sprout Social account? No problem, start a free 30-day trial with your business email (you don’t need a credit card).
Step 2: Log into Sprout Social, click on Connect a Profile on the right and select Instagram.
Step 3: Follow the prompts to connect your Instagram account to Sprout.
Step 4: From the dashboard, click on the Reports tab in the left-hand menu bar.
Step 5: Select Instagram Business Profiles under the Profiles by Network category.
Here you can track different Instagram metrics like views, engagement and follower growth alongside other useful analytics (like demographics).
And if you want a quick overview of your overall Instagram performance, here’s what that looks like in Sprout’s report:
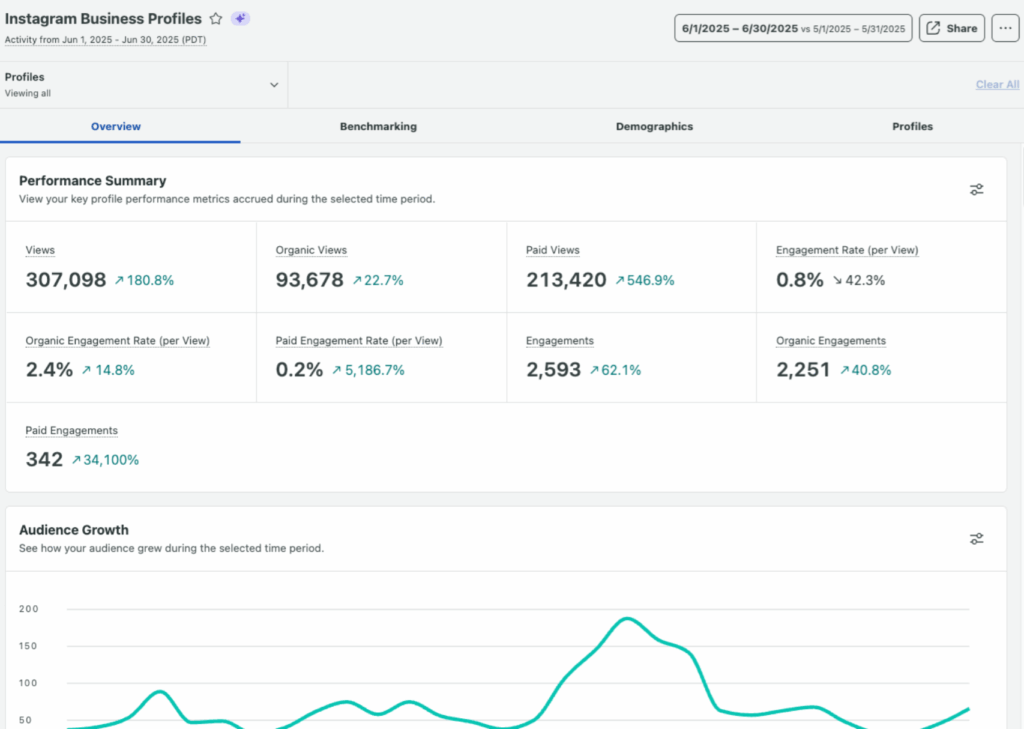
You can also see your top posts to understand content performance better.
Step 6: Use the filters to select specific Instagram profiles and set your desired date range.
Pro tip: You can also access cross-network reports (e.g. Post, Profile and Tag Performance Reports) in Sprout to analyze how your Instagram metrics fit into your overall social strategy.
How to track Instagram metrics using the Instagram App
There are a couple of different ways to access your insights from the Instagram app. (Keep in mind that these are only accessible on the mobile app and not on desktop.)
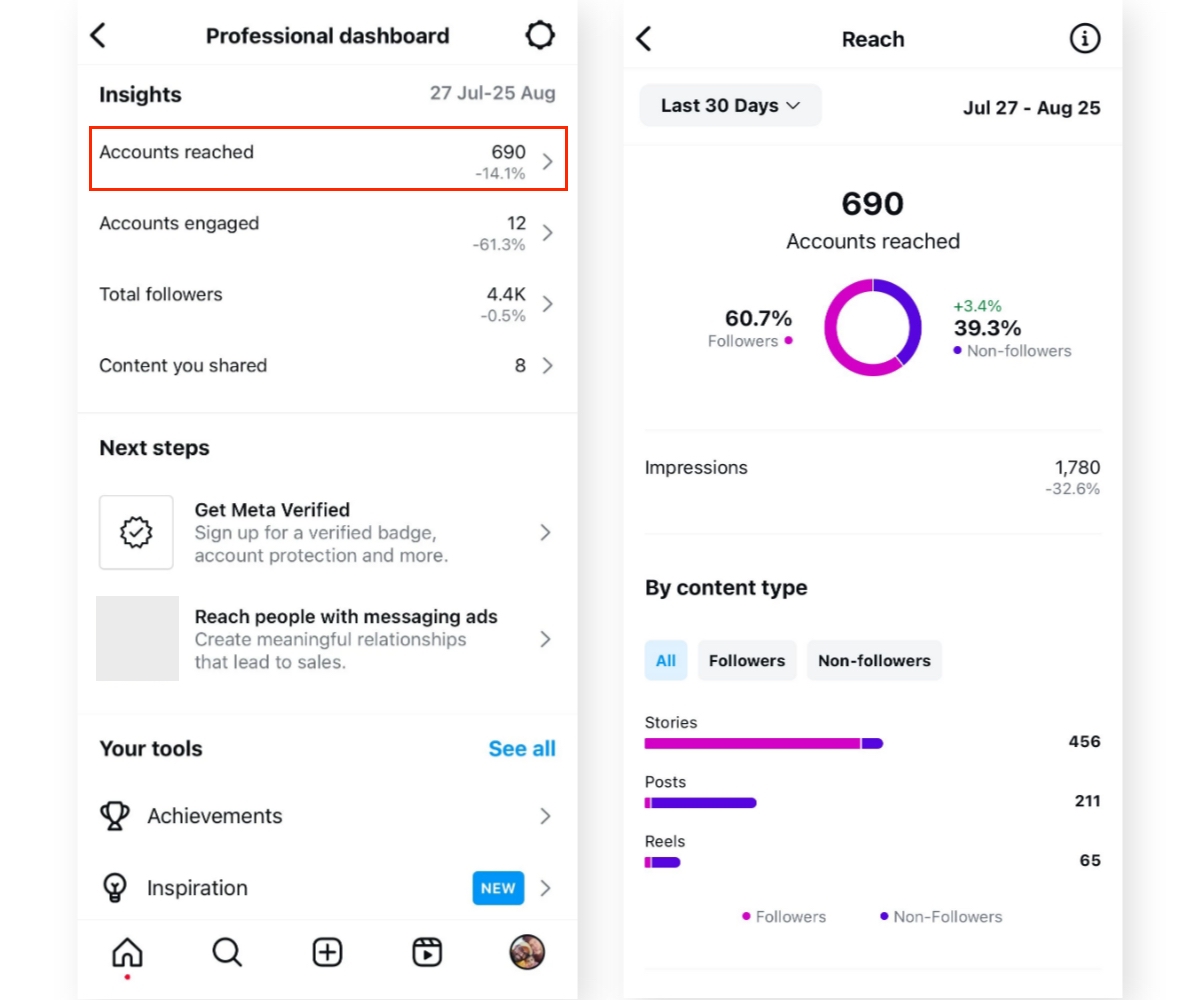
1. Head to your profile and tap on the Professional dashboard button. The very first option is your account insights for reach, engagement, followers and content. Tap each category to view specific metrics related to it.
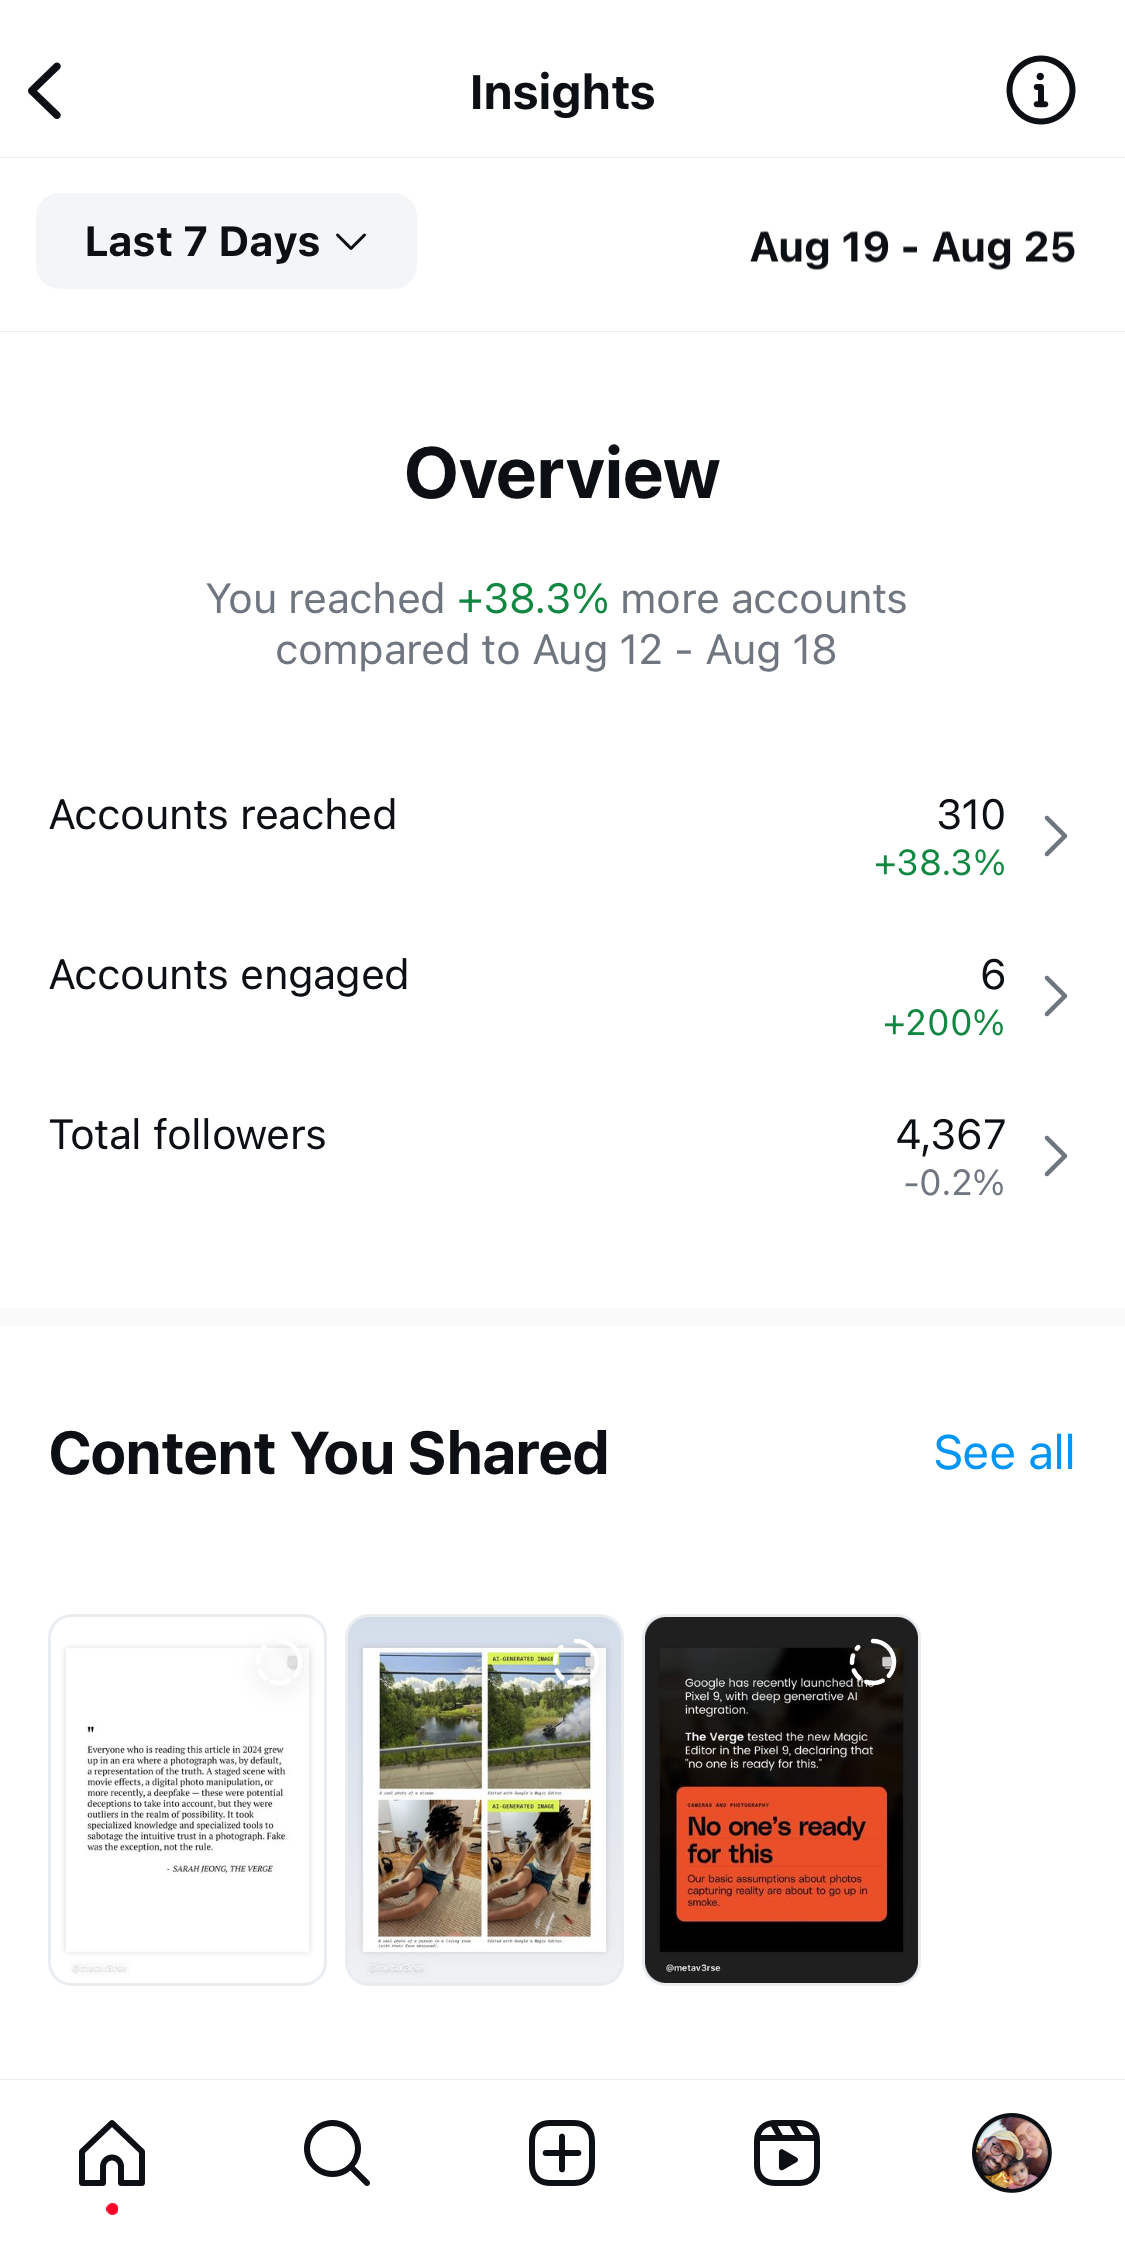
2. You can also tap the hamburger menu icon in the top right corner of your profile and then tap Insights to access them directly.
You can find all of the below metrics inside your Instagram Insights—or you can take advantage of a third-party analytics tool like Sprout Social to get even more in-depth reporting.
36 key advanced Instagram metrics to track
Let’s explore 36 Instagram metrics and walk through what each means. You’ll see these metrics in Instagram’s native analytics, and we’ll share where you can find them in Sprout Social.
Awareness metrics
While several different metrics make up this category, Instagram considers “views” to be the primary metric users should look at to understand how your content is performing regardless of format. Why views? Instagram believes this is a stronger indicator of success over follower count and impressions. This makes sense given reach has a stronger correlation to discoverability, which Instagram’s algorithm and user behavior seem to favor.
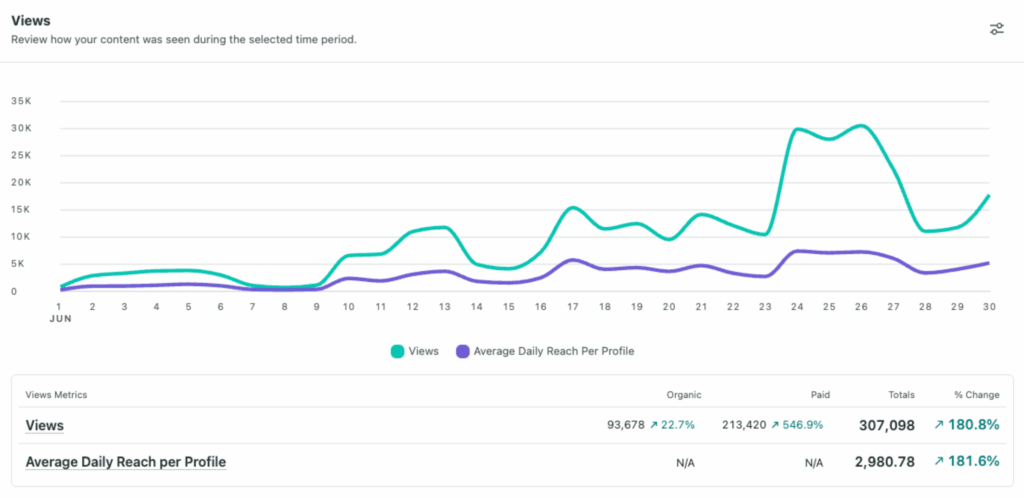
1. Views (formerly plays)
The number of times a reel started to play or was replayed, and the number of times a non-reel appeared on a user’s screen. This is the primary metric used across all organic and boosted media on Instagram. The ‘plays’ metric is being phased out and relabeled ‘views’.
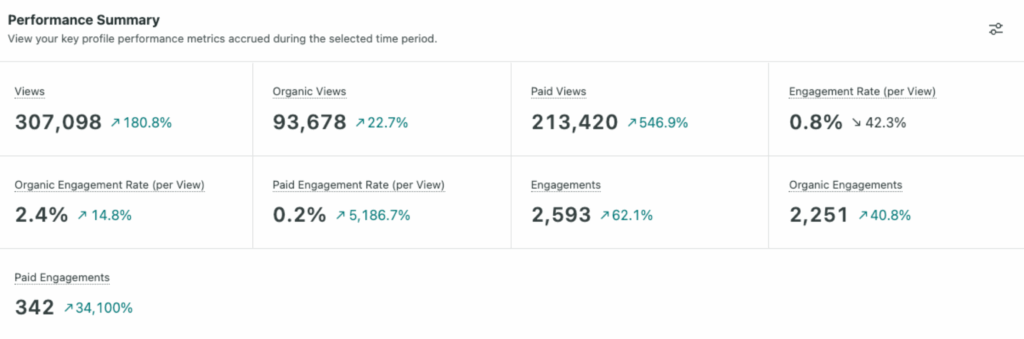
In Sprout, you’ll find views in the Instagram Business Profile report, displayed as a chart within the Overview tab.
2. Reach or content reach
The total number of unique viewers a post has. Reach and impressions are often confused because they are similar. Here’s a quick explainer: If you were to see a post three times, that’s considered three impressions, but you would only count as one person reached.
To find your reach in Sprout, head over to your Instagram Business Profiles Report. Your reach is located in the exact same section as your views. You can see total and percent change right below your impressions metric, making it easy to see both at once.
3. Reach by region
The number of unique users who have seen your content, segmented by geographical location. So you know which areas are more engaged with your content.
4. Impressions
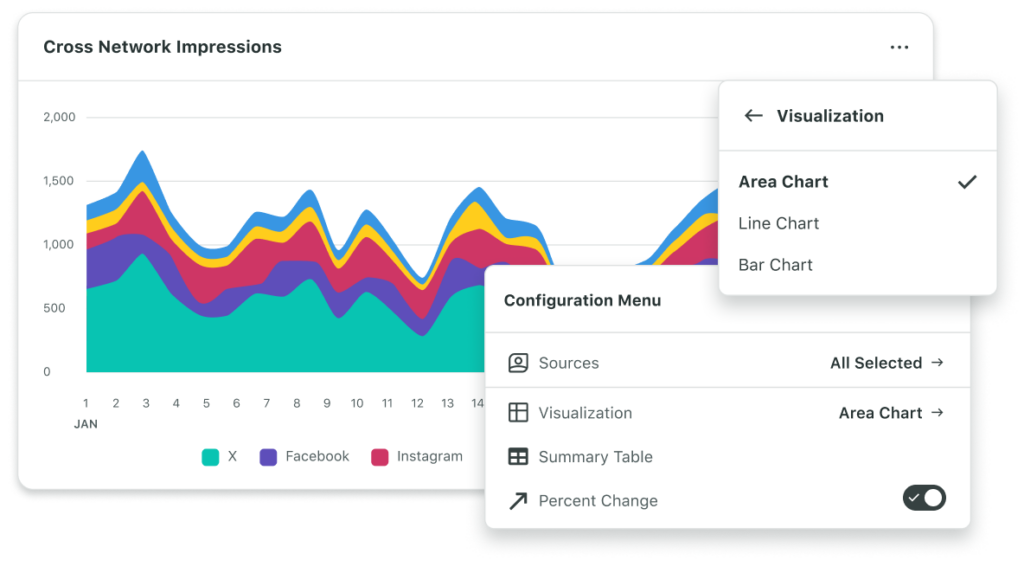
The number of times an individual piece of content was displayed to users. Instagram recommends looking at “views” instead of impressions, and impressions will no longer appear within Instragram Insights. It will continue to be available in other tools, such as Meta Ads Manager and Sprout’s cross-network reports.
In Sprout, you’ll find impressions in the Cross-Network Reporting, where views are included in the Impressions metric. Below is an example of the Profile Performance Report, which includes impressions for all your connected profiles.
5. Profile visits
The total number of times users have visited your social media profile over a specific period. This metric is useful for gauging interest in your brand.
6. Brand mentions
The number representing how often your brand is mentioned on social media platforms. This can include social mentions like direct @-mentions in comments, captions and Stories. It helps to measure brand visibility and engagement.
7. Branded hashtags
The number of times others use the hashtags specifically created for your brand or campaign. This aids with tracking the impact of campaigns or promotions. You can view hashtag analytics in Instagram natively or using a social media management tool.
8. Share of voice
The measure of the market your brand owns compared to your competitors. Share of voice measures the amount of conversations about your brand compared to competitors. It acts as a gauge for your brand visibility and how much you dominate the conversation in your industry. The more market share you have, the greater popularity and authority you likely have among users and prospective customers.
9. Content you shared
This includes any content you’ve posted and shared across Stories, feeds and video.
10. Interactions
Any action users take when they like, share, save, comment or reply to your content. The location of this metric in Instagram Insights has shifted with the introduction of “views”.
11. Saves
The number of times a post has been bookmarked.
To find this in Sprout, head to your Instagram Business Profiles Report. You can view the total number of saves on your posts and Reels here. You can also track the number of saves on individual, high-performing posts by locating the Post Performance section of the report.
12. Shares
The number of times a post/content was sent to another user via Instagram.
13. Instagram Stories views
The amount of people who viewed an Instagram Story. You can also see replies, impressions and navigation for each slide in a Story.
Engagement metrics
These metrics go a layer deeper, giving you insight into how people are interacting with your content and brand. In Sprout, you’ll get a granular view in the Post Performance Report, where you’ll see a breakdown of the performance for each Instagram post.
14. Engagement rate
This metric refers to the percentage of your following that’s engaged with your content whether it’s liking, commenting, sharing or saving.
15. Engagement rate by follower
This metric calculates the engagement (likes, comments, shares) a post receives relative to the number of followers you have. It provides a percentage to assess how effectively your content resonates with your audience.
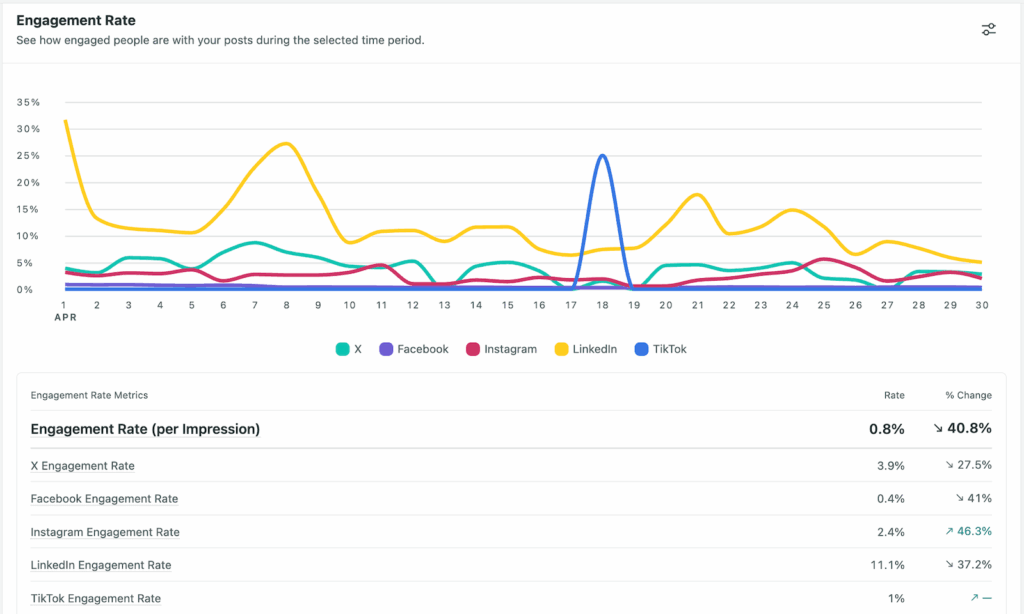
16. Engagement rate by impressions
This measures the percentage of viewers who interacted with your content (by liking, commenting, sharing or saving it) after coming across it. Unlike engagements per follower, this metric focuses on everyone who actually saw your content, rather than just your follower base.
In Sprout Social, look for the engagement rate metric in the Overview section of the Instagram report. You’ll see the engagement rate (per impression) in a chart, which you can customize to show organic, paid or both.
17. Saved posts
The number of times users save your posts. This metric indicates the value or interest users find in your content because they want to refer to it later.
18. Comments per post
The average number of comments each post receives. This metric shows how much your content prompts conversations.
19. Click-through-rate
The percentage of people who see an Instagram ad and click on it. It helps measure how effective your paid content is at driving action.
20. Video completion rate
The percentage of people who viewed content from beginning to end on Instagram Stories and Reels.
21. Accounts engaged
This refers to the number of unique accounts that interacted with your content. This includes demographics information from the profiles you reached, such as top cities and countries. The location of this metric in Instagram Insights has shifted with the introduction of “views”.
22. Accounts reached
The number of unique accounts that have seen your content at least once. This includes the demographic information on the accounts you reached, such as top cities and countries. It also includes your followers and non-followers. The location of this metric in Instagram Insights has shifted with the introduction of “views”.
23. Live interactions
The number of comments and shares for a stream on Instagram Live.
24. Profile interactions
This metric tells you how well your Instagram profile drives action or generates leads by measuring profile clicks. For example, how many people are clicking on your contact button? How many are visiting your website? How many are getting directions to your business location?
In your Sprout Social Instagram Business Profiles Report, you can find this metric in Profile Actions within the Performance Summary or under the Engagement section of the report.
25. Peak concurrent viewers
This refers to the busiest point of the livestream when there were the most viewers.
26. Accounts reached during broadcast
The number of profiles that came across the livestream.
27. Most engaged hashtags
Your top-performing hashtags with the highest engagement. Instagram hashtags encourage engagement and provide another lens on your audience and what they are searching for on the platform.
Other metrics to track
The following metrics provide specific insights in your content and audience that can help you determine the health of your strategy and specific tactics.
28. Total followers
The sum of every profile that follows your account. View your follower growth, top locations, age ranges and times they’re most active on Instagram.
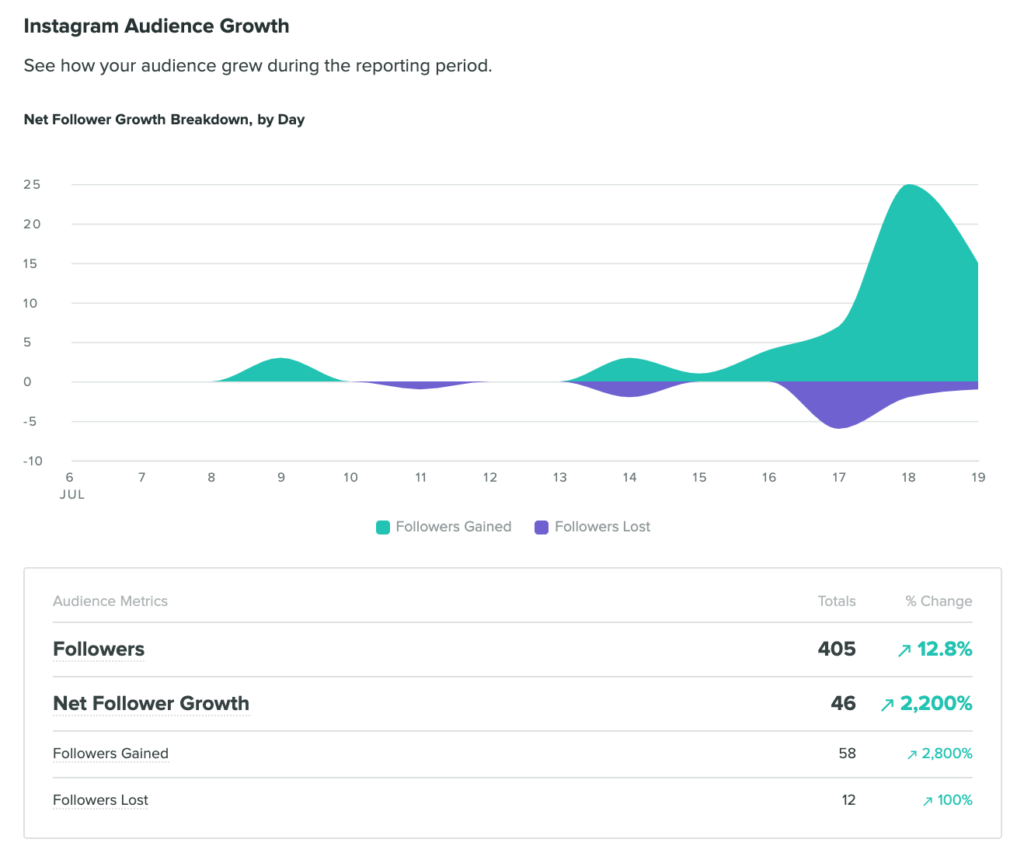
29. Follower growth rate
The percentage rate your followers are increasing over a specific period to the number of followers at the start of that period.
Sprout enables you to analyze various aspects of your follower growth, from a comprehensive growth chart to percentage growth. Select the time period to see the differences in followers gained and lost for that reporting period with the Instagram Business Profiles overview. You can then dive into the Post Performance Report to see what content resonated most (and least).
30. Engagement rate by reach
This metric measures the engagement a post receives relative to the number of unique users who saw the post. It provides insight into how engaging your content is to those who see it, not just your followers.
31. Click-through rate from bio
The number of clicks generated from the links included in your bio relative to the number of profile visits.
32. Story completion rate
The percentage of viewers who watch your entire Instagram Story from start to finish without skipping. This metric is useful for evaluating how compelling your Stories are.
33. Audience growth over time
The amount of followers you lost or gained over time.
34. Audience demographics
The age, gender, location or other characteristics of your followers. Instagram’s native analytics data include audience demographics (age, gender, location). These data points can highlight whether you’re getting in front of your target audience via Instagram or not.
35. Traffic
The number of visitors Instagram drives to your website.
36. Instagram ad analytics
This refers to the performance data available for Instagram advertising. You can check Instagram ad analytics in a few ways, including Ads Manager. It shows your campaign performance overview, demographics, delivery data, campaign spend and cost per result.
Start tracking your Instagram metrics today
With so many different metrics and ways to cut your Instagram performance data, the real success comes from narrowing your focus to the metrics that truly align with your business goals—whether that’s boosting engagement or increasing conversions. Honing in on the most meaningful data points will help you prove the value of your Instagram efforts, optimize your campaigns and ultimately achieve stronger business outcomes.
With Sprout’s Instagram analytics, you’ll be able to customize reports to highlight the specific data that’s translating to ROI, as well as go deeper with competitive comparisons, social listening and more. Our AI-powered analytics will free up valuable time for you to make smarter, more strategic decisions without getting bogged down by tedious data mining. See for yourself by taking advantage of our free 30-day trial.
Share