Snapchat analytics: How to find the metrics that actually matter

Written by Emily Jenkins
Published on March 3, 2026
Reading time 7 minutes

Table of Contents
Snapchat analytics can often feel like a black box. The app moves fast, the content is ephemeral and the performance dashboards don’t feel as intuitive as other social media analytics.
Still, if you know where to look, the data tells useful stories about what holds attention and what drives Snapchatters to act. More importantly, it’s how you read that data that shapes the strategic decisions you make on the app.
This guide breaks down how Snapchat analytics work, why they matter and how to use them to turn disappearing Snaps into lasting brand growth.
What Snapchat analytics are and why they matter
Snapchat analytics are the performance and audience data that track how users consume your content across Stories, Spotlight and your Public Profile. These metrics can be tracked natively within the Snapchat app or through third-party analytics tools.
Many teams treat Snapchat like a creative guessing game. You “post and pray,” hoping a Snap lands without understanding why. In such a fast-paced environment, data is your only anchor.
Analytics help you zero in on what’s actually driving engagement. By analyzing where attention holds and where it drops, you can optimize your creative spend and ensure your Snapchat presence contributes to broader business goals.
Tracking these signals moves your team from reactive posting to making intentional decisions that create a strong Snapchat marketing strategy, leading to consistent growth and long-term brand impact.
Understanding native analytics with Snapchat Insights
Snapchat Insights is the app’s built-in analytics hub designed specifically for creators and brands. It gives you an overview of how your content performs and audience insights.
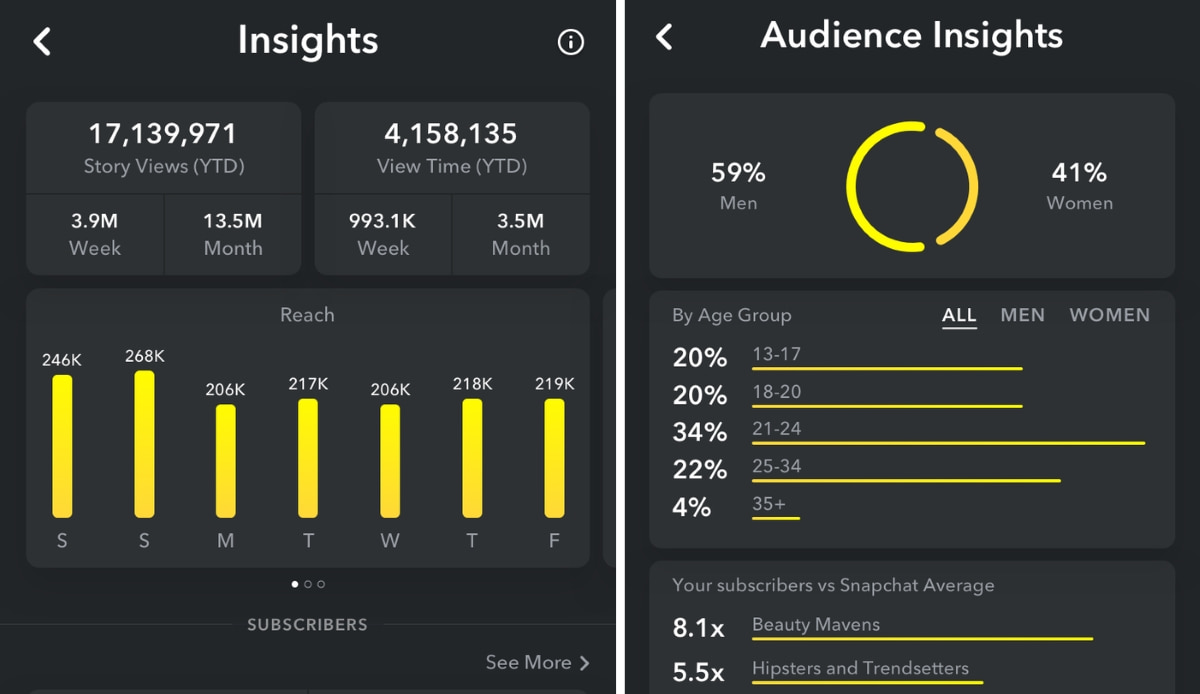
The dashboard categorizes your data into three primary views—Stories, Audience and Spotlight—so you can scan performance without digging through menus.
Source: AIM
Here’s what you can track and what those metrics show you:
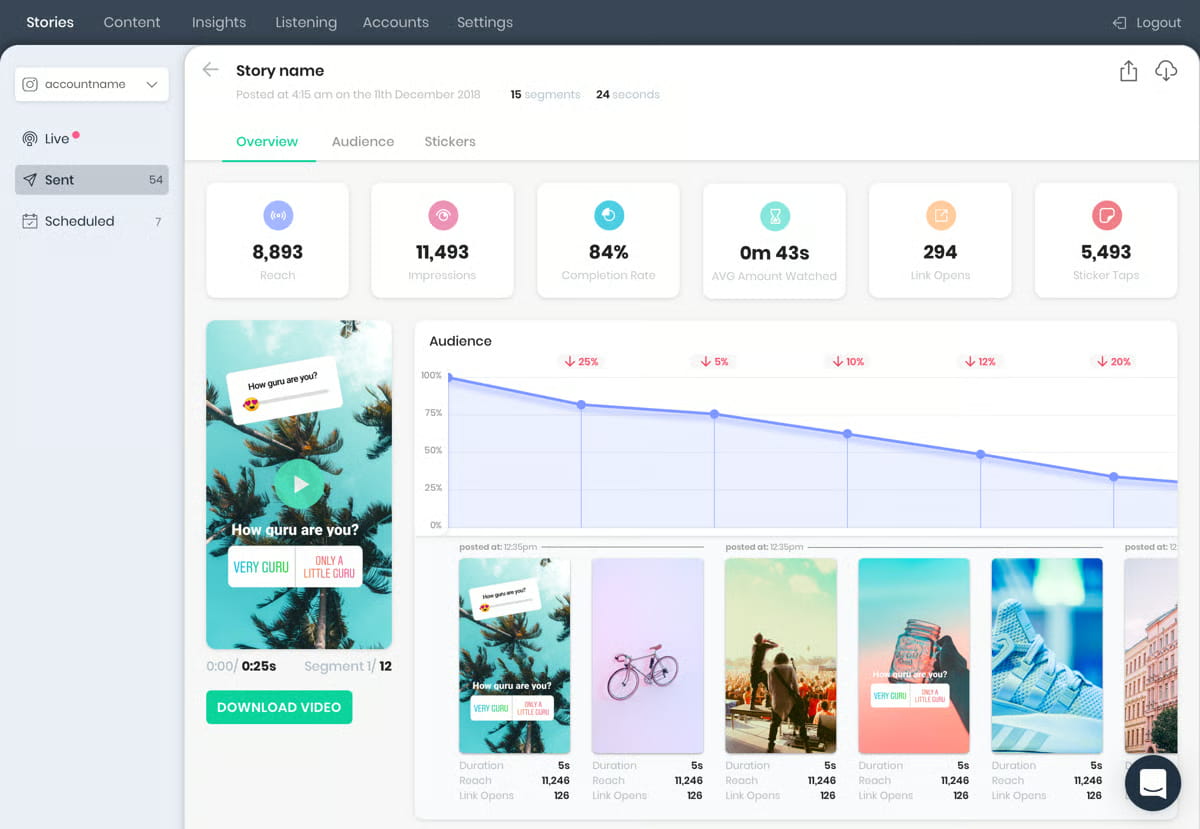
- Story Insights show the total number of views, view time, completion rates and screenshots, helping you understand how each frame performs.
- Audience Insights highlight audience demographics, location and top interests. This data helps you confirm whether you’re attracting attention from your target audience.
- Spotlight metrics provide a basic overview of views and favorites on Spotlight Snaps that appear on your public profile.
Together, these native insights reveal which Snaps held user engagement from start to finish, which ones lost them early and which ones earned saves or favorites. That context helps you decide what to repeat, what to cut and how to optimize your next post so it resonates deeply with your views.
Who can access Snapchat Insights
Anyone with a Public Profile on Snapchat can access basic Snapchat Insights and track performance for their public Snaps and Stories, regardless of audience size.
However, the depth of these insights relates to your follower count. To see advanced demographic details like age, gender and top locations, your profile needs to reach a minimum of 200 Snapchat followers.
This threshold exists to ensure demographic insights are statistically large enough to reflect consistent, reliable audience patterns.
How to find your Snapchat analytics in the app and on desktop
Snapchat hides its analytics behind a few taps, but once you know where to look, the data is easy to find.
You can check organic performance and audience insights directly in the Snapchat mobile app, while paid campaign data lives on desktop inside Snapchat Ads Manager.
Accessing Snapchat Insights on mobile (iOS or Android)
To see your organic performance on your mobile device, follow these steps:
1. Open the Snapchat app.
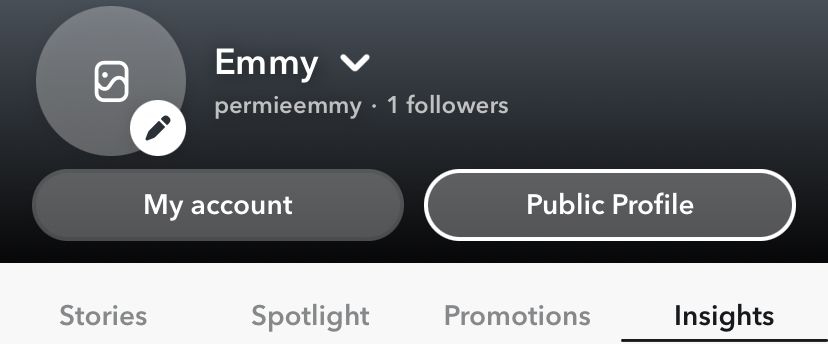
2. Tap your Bitmoji in the top left corner.

3. Tap the Public Profile button under the “Public Profiles” section.

4. Tap Insights.
5. Once inside, toggle between the tabs to view your Story metrics with your Audience Insights underneath.
Accessing paid performance using Snapchat Ads Manager (desktop)
For paid campaigns and website conversion data, you must use the desktop-based Snapchat Ads Manager, not the in-app Insights tab. Snapchat sends all ads data, including insights from Snap Pixel events (which measure actions users take after seeing your ads), into Ads Manager.
Ads Manager tracks performance relative to your business outcomes, surfacing metrics like checkouts, app opens, store visits, tutorial completions, video progression and full Snap Pixel event data.
This shows you how your Snapchat ads drove measurable actions and how those actions contribute to return on investment (ROI).
To find your paid performance data:
1. Go to ads.snapchat.com and sign in.
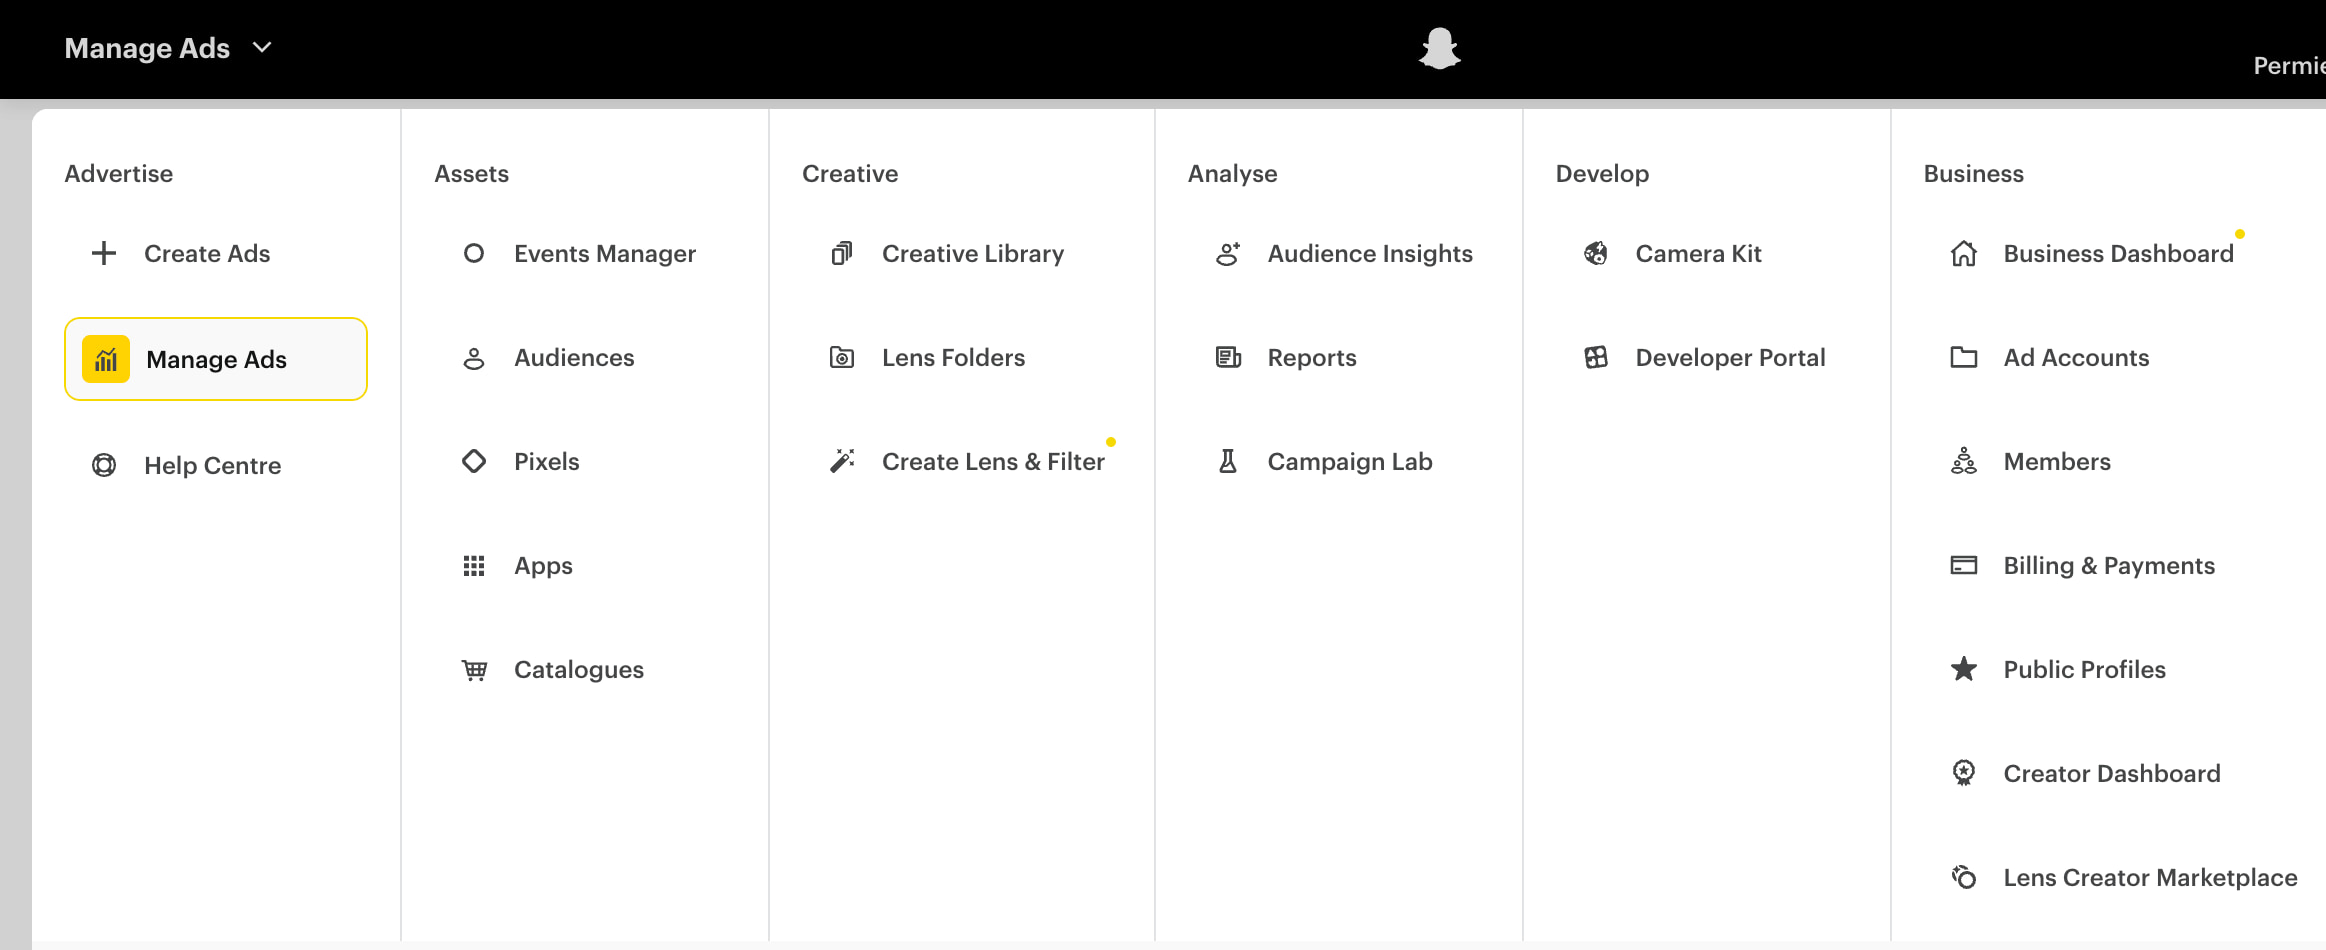
2. Open the Manage Ads view from the top-left dropdown menu.
3. Choose a campaign, ad set or specific ad from the list under the graph.
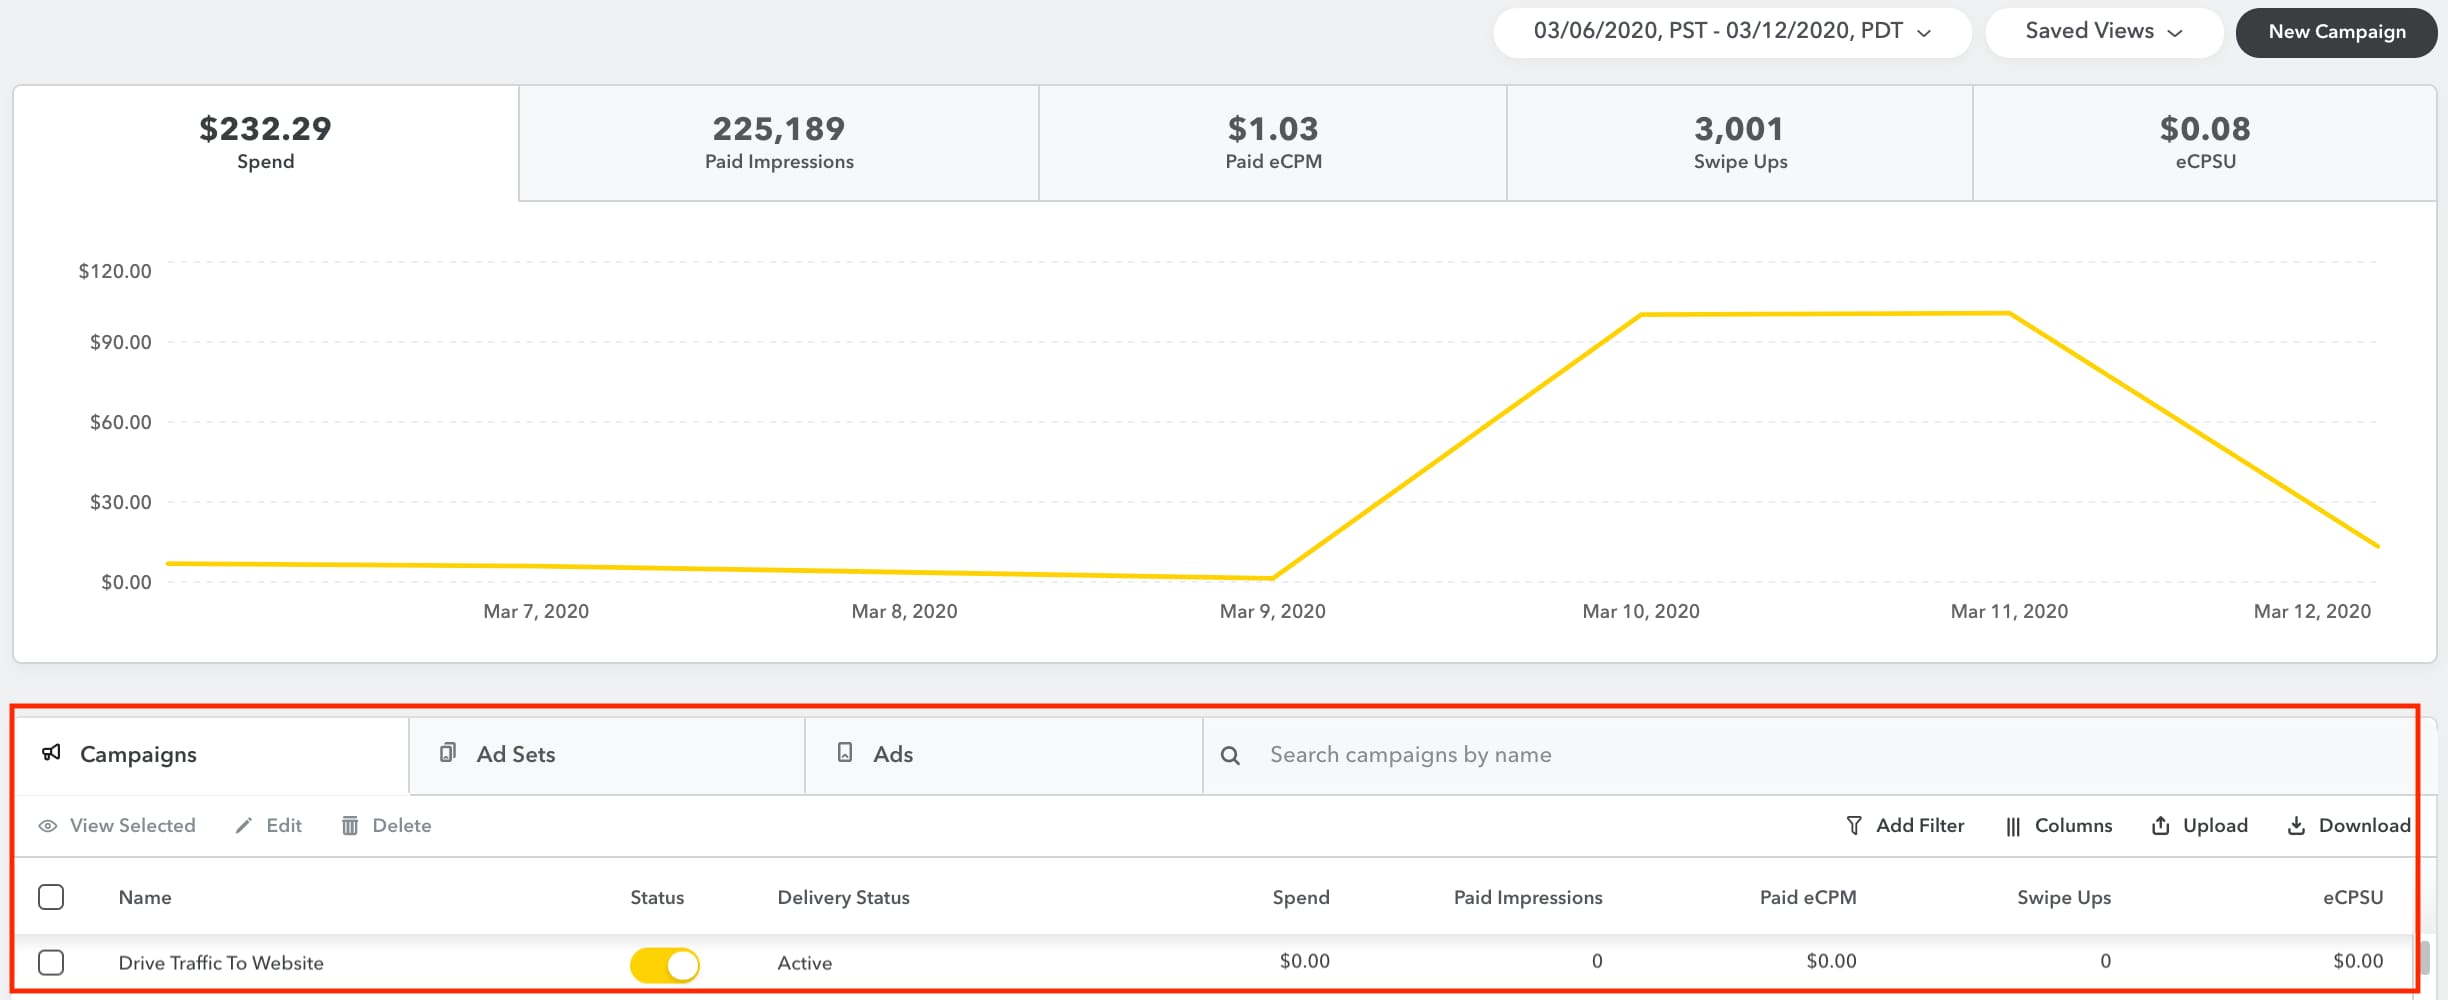
4. Use the top bar to scan your core stats (such as amount spent, paid impressions, clicks, click rate and 2-second video views).
5. Click Show comparison to compare this data to any other metric you want to analyze (e.g., spend vs conversions).
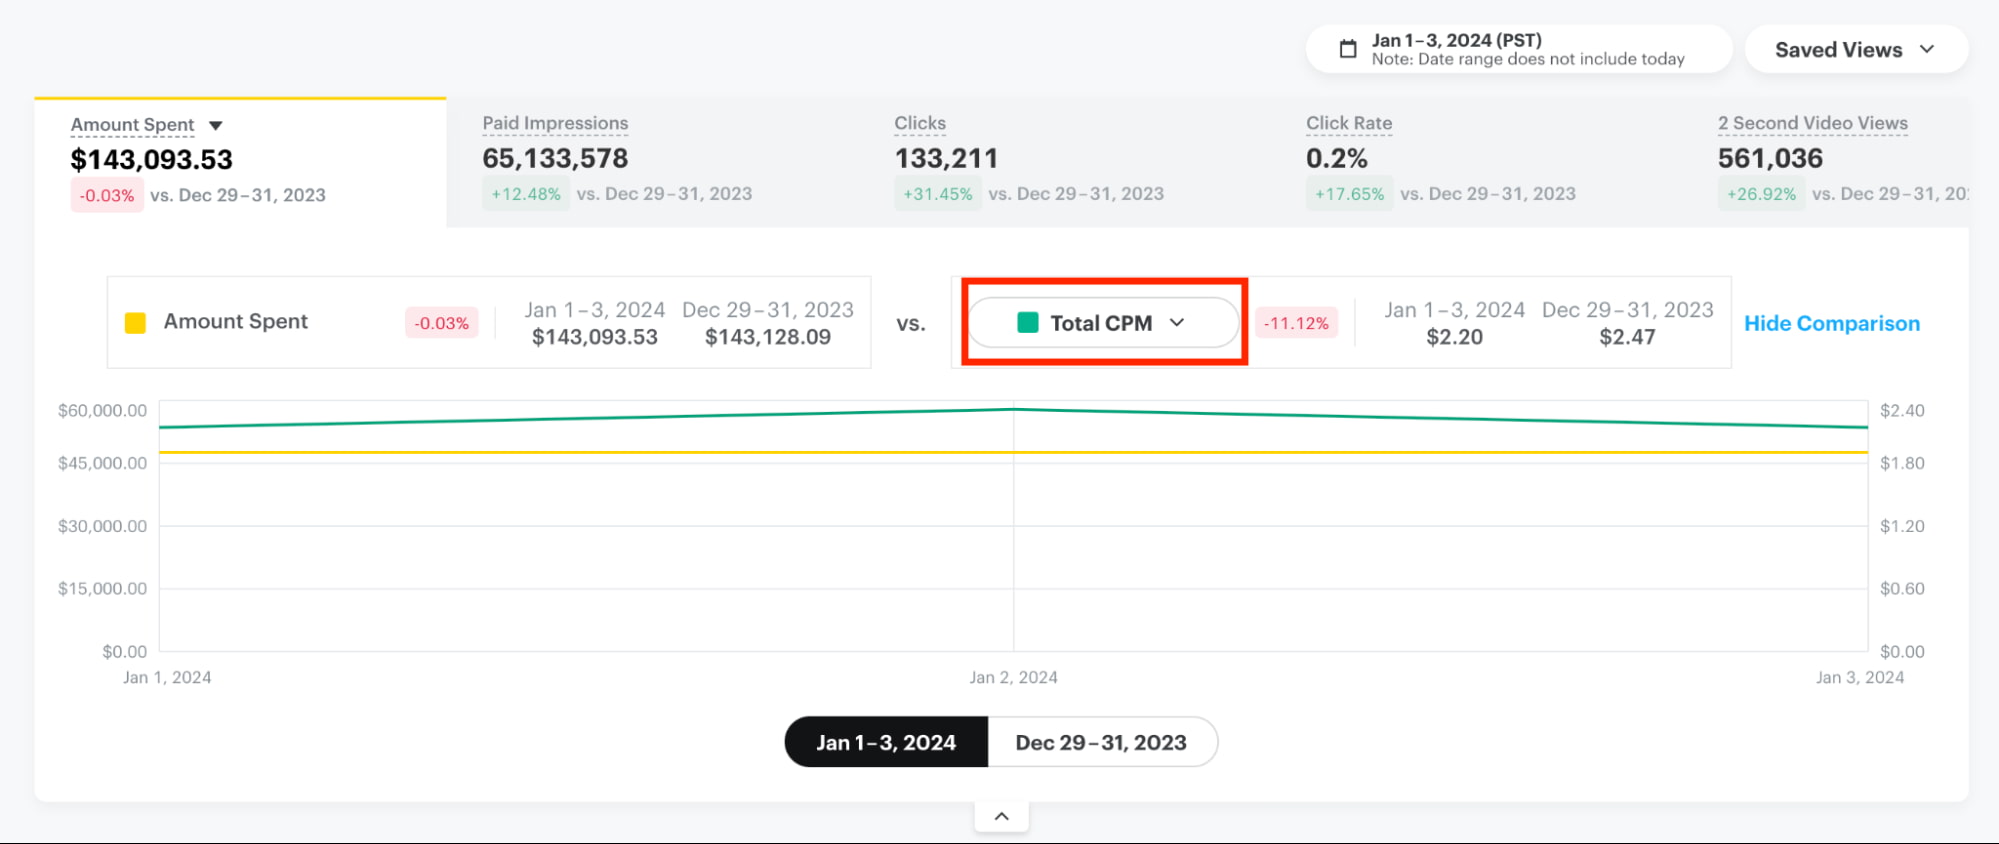
That dropdown is where Snapchat hides the full performance layer. You can jump from simple delivery stats to app-level milestones, in-app behaviour, purchase events and every step Snap Pixel tracks along the way.
It covers everything from how many people saw your ad to how many searched, viewed a product, started checkout or completed a subscription.
If you want a clearer view, simply adjust:
- Date range (top-right corner)
- Saved views (to toggle between prebuilt reporting layouts)
Key Snapchat metrics to focus on
The Snapchat metrics that matter are the ones that show which content held attention and which made people take an action.
While the native in-app analytics dashboard is lean, it still shows you which Snaps viewers watched until the end, where viewers scrolled away and which moments led to saves or replies. This helps you spot what’s working so you can double down on what’s successful and pivot away from what isn’t.
Here are the most important Snapchat metrics that signal true engagement rather than just passive consumption.
Core content metrics: Stories, Spotlight and retention
Snapchat gives you a lean set of content metrics, but each one reveals how viewers moved through your Story or Spotlight Snap.
Here’s what these metrics show:
- Story Views show the total number of times people tapped into your content, giving you a sense of reach rather than engagement.
- Story View Time shows how long users stayed to watch. This helps you understand whether viewers were skimming or actually engaging with the full Story sequence.
- Story Completion Rate shows the percentage of views who watched every frame (i.e., the full Story). This is one of the strongest signals of actual attention. High completion suggests the pacing is perfect; a low rate tells you which frame caused the drop off.
- Screenshots indicate when something was worth saving, often signaling high-value content, like a promo code, tip, recipe or product someone wants to revisit.
- Spotlight Views and Favorites show whether a Snap had enough pull to break out of your subscriber bubble and reach the wider Spotlight community feed. If one clip spikes, its hook or format likely made it more recommendable—and worth testing again.
Audience insight metrics: Confirming your target demographics
Audience Insights help you verify whether your content is reaching the people you meant to reach. Here’s what these metrics show you:
- Unique Viewers show the number of individual people who watched your content, representing true reach beyond repeat views.
- Audience Demographics break down age, gender and top locations to help you check alignment with your ideal customer profile (ICP) and spot gaps if your audience skews older, younger or more regional than expected.
- Audience Interests reveals what your viewers care about. These insights help you shape future content pillars and identify natural partnership opportunities with Snapchat influencers. When your audience shares interests with a creator’s audience, collaborations and takeovers feel more relevant and more likely to perform.
- Popular Regions highlights your top locations so you can understand where your viewers concentrate. This helps you tailor language, cultural references, posting times and geo-targeted campaigns to the regions where interest is highest.
Engagement and community metrics: Profile views and replies
Snapchat is built on direct engagement, which means community signals matter as much as the content ones. Here’s what your engagement and community metrics show you:
- Replies show how many people messaged you from your Story. Replies are a critical indicator of genuine community health because they prove someone cared enough to talk back.
- Profile Views show how many people tapped through to your profile, which signals high intent and tells you your Story successfully pushed viewers out of passive mode.
- Subscribers track steady audience growth over time, rather than just viral spikes. This tells you whether your strategy is working and your content is earning long-term interest.
- Lens Usage measures engagement with any AR Lenses you publish to see if the experience invited playful interaction or missed the mark.
If you take these metrics together, they highlight the content that earns attention, inspires action and drives loyalty.
5 specialized third-party Snapchat analytics tools
If Snapchat’s native analytics feel limited, you can use third-party tools to go further. Because Core Sprout Social does not currently offer a native Snapchat integration, these tools add deeper reporting, trend analysis and cross-channel context you won’t find in the app.
Here’s a breakdown of five tools so you can see what they offer and decide which platform fits the way you measure Snapchat performance.
1. Measure Studio
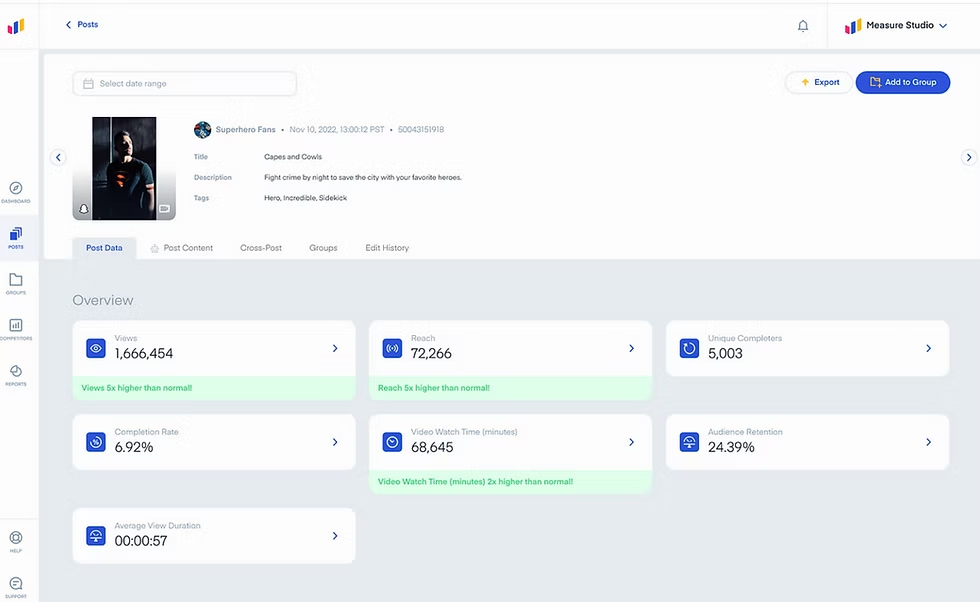
Measure Studio pulls in your organic and paid Snapchat data and places it into one clean, customizable dashboard. It lets you group posts, compare performance across time periods or campaigns and generate social reports in seconds.
2. Vista Social
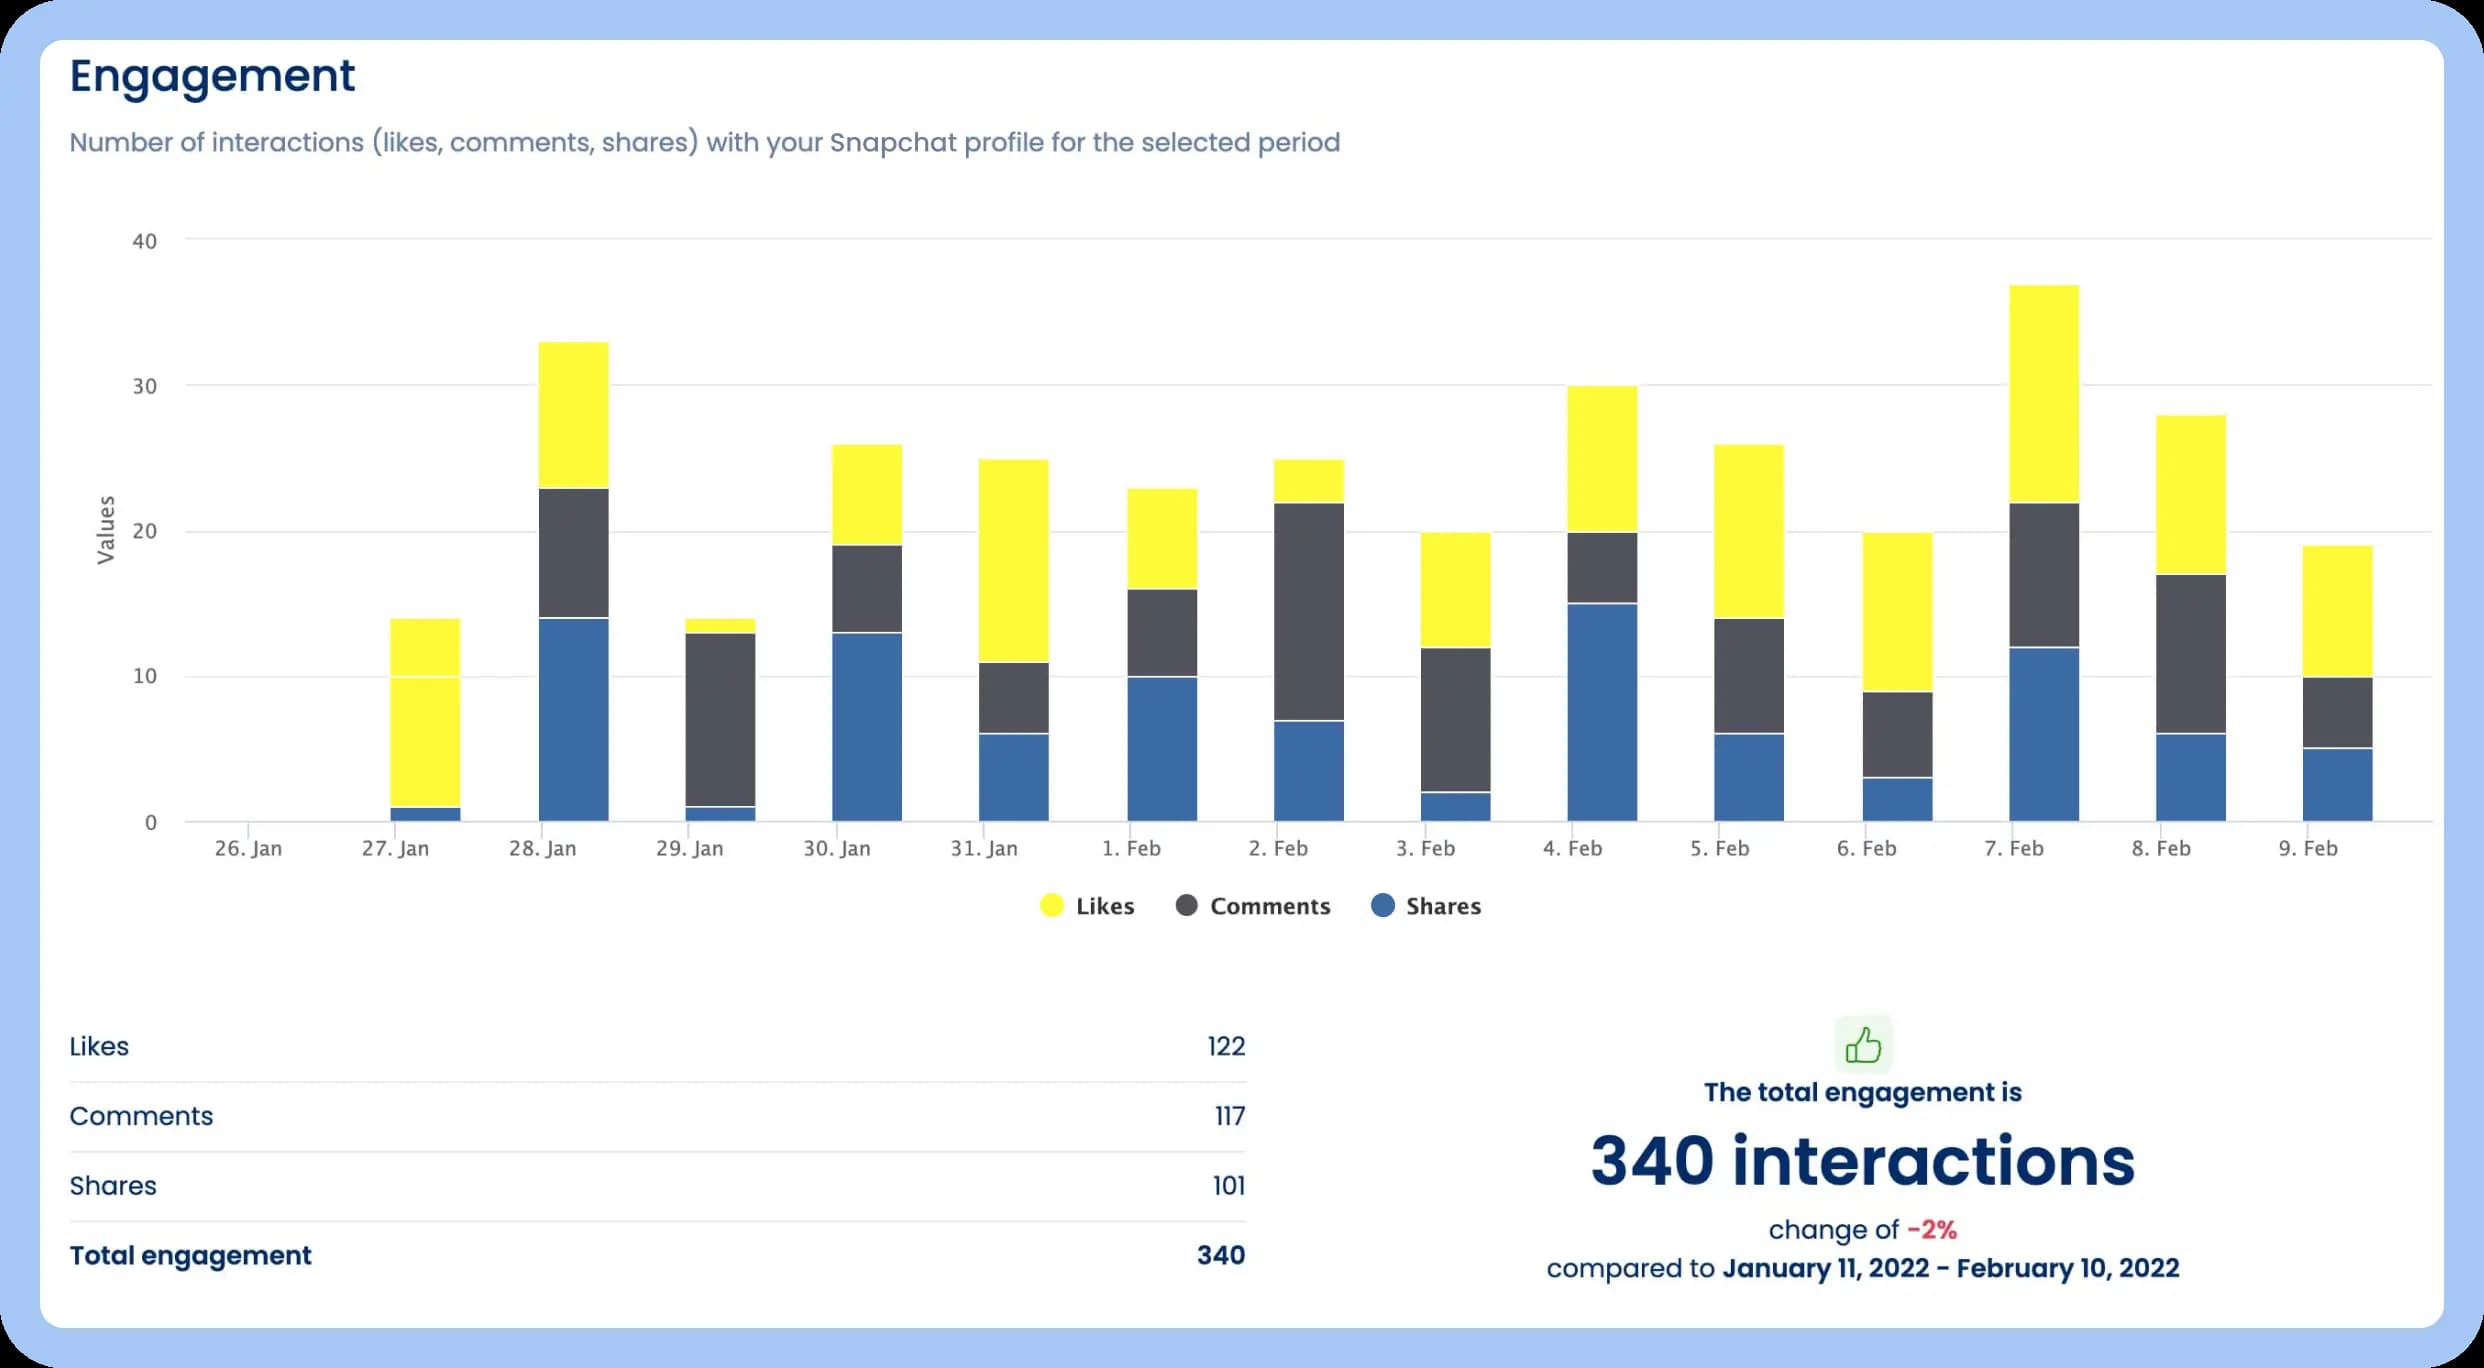
Vista Social integrates with Snapchat to bring you easy-to-read performance charts covering followers, reach, impressions and engagement across Stories and Spotlight posts. It shows you performance over time and lets you compare Snapchat to other social media metrics.
3. Mish Guru
Source: G2
Mish Guru pulls your Snapchat content into a central workspace where you can review every Snap, compare performance across campaigns and track how audience behaviour shifts over time. It specializes in stitching together your Story data so you can see patterns in pacing, formats and themes, instead of viewing isolated metrics.
4. Triple Whale
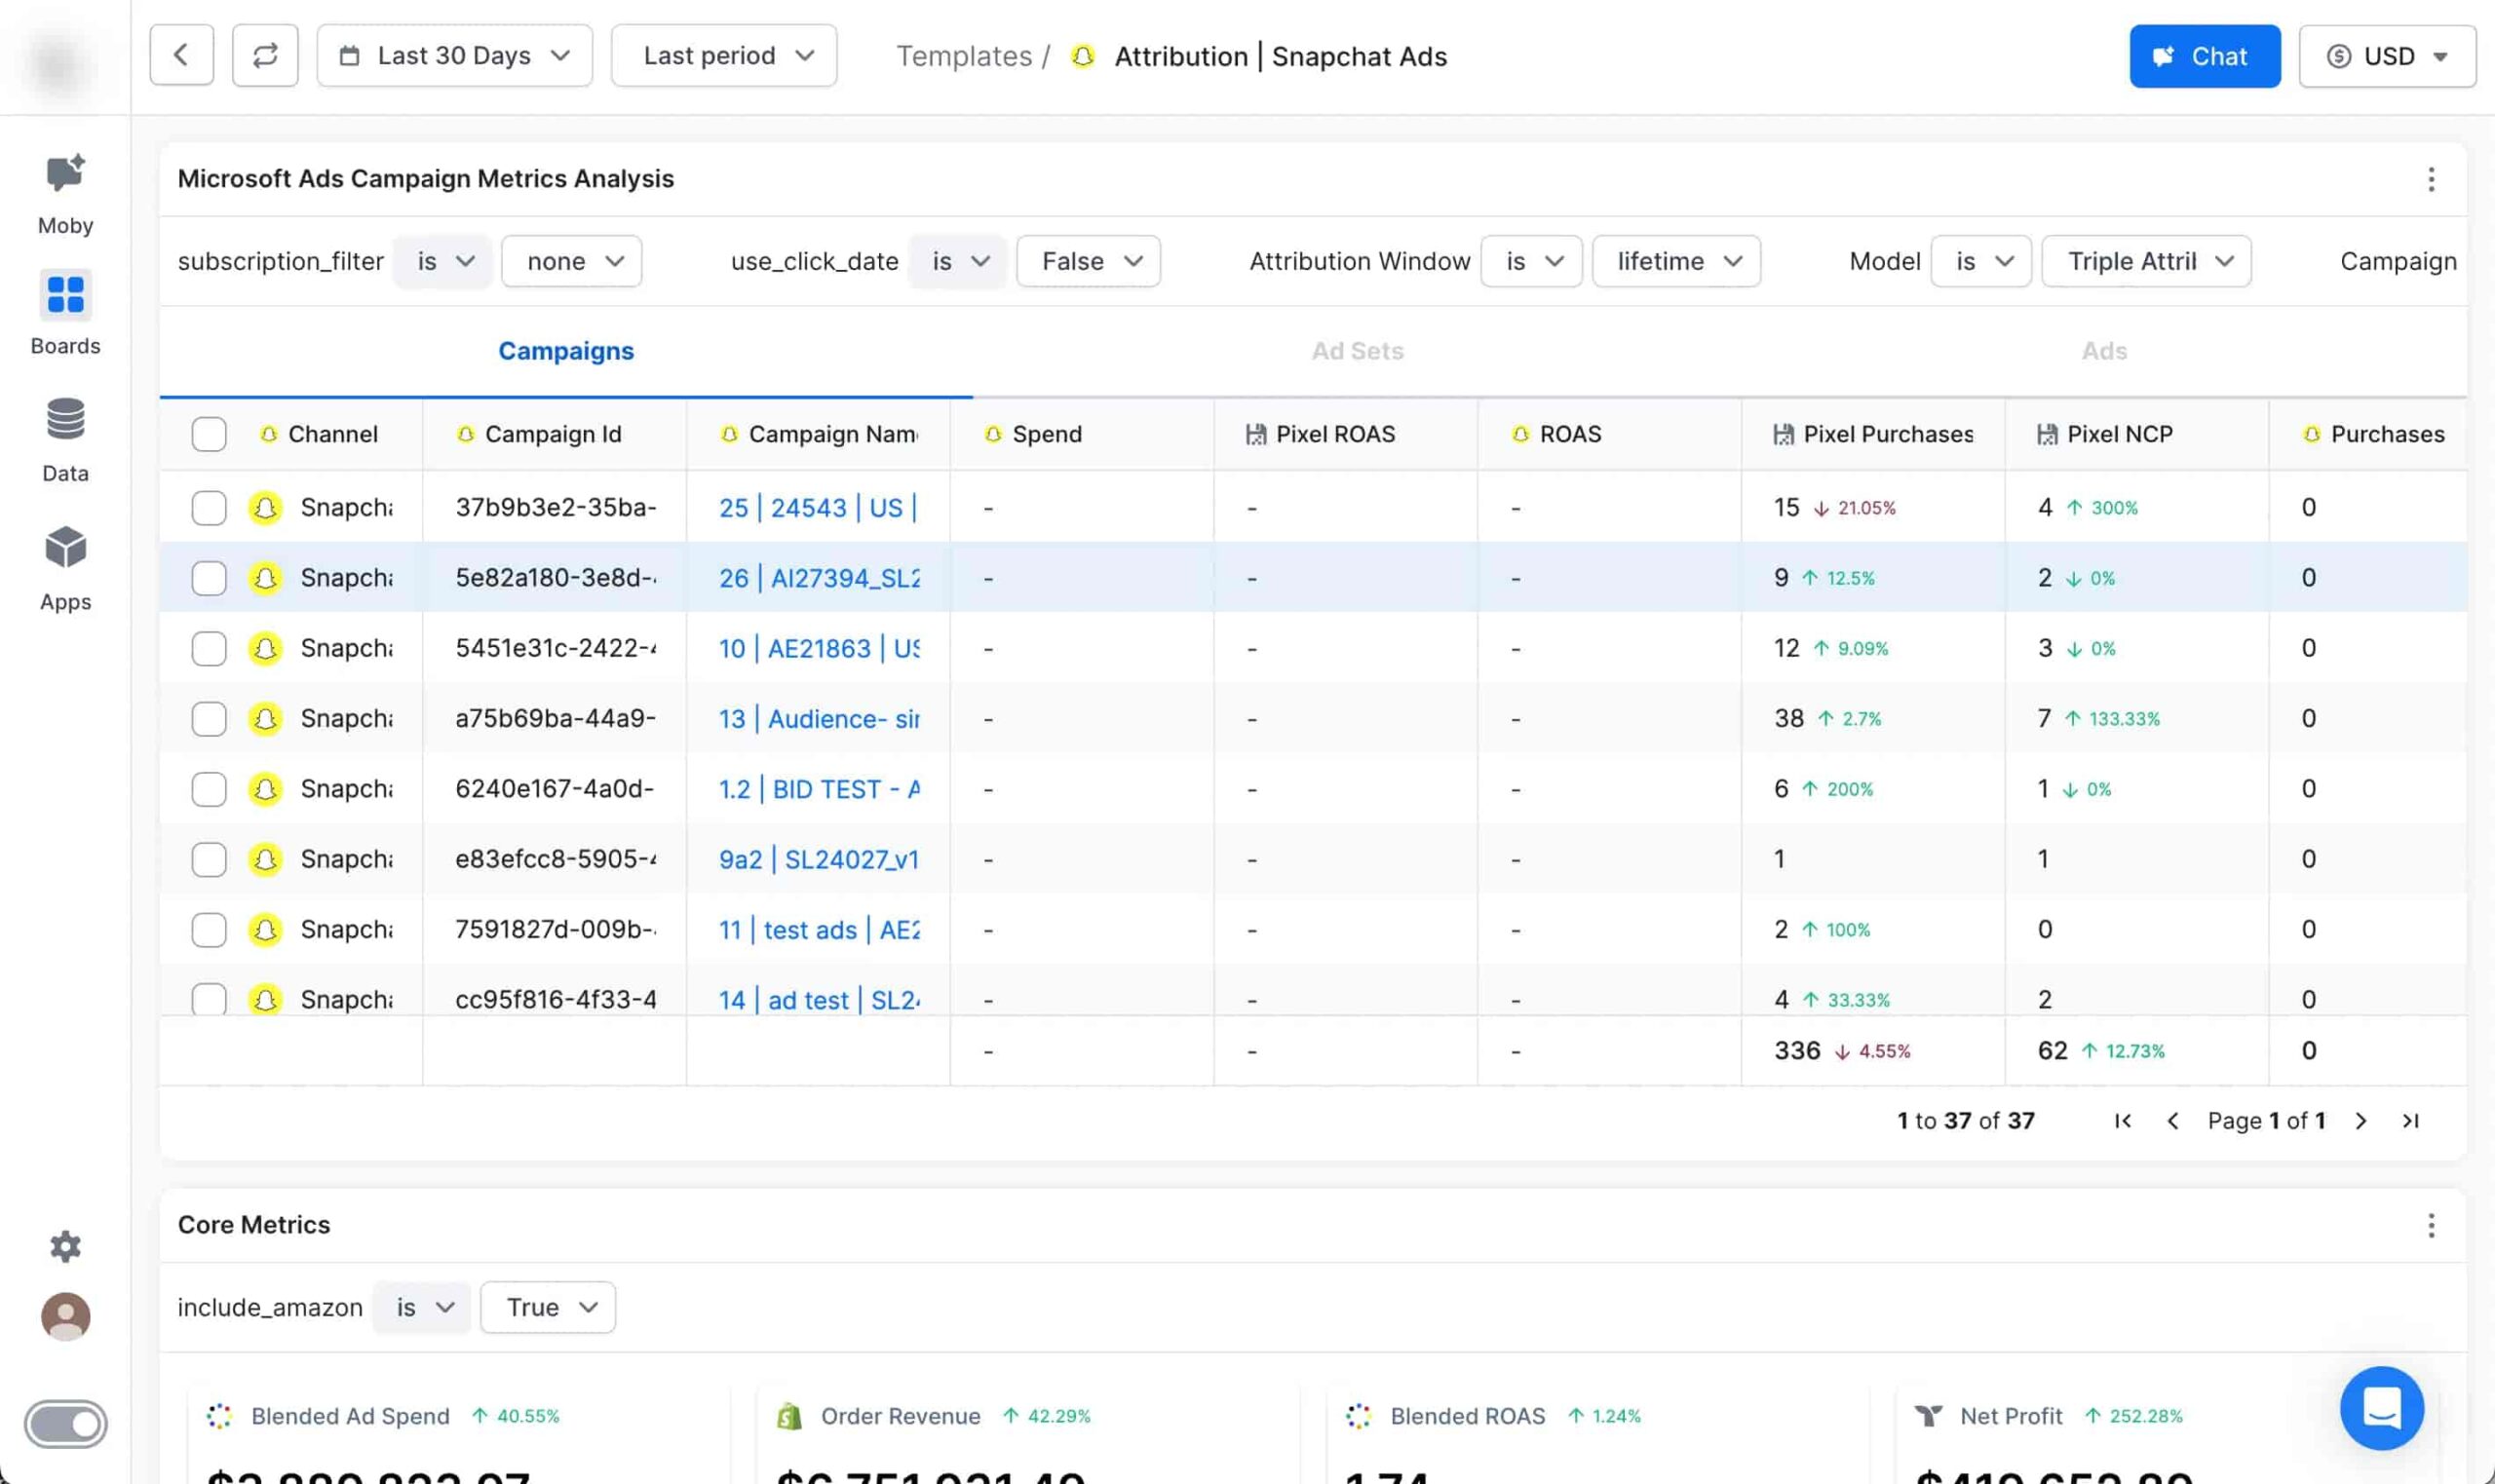
Source: Triple Whale
Triple Whale connects directly to Snapchat Ads so you can track your paid campaigns alongside other sales channels. It pulls in ad results and Snap Pixel events, giving you attribution, conversion tracking and cross-channel analytics in one place.
5. Whatagraph
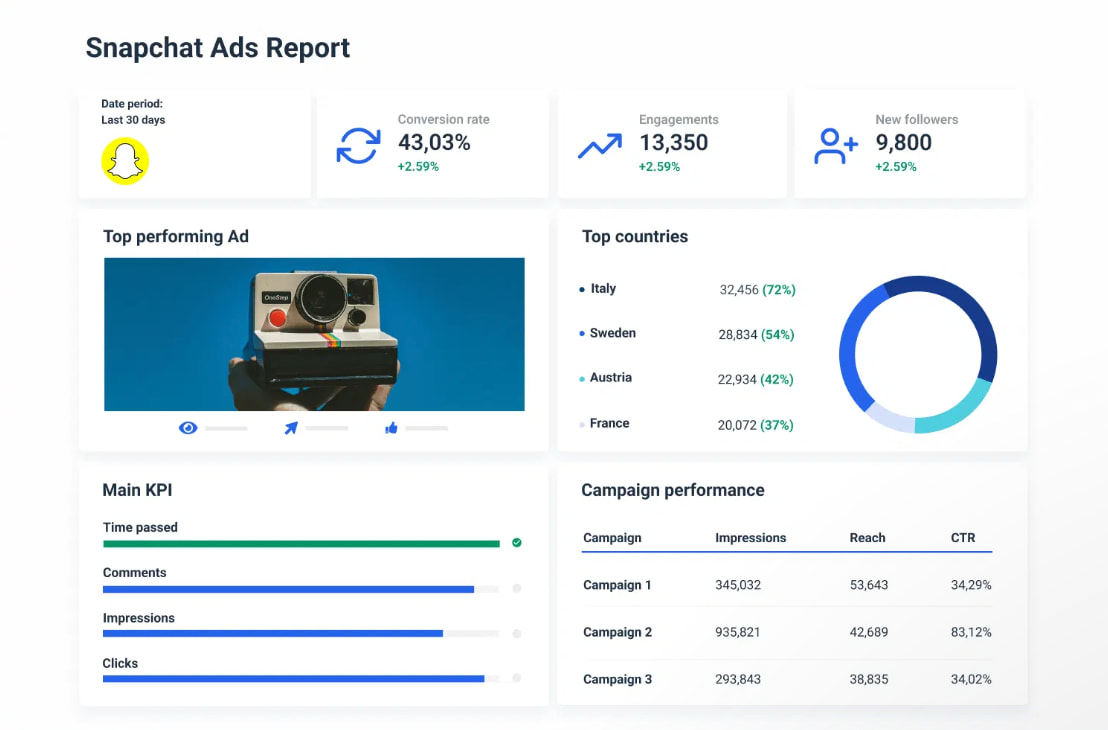
Source: Whatagraph
Whatagraph turns your Snapchat data and ad performance into polished, shareable reports. It collects KPIs across campaigns, ad sets and ads, blends them with other marketing channels and delivers readable dashboards and automated reports.
Start optimizing and growing your Snapchat presence
Snapchat analytics are more than just numbers; they are the roadmap to a more engaged community. When you dig into your Snapchat analytics, you start to turn disappearing content into strategies you can shape with intention. By tracking the posts that inspire action, you can build campaigns that lead to conversions, rather than guessing what works.
Ready to learn how to put this data into action? Check out our guide to using Snapchat for brand growth and take your strategy to the next level.
37 free social media strategy templates that will elevate your workflows
Published on December 5, 2025 Reading time 15 minutes

Share