Your definitive guide to LinkedIn engagement rate

Written by Emily Jenkins
Published on February 12, 2026
Reading time 9 minutes

Table of Contents
LinkedIn is the leading social platform for B2B companies, yet many brands still struggle to get consistent engagement on their posts.
If you want to improve your LinkedIn engagement rate, the first step is to make sure you’re measuring it accurately. This guide will show you the correct formula to calculate your engagement rate. You’ll also learn how to benchmark your LinkedIn performance and create content that truly resonates with your audience.
What is the LinkedIn engagement rate?
Your LinkedIn engagement rate is the percentage of people who engaged with your post after seeing it. This metric shows how effectively your content captures the attention of your target audience and sparks interaction.
Beyond views, the engagement rate reveals how many people actually responded to your content through reactions, comments, shares, clicks or follows.
Here’s how to measure your engagement rate on LinkedIn accurately so you don’t underreport strong content or overestimate posts that aren’t performing.
How to calculate your LinkedIn engagement rate
The industry-standard engagement rate calculator for LinkedIn is:
(Total engagements ÷ total impressions) × 100
Total engagement includes all the actions users can take on your post, such as reactions, comments, shares, post clicks and new follows.
Total impressions represent the number of times your content appeared in users’ feeds. This includes views from followers and non-followers, with each appearance counted individually, even if the same user sees it more than once.
Calculating post-level engagement rates shows you how individual posts performed and understand which topics, formats or messages make the biggest impact. You can also measure your page-level engagement rate to track overall performance and evaluate how well your LinkedIn strategy connects with your audience over time.
Why the right formula matters
Your LinkedIn engagement rate is most accurate and meaningful when it’s calculated based on the number of impressions, not follower count.
When brands measure engagement against their follower count, they’re assuming that every follower sees every one of their posts. That rarely happens on LinkedIn, so this approach skews the metrics.
For example, if you have 100 followers and 25 people engage, it looks like a 25% engagement rate. But if LinkedIn only showed the post to 50 people, your real engagement rate is 50%.
That’s why you need to measure your engagement rate against the people who actually saw your content, not the people who could have seen it. This shows you exactly what resonates, which helps you create more LinkedIn posts that encourage interaction.
This matters even more when you understand how the LinkedIn algorithm works. It rewards content that earns engagement, not content that simply comes from pages with a large number of followers.
When your engagement rate improves at the impression level, LinkedIn recognizes that your content is valuable and starts distributing it to a wider audience. Because you’ve already identified what your audience likes, that bigger audience is also more likely to interact, which helps your post engagement rate grow even further.
Simplify your LinkedIn tracking
It’s possible to calculate engagement rate manually, but the process is time-consuming and makes it harder to spot trends and compare posts, formats or reporting periods.
The right analytics tool can remove that friction. Sprout’s LinkedIn Pages Report, for example, automatically works out your engagement rate per impression, highlights top-performing posts and visualizes your data in real-time dashboards.
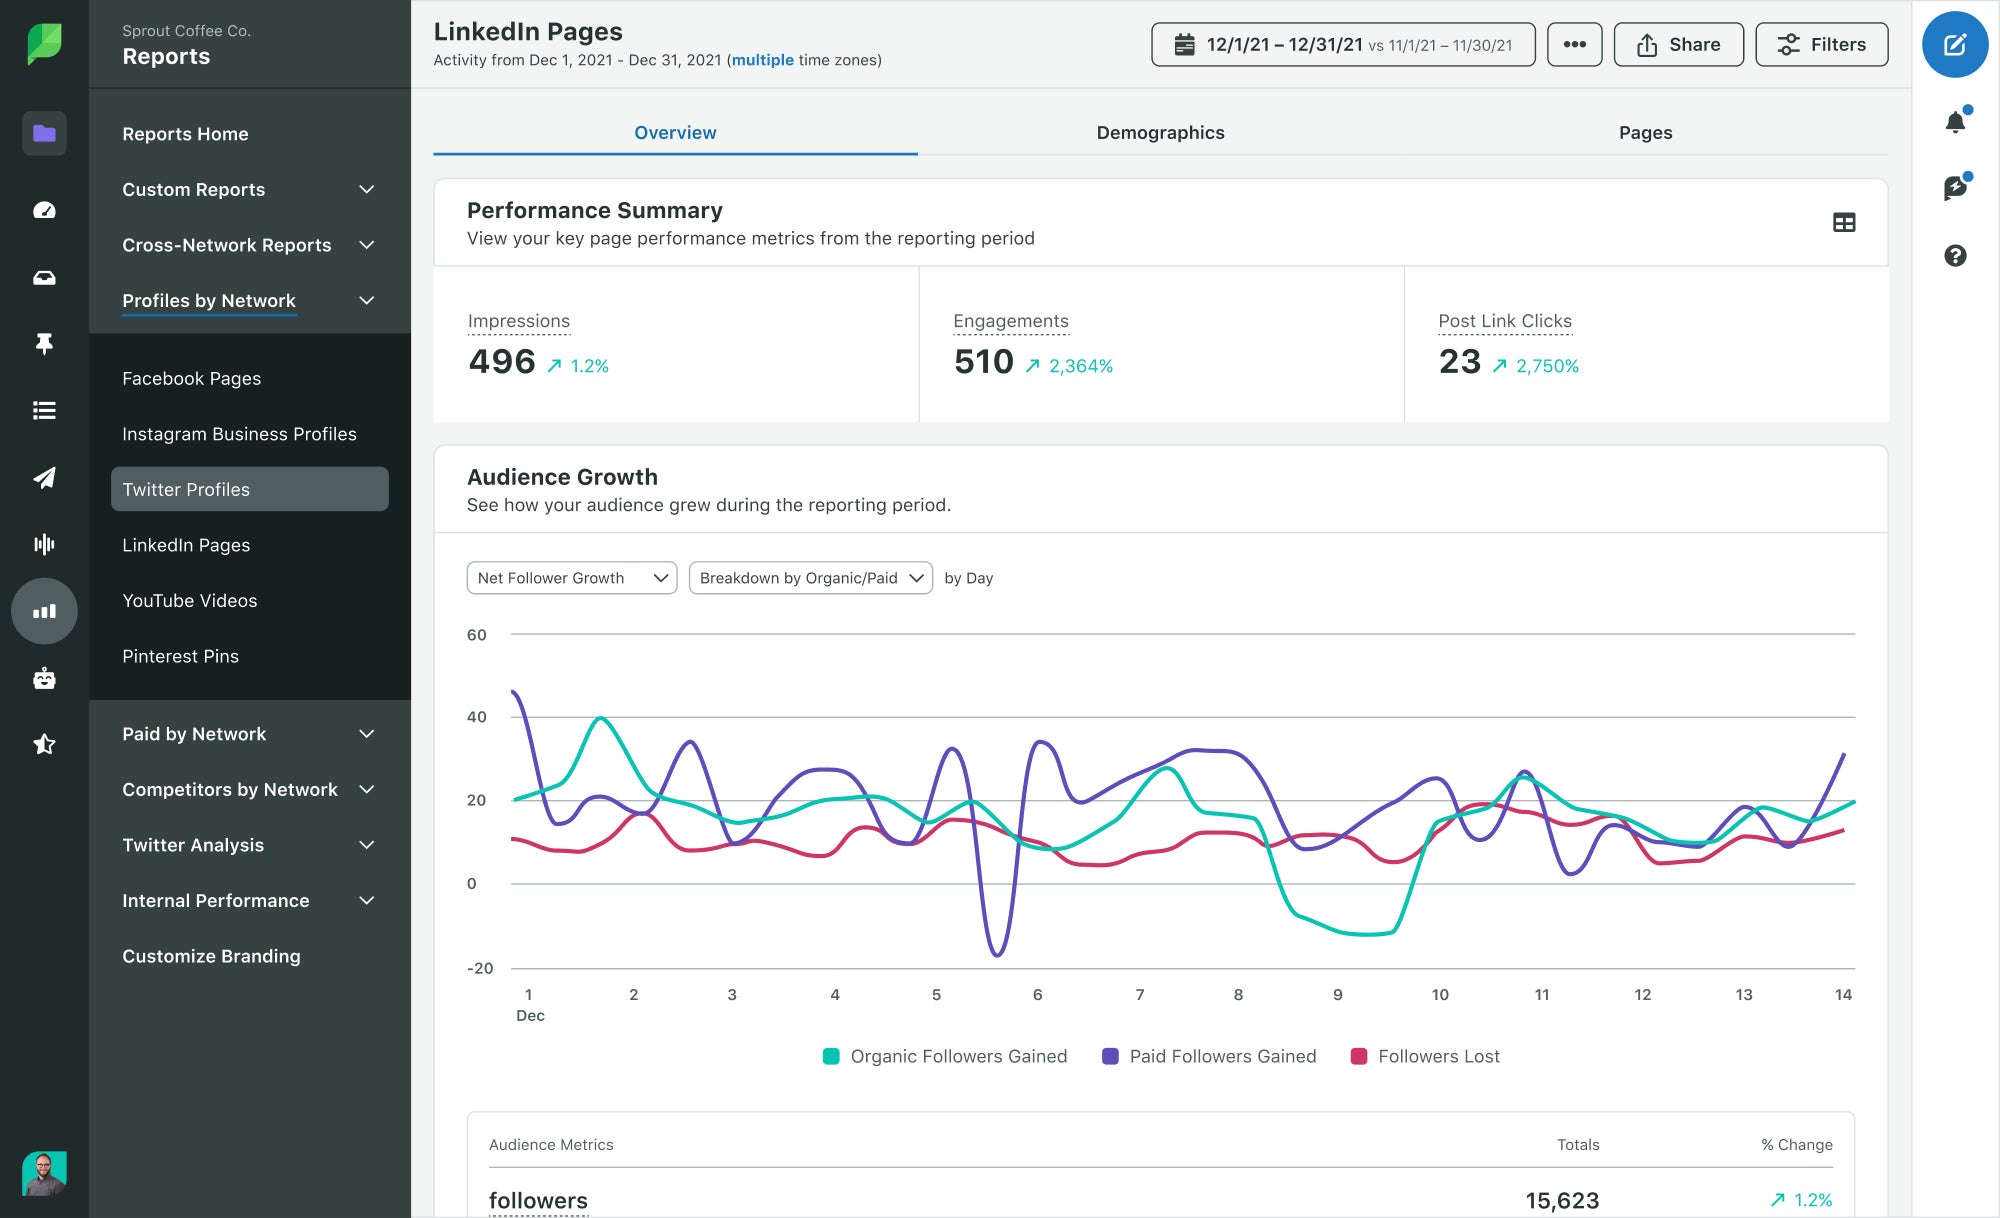
You can compare content types, track post performance over time, identify trends, benchmark against previous periods and export automated reports all in one place.
This helps you understand what’s driving engagement and make confident decisions about what to create next.
How to benchmark your LinkedIn engagement rate
Benchmarking gives your engagement rate context. It shows you how your posts stack up against industry averages, audience size norms and content format expectations.
Without that context, you might compare your engagement rate to your last post and assume it’s a strong result. But if you’re consistently below relevant benchmarks, it’s a sign your content isn’t resonating with your target audience as strongly as it could.
By comparing your actual performance with your potential performance, you can quickly spot hidden gaps and see where you can improve.
Here’s how to benchmark your LinkedIn engagement rate the right way.
Understanding industry benchmarks
According to Social Insider’s benchmarks, LinkedIn engagement rates averaged 5.19% in June 2025 across all industries.
However, averages vary widely depending on your sector. They’re a helpful starting point, but they don’t tell the whole story. Even within one industry, target audiences and engagement potential can differ.
For accurate benchmarking, you need to compare your performance against brands that share your audience profile and competitive space. This helps you understand what “realistic” engagement looks like for your content.
Tools like Sprout’s Competitive Reports make it easy to benchmark against your direct competitors without manual tracking. Simply add your competitors to the analysis tool, and it will generate an average engagement rate for your specific category, while comparing it directly with your own rate.
From there, you can dig deeper into your competitors’ publishing behavior and top-performing posts to understand what’s working for audiences just like yours.
Engagement rate vs. follower size
Brands with larger followings often see lower engagement rates. That doesn’t necessarily mean their content is weak. It might mean that their audience is more diverse, less niche or less active.
In contrast, smaller pages often have a more focused audience who follow because they genuinely care about the brand. That connection makes them more likely to engage thoughtfully.
LinkedIn rewards that kind of interaction, so highly engaged posts from smaller accounts may reach a larger percentage of their audience than posts from large brands with broader, less invested followers.
This is why benchmarking engagement rate is more valuable than comparing raw reach or follower count. It tells you whether your content connects with the people who actually see it, not just the people who might have seen it.
Benchmarking against content type
Different post types drive different levels of engagement, so your benchmarks should reflect the formats you use.
According to Social Insider, multi-image posts generated the highest LinkedIn engagement rate in 2025 at 6.60%, followed by native documents at 5.85% and video posts at 5.60%.
These formats encourage interaction because they slow the scroll, unpack ideas and invite people to pause and engage. Text-only posts and single images still perform well, but they typically sit closer to the 4%–4.8% range.
LinkedIn also favors native content that keeps users on the network. Just Connecting’s Algorithm Insights 2024 report found that including an external link in an original post could result in a 25-35% drop in reach rate.
Remember, these benchmarks are just an average. The post types that affect your audience might look very different. Rather than guessing what works, use a tool like Sprout’s Post Performance Report to track interactions across content types, compare topic themes and identify which post types drive higher engagement rates.
5 key drivers of LinkedIn engagement
If you want to boost your LinkedIn engagement rates, you need to understand what fuels interaction on the platform in the first place.
Here are five proven strategies to increase social media engagement and improve your LinkedIn content strategy over time.
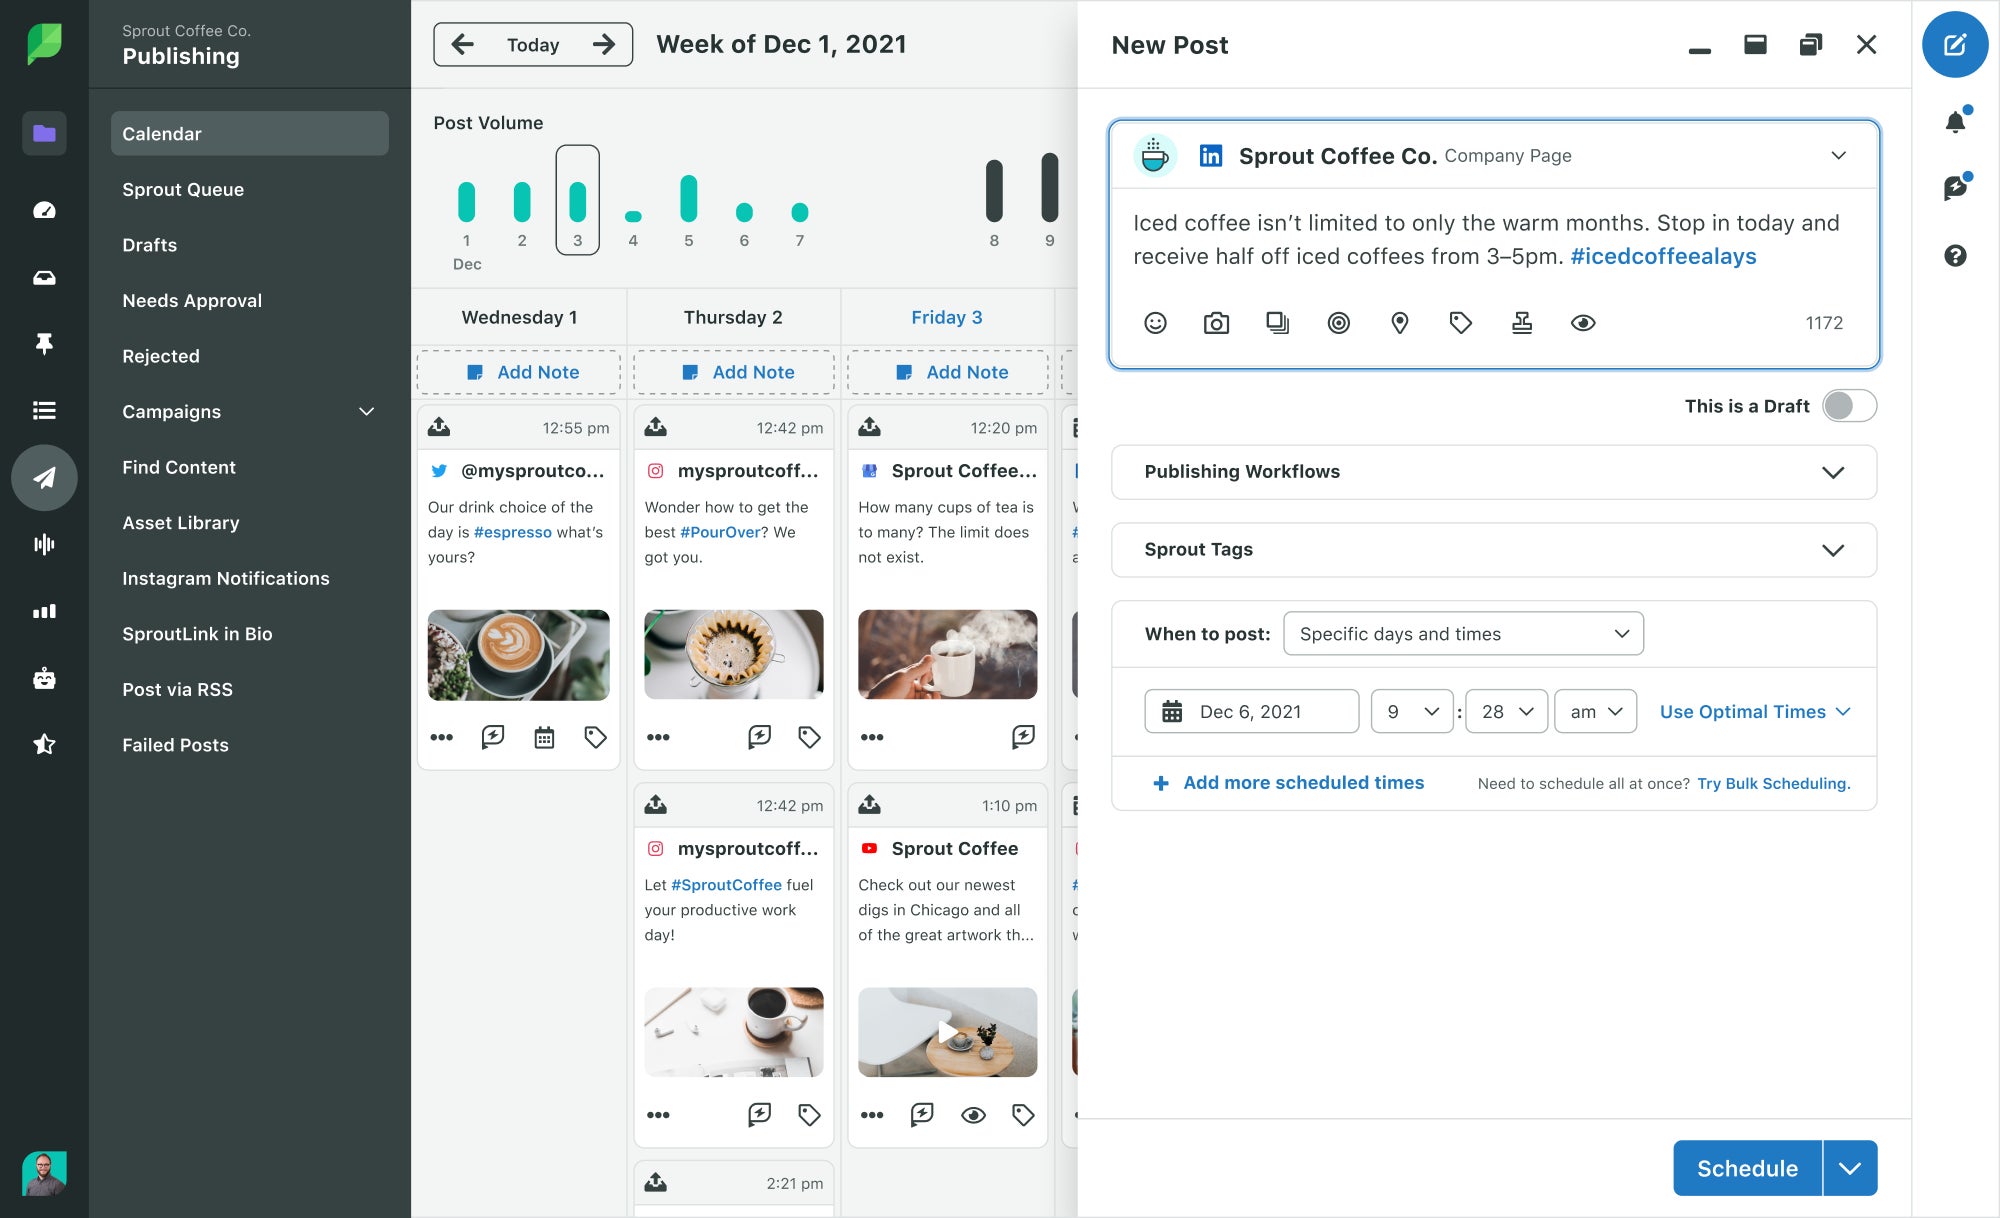
1. Stop the scroll with unexpected content formats
Formats like carousels, native documents, multi-image posts and short-form video drive stronger LinkedIn engagement rates because they get people to do something, like swipe, pause, click, reply or save.
But how you use these formats makes a difference. Rather than posting stuffy whitepapers or dense updates in static formats, turn your ideas into something people want to interact with.
For example:
- Share a quick video reaction to industry news
- Turn a mistake or lesson into a swipeable “what we’d do differently” carousel
- Post a 45-second video answering a question you get all the time
- Use a multi-image post to show a project from start to finish, not just the final result
When native formats prompt interaction, LinkedIn rewards them with more visibility. This, in turn, scales your engagement.
2. Master professional mindset and timing
LinkedIn is a professional network, so your post timings should reflect that. Engagement peaks during working hours, which is why the best time to post on LinkedIn is during the workweek.
But while the workweek gives you a starting point, it doesn’t show when your specific audience is ready to learn, connect and engage. Different industries and seniority levels are active at varying times, so you need to organize your posting schedule around real interaction patterns, not assumptions.
You can explore timing trends in LinkedIn Analytics and test manually. Or, skip the trial and error with Sprout’s ViralPost®. It analyzes real-time social media analytics to identify when your audience is most likely to interact and shows you optimal times to post.
3. Lead conversations, not announcements
LinkedIn rewards posts that start conversations. Instead of sharing one-way updates, try creating content that invites your audience to respond.
Ask a question, share a strong opinion, run a poll or offer an insight they can react to. When people feel like you’re talking with them instead of at them, they’re more likely to jump in.
Remember, comments matter more than likes on LinkedIn. They signal deeper engagement, which tells the algorithm your post is worth showing to more people. The more you encourage dialogue, the longer your content stays visible in feeds.
4. Leverage employee advocacy and leadership voices
People trust people over faceless company pages. So when employees, founders or subject matter experts share brand content, it feels more credible, relatable and worth responding to. It humanizes your brand.
And there’s a reach benefit too. When your team reposts, comments on or tags your content, you’re tapping into their professional networks too. That means more visibility and more interaction than simply posting that content on your LinkedIn company page.
5. Engage fast and with empathy
Timely, thoughtful responses are just as valuable as the post itself. Fast engagement shows you’re active, attentive and invested, which boosts credibility. In fact, the 2025 Sprout Social Index™ shows nearly 75% of buyers expect brands to get back to them within 24 hours on social, if not before.
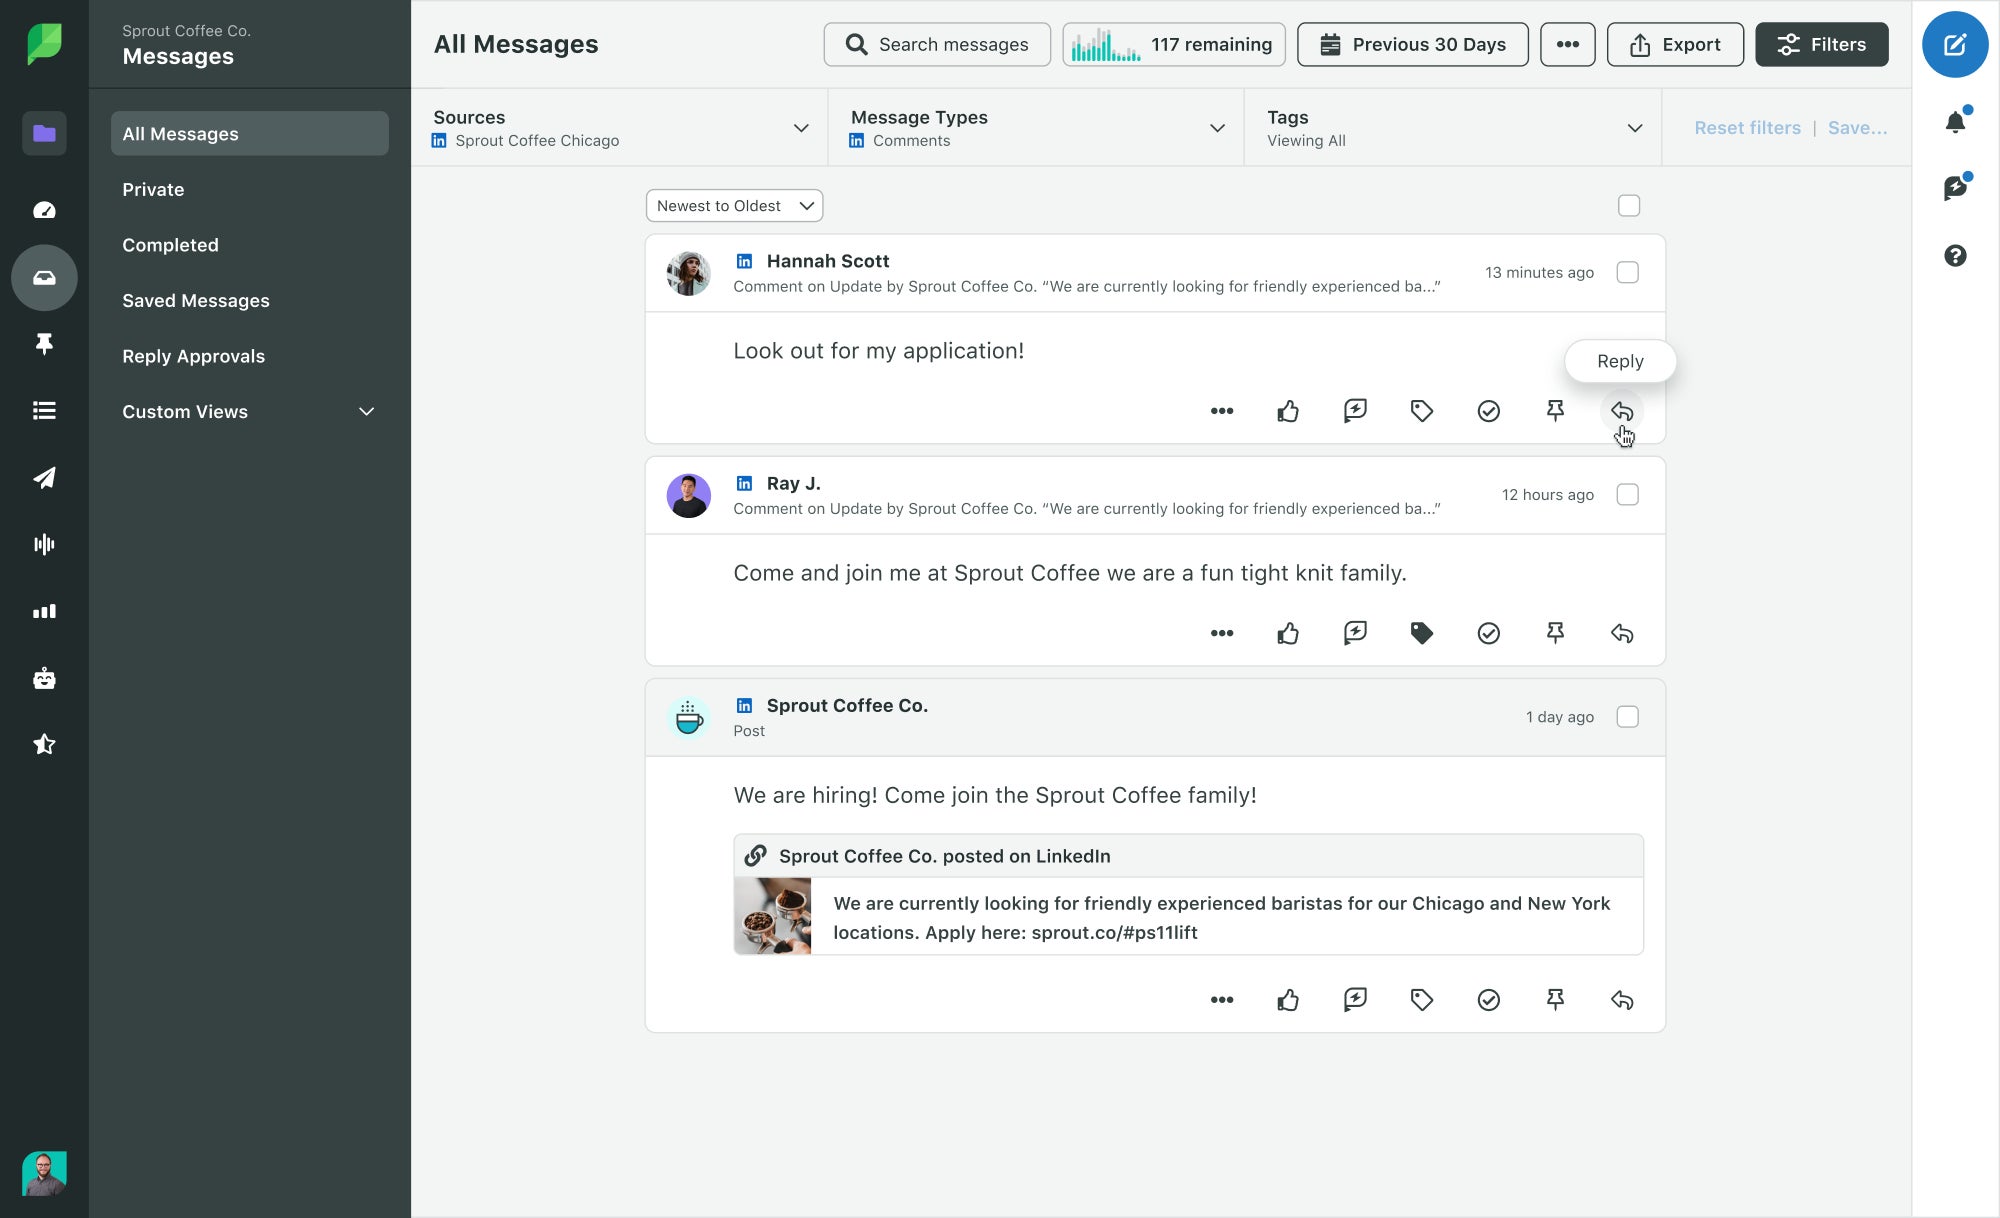
You can respond to comments and messages directly on LinkedIn, but if you’re managing multiple social networks, conversations can slip through the cracks—especially when engagement is happening across comments, mentions, reposts and DMs.
Sprout’s Smart Inbox helps you stay on top of every interaction by consolidating all your social communications in one feed. That way, you avoid juggling tabs and never miss an opportunity to keep the conversation going.
How to turn engagement data into strategic insights
Strong LinkedIn engagement rates are only the starting point. To make better decisions, you need to understand the patterns behind the numbers—who’s engaging, what they care about and why certain posts perform better than others.
This deeper view turns your engagement rate from a simple metric into a strategic tool that guides your content marketing strategy. Here’s how to extract insights from your engagement data.
Track audience-specific performance
High engagement only matters when it comes from the right people. To make sure you’re reaching your target audience, break down engagement by seniority, job function or region to see which segments respond to which topics or formats.
When you know what different groups engage with, you can tailor content to attract the right interactions.
Turn engagement into action with content tagging
When every post sits in the same report, it’s almost impossible to tell why one performed better than another. Was it the format, audience or intent?
To understand what’s truly driving engagement, you need to compare posts with a shared purpose, like thought leadership, product education or culture, and see how each group performs.
Tools like Sprout’s Premium Analytics (available as a paid add-on) help you see these granular details.
You can tag your posts by theme, format, campaign or intent to see which types consistently earn higher engagement per impression. These valuable insights help you create content that works for the right reasons, driving better LinkedIn ROI.
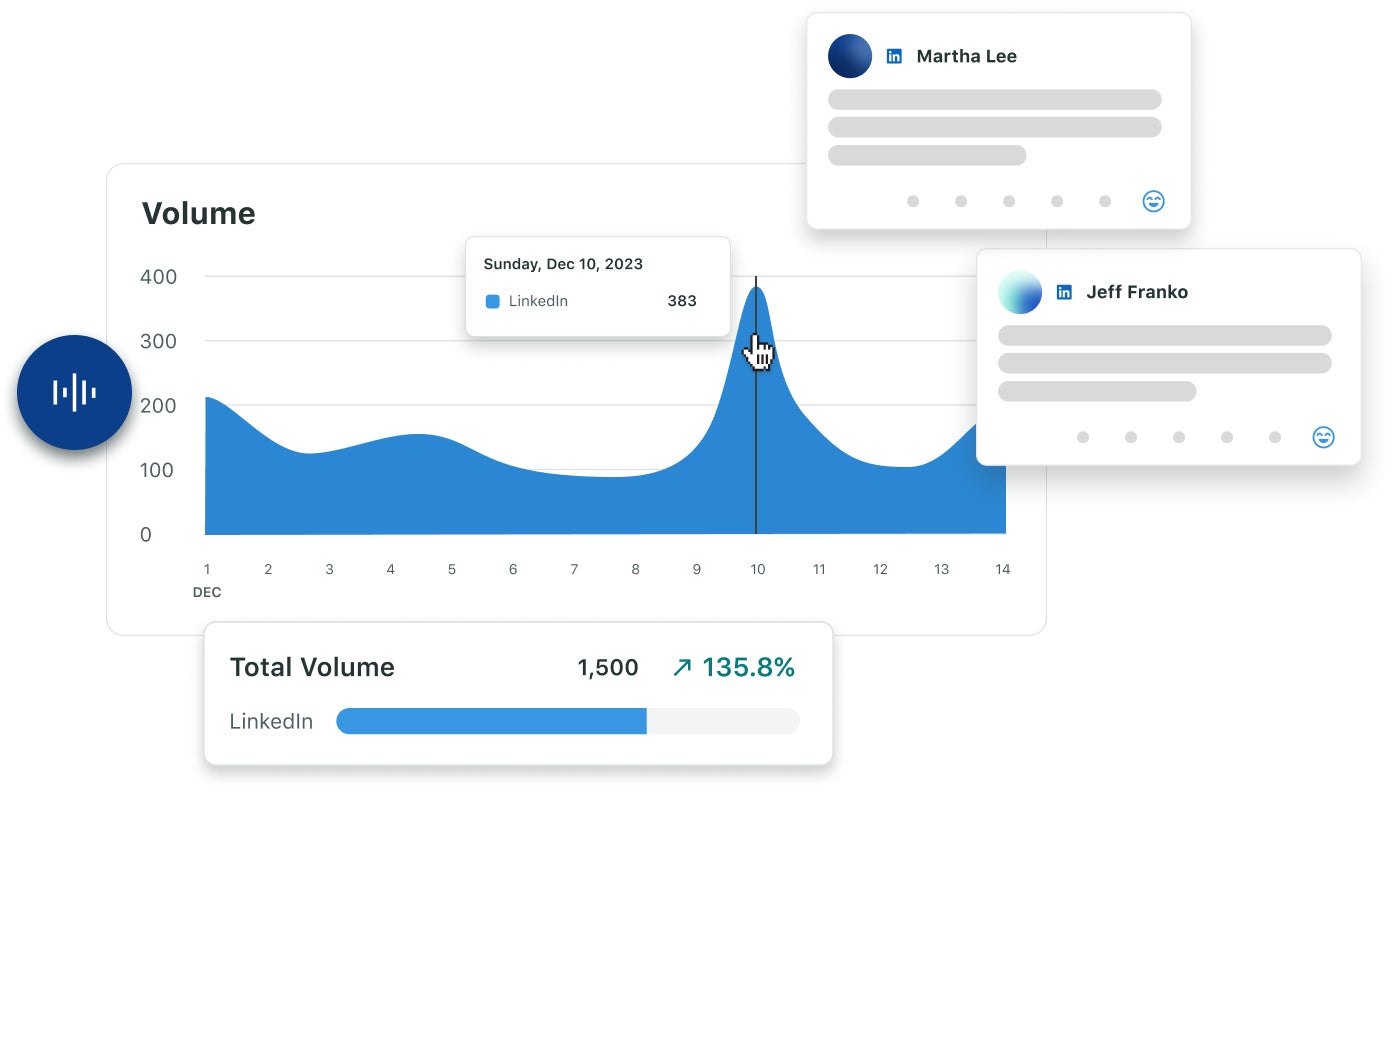
Inform strategy with social listening
Engagement metrics show who interacted, but not how people feel or what they’re talking about when they’re not engaging with your posts. That’s where social listening adds more context to guide your posting strategy.
Sprout Social Media Listening (available as a paid add-on), lets you analyze sentiment, track trending topics and see what your audience and competitors are actively discussing. This helps you understand what your audience cares about, so you can shape content around interests, join relevant conversations and position your brand where engagement naturally happens.
Avoid common LinkedIn engagement traps
Even strong performance can drop if you fall into these engagement traps:
- Mistaking reach for success. A post may reach thousands of people, but if only a handful interact, it isn’t truly performing. Reach only shows you how many people saw it, while engagement rate shows you how many people cared.
- Posting too often or chasing trends. More content doesn’t equal more engagement. Examine your analytics to determine how often to post. LinkedIn audiences respond better to thoughtful, targeted content than high volume or fly-by-night trends.
- Overproducing video. Video performs well, but overly polished content can feel distant. Authentic, human and story-led videos often earn higher engagement.
Make every LinkedIn interaction count
Every interaction on LinkedIn is a chance to learn what your audience values. Using the correct engagement rate calculation, based on impressions, gives you a clear picture of how your content performs when people actually see it.
Combine that with benchmarking, native formats, employee voices and audience insight, and you can confidently create content that earns stronger and more consistent engagement.
Ready to prove your team’s impact and track the metrics that matter? Request a demo of Sprout Social today.
FAQs for LinkedIn engagement rate
What is the correct LinkedIn engagement rate formula?
The standard LinkedIn engagement rate formula is: (Total engagements ÷ total impressions) × 100. This shows how many people who actually saw your post chose to interact with it.
What is a good engagement rate on LinkedIn?
Most brands see engagement rates between 3% and 5%, but top-performing content, especially native formats, often reaches 6% or higher, depending on industry and audience size.
What types of content have the highest engagement on LinkedIn?
The content types with the highest engagement are multi-image posts, native documents and video, because they encourage actions like swiping, pausing, saving and commenting.
37 free social media strategy templates that will elevate your workflows
Published on December 5, 2025 Reading time 15 minutes

Share