Facebook Analytics
Facebook analytics: A guide to Facebook insights
To help you get more out of your Facebook marketing, this guide breaks down the key metrics, tools and insights you need to connect with your audience and boost your results. To get deeper Facebook insights your brand can act on today, try Sprout free for 30 days.
Reading time 13 minutes
Published on July 8, 2026
Table of Contents
Summary
- Facebook is a top choice for marketers due to its massive user base and extensive analytics.
- Facebook analytics helps brands understand their audience, identify top-performing content and measure impact to fine-tune their Facebook marketing strategies.
- Meta discontinued native Facebook Analytics, but brands can still track performance using tools like Meta Business Suite, Creator Studio and Sprout Social.
Successfully navigating social gives your brand the upper hand. Facebook analytics provide a direct line to audience behavior, content performance and ad effectiveness, all in one place. Whether you run organic content, paid campaigns or both, understanding your data is the difference between a strategy that compounds and one that stalls. When paired with a broader social media analytics strategy, Facebook insights become even more powerful—revealing not just what’s working on one platform, but how your efforts connect across your entire social presence.
This guide breaks down how Facebook analytics work, why they matter for your brand and the best tools to build a comprehensive Facebook analytics report that drives real business decisions.
What is Facebook analytics?
Facebook page analytics refers to the collection of data and metrics—such as reach, engagement, follower growth and video retention—that brands use to measure the impact of their organic and paid social media strategies.
To turn this raw data into actionable business intelligence, social teams rely on a structured Facebook analytics report. While Meta retired its original Facebook Analytics tool in 2021, comprehensive Facebook metrics reporting remains available through Meta Business Suite, Page Insights and third-party tools. These insights help you identify what’s working, what formats drive meaningful results and where there’s room for growth.
Why is Facebook analytics data important?
Facebook analytics give brands the intelligence to measure performance, outmaneuver competitors and make decisions that drive real business impact, not just vanity metrics.
1. Analyze your competitors
Your Facebook Page analytics, located in Meta Business Suite, offer a wealth of information, including competitor performance. A social media competitive analysis reveals how your content performance compares with others in your industry. By tracking engagement trends, posting cadence and audience growth across competitor Pages, you gain context on what resonates with shared audiences and where your strategy stands out.
Track these benchmarks to stay ahead:
- Posting frequency and content format mix
- Engagement rates and follower growth
- Cross-platform presence and content themes
Learn from competitors’ wins, gaps and missteps to create content that connects more deeply with your target audience.
2. Monitor your performance
Posting content is just the beginning. Facebook analytics lets you monitor both your Page and individual post performance across organic and paid content. Track reach, engagement and clicks to reveal what your audience responds to.
Data from the 2026 Social Media Content Strategy Report shows that marketers are increasingly focused on doing more with less by prioritizing high-impact posts over high-volume posting.
This is how the team at Lemonade utilized Sprout Social to organize real-time data and message tagging. By identifying which products and experiences drove the most conversation, they abandoned the traditional industry playbook for intentional audience engagement, yielding a 758% increase in impressions and a 1,373% increase in engagements in a single year.
3. Gather audience insights
Facebook analytics reveal patterns in audience behavior: when followers are most active, which formats drive the most interaction and how different audience segments engage with your content. Use this data to shape content and campaigns that reflect your audience’s preferences.
If video posts outperform static images or engagement spikes on weekends, those trends tell you where to focus. Data-backed content decisions replace guesswork with strategy.
4. Facilitate strategic decision-making
Analyzing metrics tied to your Facebook KPIs delivers the social intelligence needed to lead the market rather than react to it. Data from our 2026 Social Media Content Strategy Report shows 70% of marketing leaders agree that Facebook has the strongest impact on their brand compared to any other platform.
The value of social data extends well beyond marketing. When teams apply AI-driven analysis to raw performance data, those insights inform product development, sales strategy and broader business decisions, turning Facebook analytics into a company-wide competitive asset. Use your Facebook strategy as the foundation for that intelligence, not just a social media platform plan.
Essential Facebook analytics KPIs to track
The Facebook analytics metrics that drive real business decisions fall into eight core categories: Page metrics, post insights, video analytics, pixel analytics, ads analytics, competitive analytics, sentiment analysis and hashtag analytics. Here’s what each one measures and why it matters.
Facebook Page metrics
- Reach: The number of unique viewers who saw your Page, including both organic and paid reach.
- Impressions: How many times your Page appeared in someone’s timeline.
- Engagement: All actions taken on your Facebook Page—reactions, link clicks, shares, comments, profile clicks and more.
- Likes: The total number of Page likes, including likes from ads. You can also view likes for individual posts.
- Follower metrics: Total followers, follower growth rate and audience demographics including language, age, gender and location.
Facebook post insights
- Post reach: The number of unique people who saw your post via paid or organic distribution.
- Post impressions: How many times a post appeared in someone’s timeline.
- Post engagement: Reactions, comments, shares and saves on a given post.
- Link clicks: The total number of clicks on links within the post.
Access post reach and engagement from the Insights section of your professional dashboard by navigating to the Manage Page menu. The professional dashboard and Insights tab are separate from the Meta Business Suite.

Meta Business Suite surfaces additional metrics like median post reach by media type and top-performing organic posts ranked by reach, reactions and comments.
Video analytics
Video analytics reveal how audiences interact with your video content, which is critical given that short-form video under 60 seconds drives the highest engagement on Facebook, according to the 2026 Social Media Content Strategy Report.
- Views: The number of times your video starts to play, whether auto-played or clicked.
- Watch time: Total time viewers spent watching your video, including replays.
- Average watch time: Total watch time divided by the number of initial views.
- Video percentage watched: The average percentage of your video that people played.
- Reels reach: The total number of people who saw your video at least once.
- Reels engagement: Shares, comments and reactions on your Reels.
- Live video metrics: Video views (plays over three seconds), unique viewers (individuals who watched more than three seconds) and average watch time.
Facebook pixel analytics
Add a Meta pixel to your website to track conversions, page views and cost per conversion directly tied to your Facebook activity.
Facebook ads analytics
Facebook ads analytics measure the performance of your paid campaigns. Track these core metrics:
- Cost per result: The average cost to achieve your target ad outcome. For example, $100 spent earning 50 clicks equals a $2 cost per result.
- Link clicks: Total clicks on links within the ad that directed users to a specified destination.
- Reach: The number of unique viewers who saw your ad.
Competitive analytics
Competitive analytics show how your brand stacks up against industry peers and surface opportunities to outperform them. Meta Business Suite does not provide competitor data—you need a social media management platform to pull metrics like reach, followers and engagement for your top competitors.
Sprout Social’s Facebook Competitors Report tracks any public Facebook Page and benchmarks it against yours, covering audience growth, engagement rates and sentiment—the data native tools don’t surface.
Sentiment analysis
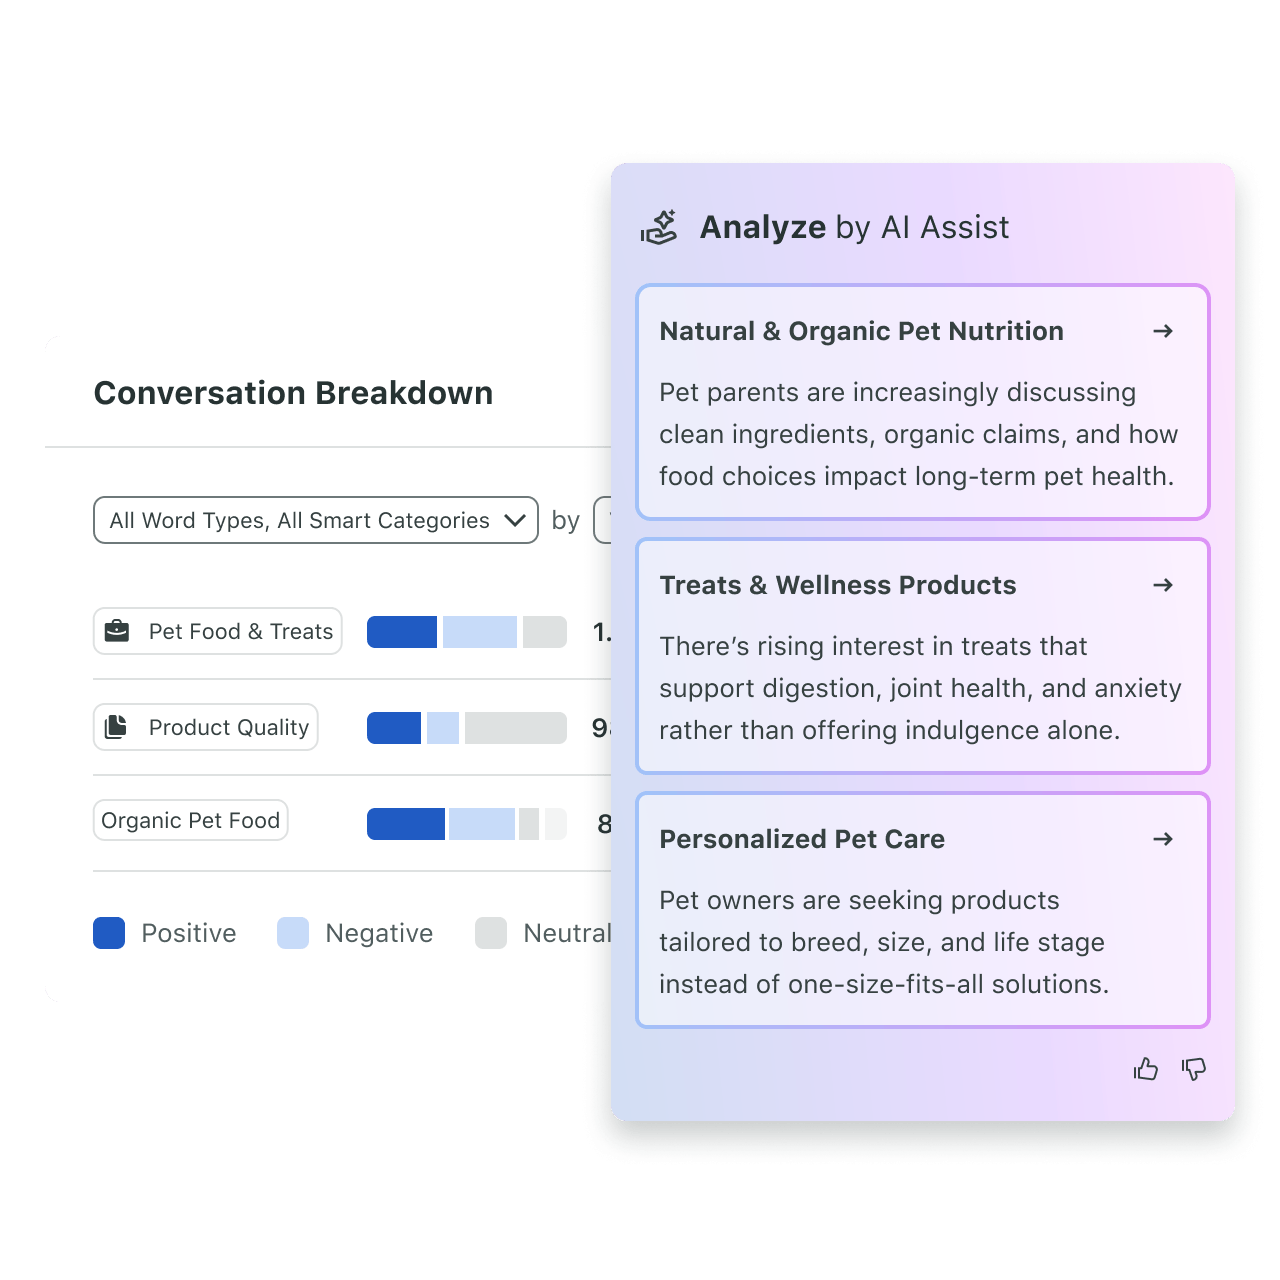
Sentiment analysis uses social listening to identify how audiences feel about your brand, competitors and industry trends. By tracking positive, negative and neutral conversations, marketers spot reputation shifts and emerging customer concerns in real time. Most analytics platforms offer a sentiment score that tracks the ratio of positive to negative messages your brand receives. In Sprout Social, the Conversation Breakdown widget inside the Social Listening report monitors the volume and sentiment of specific keywords, hashtags and phrases in real time—so you’re never the last to know when the conversation around your brand shifts. Facebook listening reveals the deeper context and conversations behind those engagement numbers.
Hashtag analytics
While hashtags play a smaller role on Facebook than on other platforms, monitoring hashtag analytics helps you identify trending conversations and tracking branded campaign tags. Use these insights to pinpoint which hashtags drive the most visibility in your industry.
How to build an actionable Facebook analytics report
Reporting isn’t just about dumping data into a spreadsheet—it’s about translating metrics into strategy. A comprehensive Facebook analytics report consolidates your Page’s performance data, highlighting your wins and revealing where you need to pivot.
Here is a step-by-step framework to create a Facebook analytics report that proves your ROI:
- Identify your core objectives: Are you optimizing for brand awareness (reach and impressions) or lead generation (link clicks and conversions)? Tie your metrics directly to your overarching business goals.
- Select your reporting tools: While Meta Business Suite offers native insights, analyzing data in a silo slows you down. A unified platform like Sprout Social allows you to pull Facebook page analytics alongside your other networks for a complete view of your social health.
- Customize your data views: Filter out the noise. Focus your report on the KPIs that matter most to your stakeholders by sorting by specific date ranges, campaign tags or content formats (like Reels vs. static posts).
- Extract the “why” behind the numbers: Don’t just report that engagement spiked. Use your data to explain why it happened. Did a specific video format resonate? Did a shift in posting cadence capture more of your audience?
- Set an automated schedule: Consistency is key for spotting long-term trends. Schedule your reports to generate weekly, monthly or quarterly so your team can make agile, data-backed decisions.
Tip: Sprout Social’s My Reports feature lets you automate this entire process, building presentation-ready reports with AI-generated summaries so you can focus on strategy, not manual data entry.
How to use native Facebook analytics
Access Facebook analytics through the Insights section in your Page’s professional dashboard or directly within Meta Business Suite. Both tools are connected and Meta Business Suite is accessible from the professional dashboard for easy navigation.
Some metrics are exclusive to each tool. The sections below walk through how to find key metrics in both.
How to use Facebook Page analytics
Access native Facebook Business Page insights by following these steps:
- Log into your account. If you’re using a desktop, select Pages from the left-hand navigation menu.
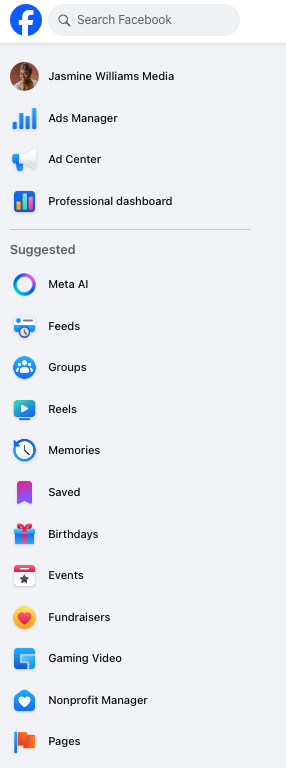
- Select the Page you wish to measure analytics.
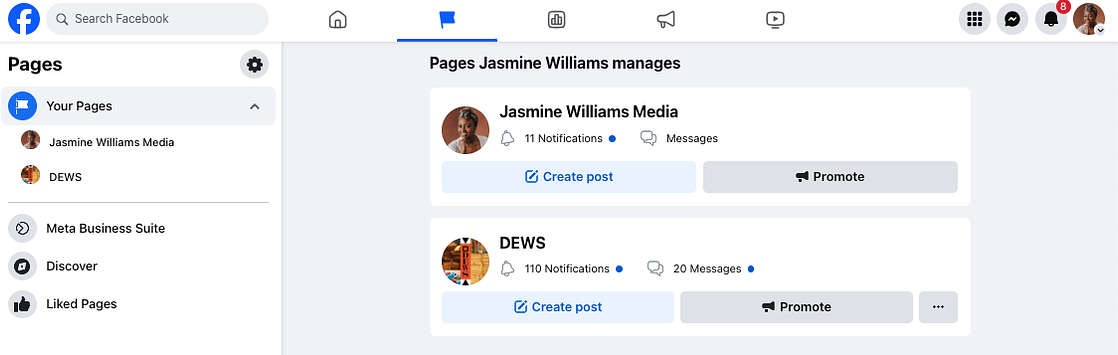
- Navigate to the professional dashboard or directly to the Insights tab. Tap Professional dashboard.
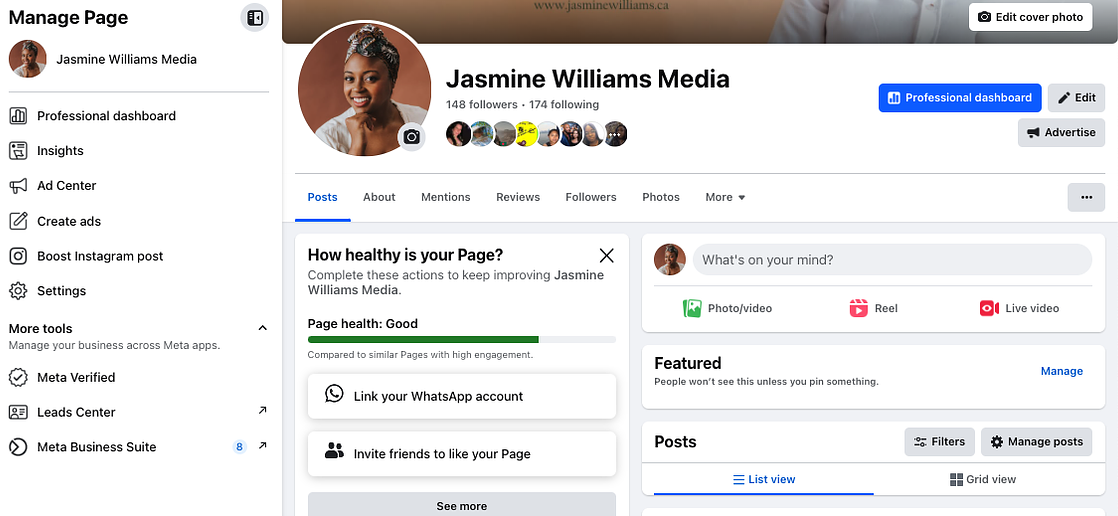
- The professional dashboard gives an overview of your Page performance. Click Home, Your Page, Content or Audience underneath the Insights tab on the left-hand menu to go deeper.
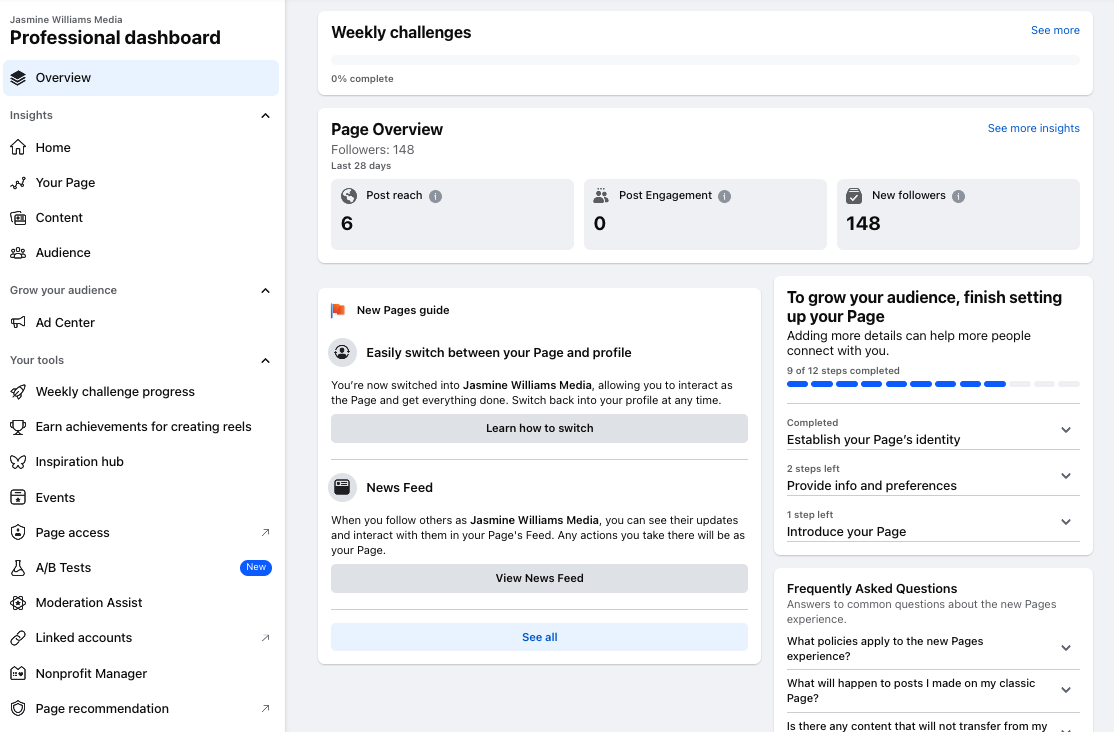
The left-hand menu of the professional dashboard is your gateway to deeper analytics. Key sections include:
- Page overview: Shows followers, post reach, post engagement, new Page likes, recent content and messages from the past 28 days.
- Actions on page: Review interactions including reactions, comments, shares, photo views and link clicks.
- Events: View events from the last 90 days, people reached, actions and responses.
- Videos: See how well your videos are performing.
- Follower insights: Under the Audience tab, find demographic data including age, gender and location of your followers.
How to access Meta Business Suite
Follow these steps to access Meta Business Suite:
- Log into your account. If you’re using a desktop, select Pages from the left-hand navigation menu.
- Select Meta Business Suite.
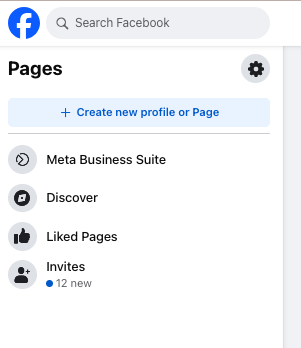
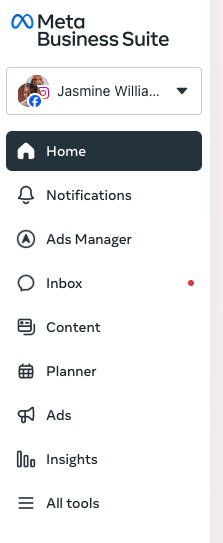
Meta Business Suite contains several dashboards, each serving a distinct purpose:
- Home: An overview of recent activity across your Meta accounts, with high-level content performance stats and notifications.
- Inbox: A unified messaging hub for Facebook Messenger, Instagram DMs and comments, with automation features like saved replies and inbox labels.
- Content: A calendar view and feed of all posts — published, scheduled and draft — with performance metrics like reach, engagement and post type breakdown.
- Insights: An in-depth analytics dashboard covering overall metrics like views, reach, interactions and follows, post-specific performance and follower demographics.
Before diving into Facebook analytics data, lock in your core metrics first. Knowing which KPIs matter most makes it faster to spot patterns and identify what’s driving results.
How to use Facebook analytics in Sprout Social
Connecting your Facebook Pages to Sprout Social takes minutes. Follow these steps to start pulling actionable Facebook analytics into a centralized dashboard.
Step 1: Start a free 30-day trial by setting up an account with your business email—no credit card required.
Step 2: Go to Account and Settings and click Connect a Profile.
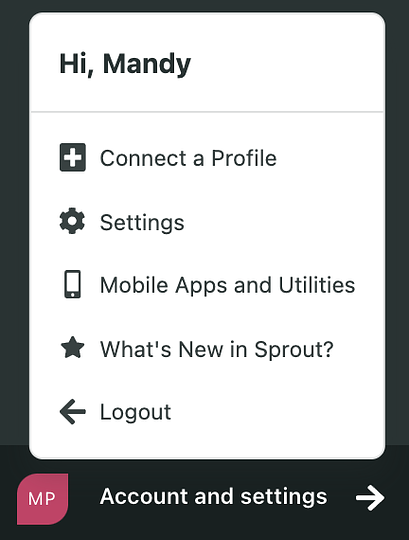
Step 3: If needed, select a group for this Page from the In Group dropdown.
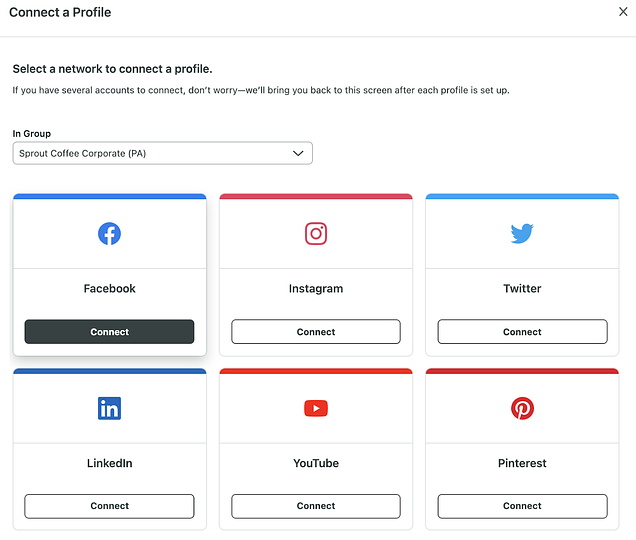
Step 4: Click Connect for Facebook, then click Connect Page to link your Facebook Page.
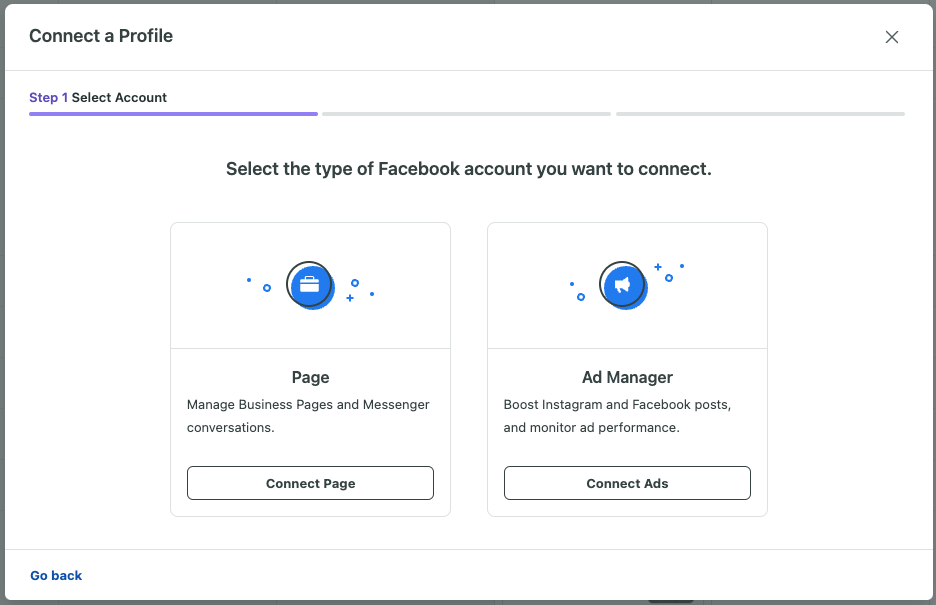
Step 5: Click Go to Facebook and follow the instructions to authorize the connection.
Step 6: Navigate to Reports > Profiles by Network > Facebook Pages.
Note: Facebook Page demographics are delayed 48–72 hours and only appear when data exists for 100 or more people.
Step 7: Customize your view to focus on the specific Facebook profiles you want to analyze, compare strategies across pages and zero in on individual performance.
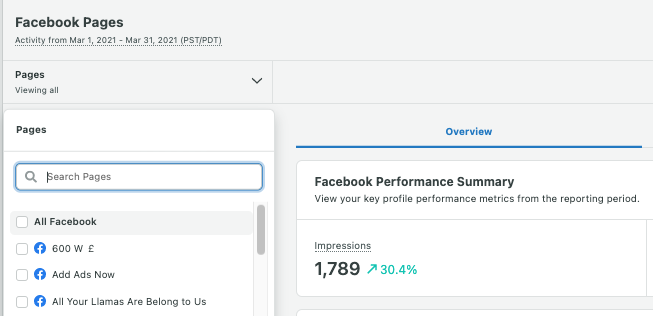
Facebook analytics reports in Sprout Social
Sprout’s automated reporting tools pull your Facebook data into a centralized dashboard, turning raw metrics into visual insights you can share with stakeholders. Here’s what each report delivers.
Profile Performance gives you a high-level view of your core KPIs:
- Impressions: See how often your content was displayed.
- Engagements: Track how users interact with your posts.
- Post Link Clicks: Measure how effectively you’re driving traffic to your website. This metric tracks clicks on links within your posts, not other interactions.
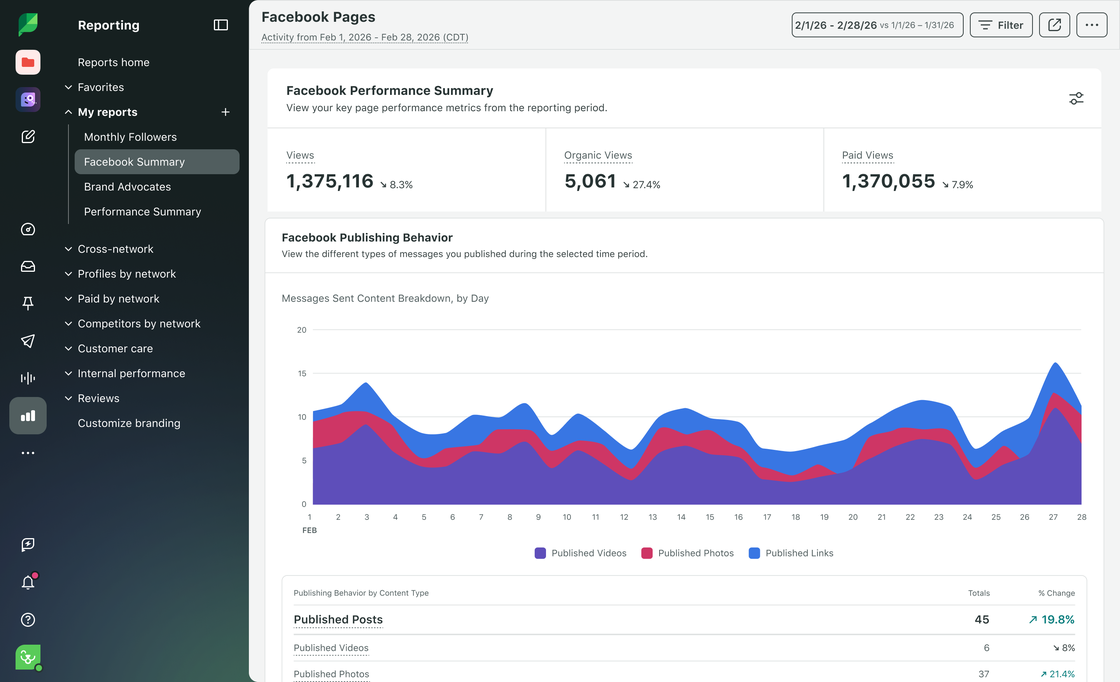
The Facebook Pages report tracks audience growth with precision:
- Fans: Monitor total page likes to track overall growth trends.
- Net Page Likes: See true audience growth by factoring in both likes and unlikes.
- Organic vs. Paid Page Likes: Identify whether organic efforts or paid campaigns are driving new fans.
- Page Unlikes: A spike in unlikes signals a content or strategy misstep—investigate immediately.
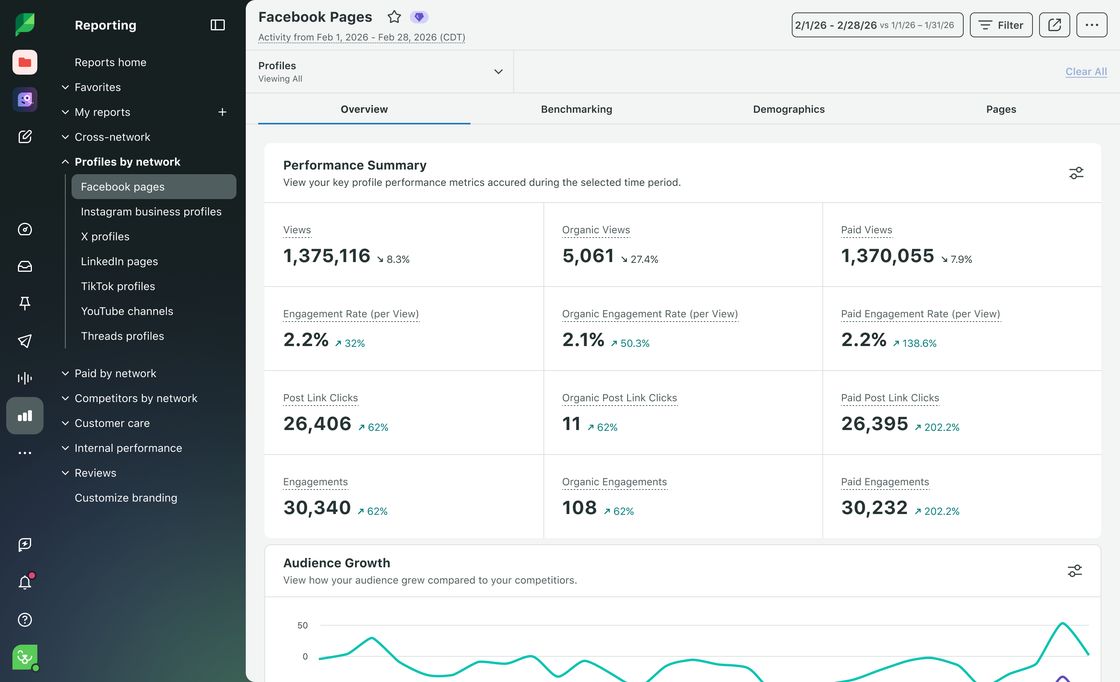
The Post Performance report shows you exactly what content is working and what isn’t:
- Photos, Videos & Posts: See your content mix breakdown and experiment to find what resonates with your audience.
- Total Posts: Track posting frequency. Consistency matters, but quality drives results.
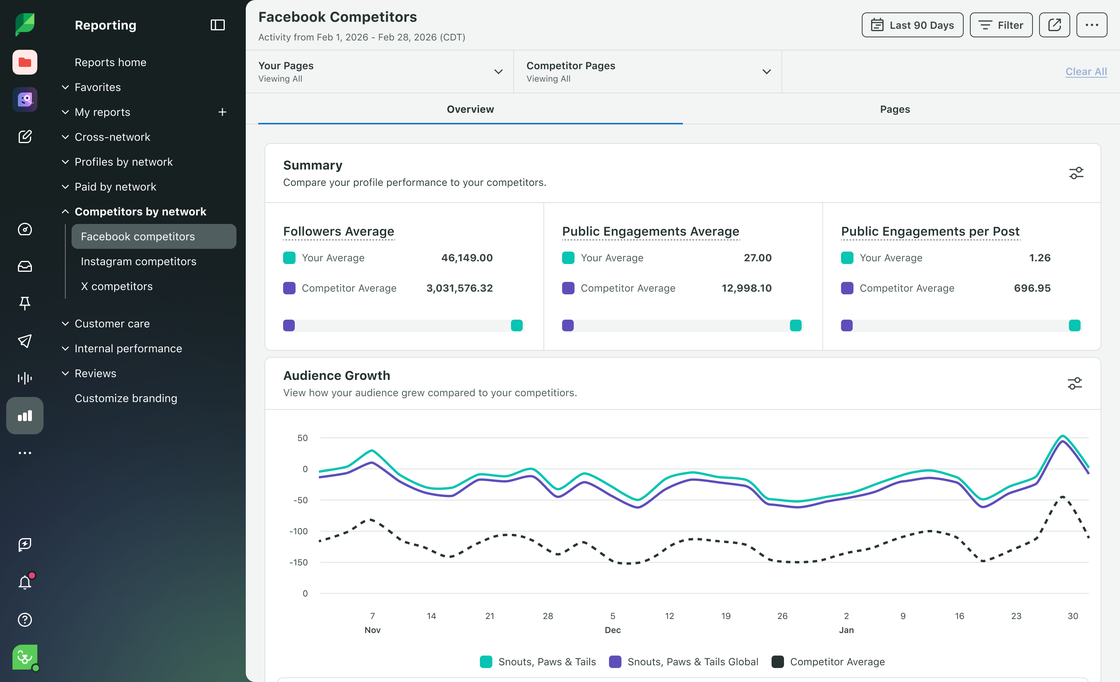
The Facebook Competitors Report tracks any Facebook Page and benchmarks their presence against yours. Key metrics include:
- Fans Average: The number of users who like a competitor’s page.
- Public Engagements Average: How many times users engaged with competitor posts.
- Public Engagements per Post: A per-post view of competitor engagement performance.
- Audience Growth: Compare your audience growth trajectory directly against competitors.
- Sentiment Analysis: Understand how people feel about your brand versus the competition.
The Social Listening report is your go-to for hashtag analytics and conversation tracking. Use the Conversation Breakdown widget to monitor the volume and sentiment of specific hashtags, keywords and phrases in real time.
Facebook analytics tools to generate business insights
Meta sunset its native Facebook Analytics feature, but purpose-built tools now go far beyond what it ever offered, turning raw Facebook data into decisions that drive real business impact. Here are two essential tools to know. For a comprehensive breakdown, explore the full guide to Facebook analytics tools.
Sprout Social
Sprout Social is an AI-powered Social Intelligence Platform that integrates with Facebook, Instagram and other major social media platforms. It goes far beyond basic reporting—Trellis, Sprout Social’s cross-network AI agent, lets you ask natural-language questions across your Facebook publishing, inbox, listening and reporting data, surfacing answers without the manual pull. AI Assist generates report summaries, captions, alt text and video subtitles, while social listening and competitor analysis surface the deeper insights your team needs to act with confidence.
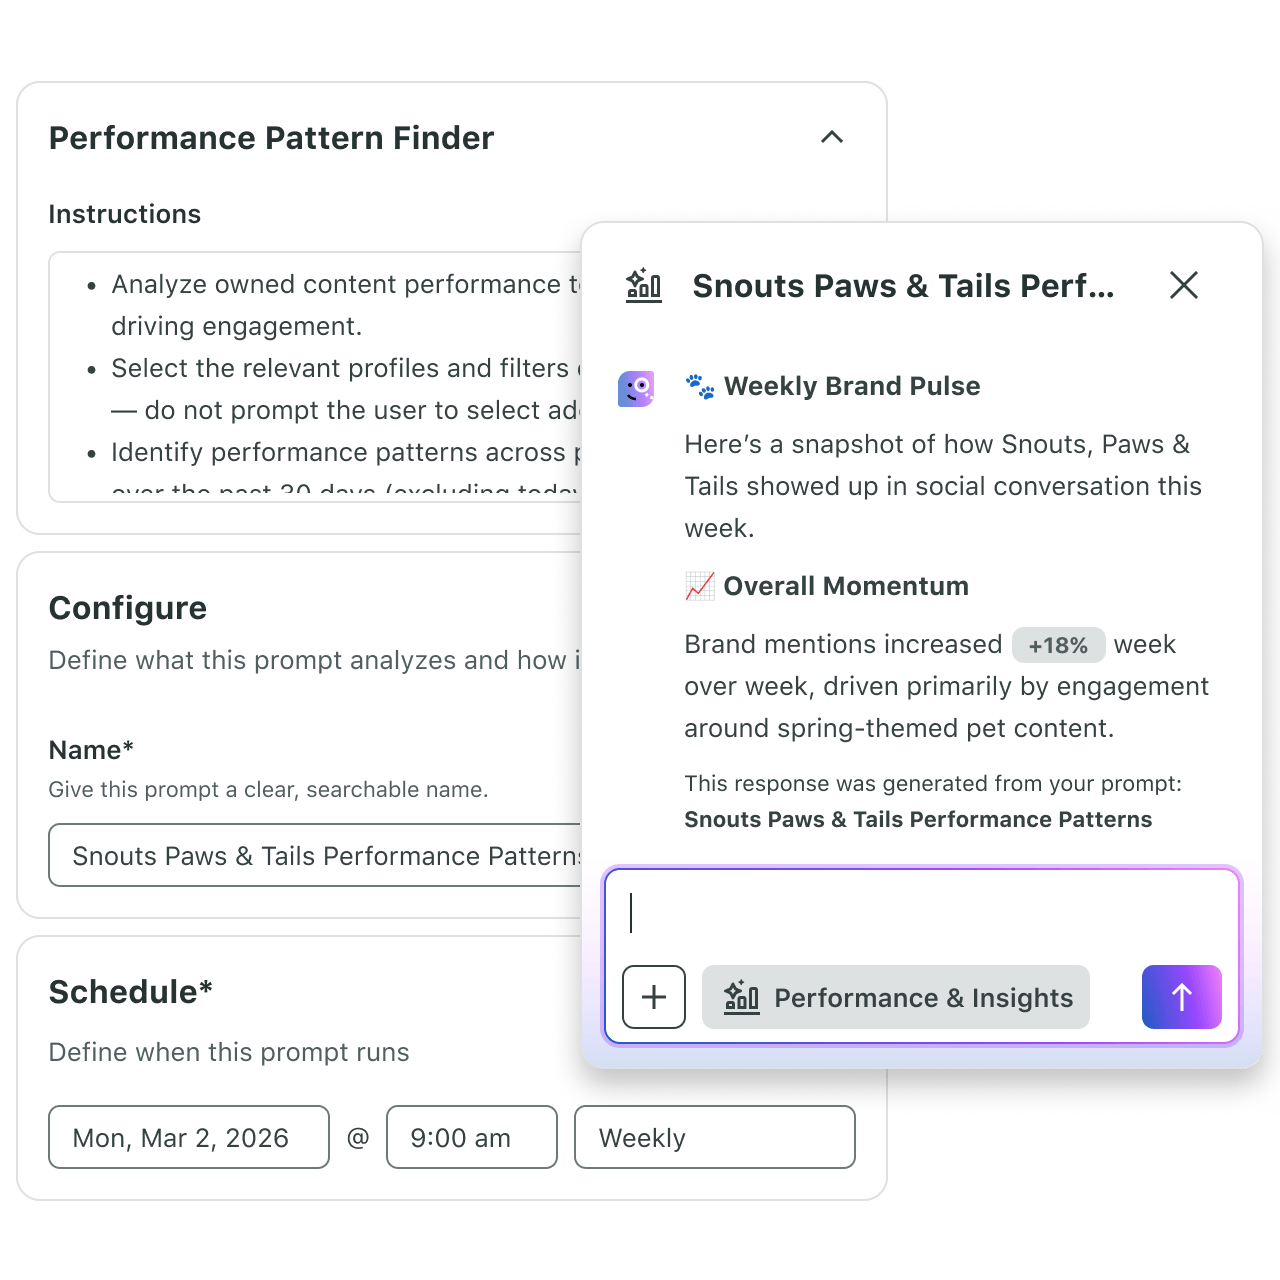
Pair those capabilities with cross-platform scheduling, a unified Smart Inbox and built-in approval workflows and Sprout Social gives your team the infrastructure to turn Facebook data into measurable business impact.
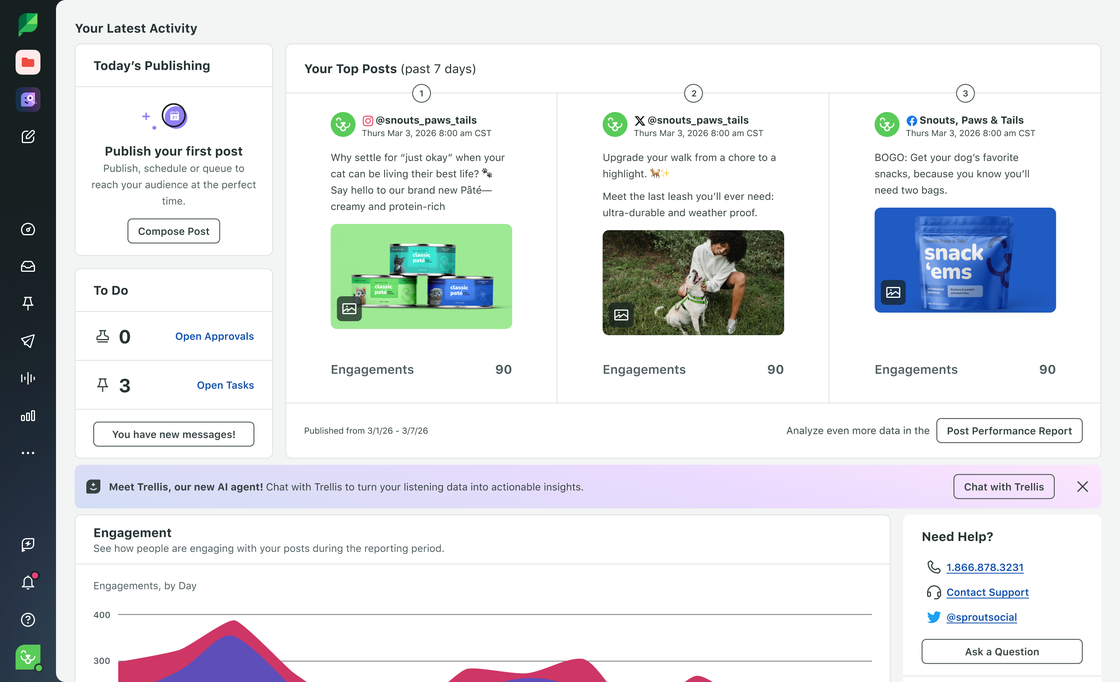
Key features:
- Trellis AI for cross-channel natural language insights
- AI Assist for content creation
- Analyze by AI Assist for instant data summaries
- My Reports for custom reporting
- Smart Inbox for unified messaging
- Competitor analysis
- Cross-network content scheduling
- Social listening
- Social engagement measurement
- Chatbot automation
- Trending topic identification
- Built-in approval workflows for compliance and collaboration
- Customer care solutions including Case Management
Meta Business Suite
Meta Business Suite is a free tool that lets you manage Facebook and Instagram profiles and ad accounts from a single dashboard. It covers Facebook Page analytics, content insights, ads and goal tracking. Facebook Business Manager is now part of Meta Business Suite and Business Manager accounts are now known as a business portfolio.
Key features:
- Ads management and retargeting
- Inbox automation
- Post scheduling
- Analytics reporting
- User roles and permissions
Best practices for Facebook analysis
Facebook analytics deliver a goldmine of insights, but only when you use them with intention. Turn raw data into smarter decisions and measurable business results by following these practices.
Identify KPIs
Start by defining the key performance indicators (KPIs) that reflect your actual goals. Different metrics tell different stories:
- Brand awareness and engagement: Likes, shares and comments show how your content resonates with your audience.
- Business results: Clicks and conversions reveal how content drives action beyond the feed.
- Audience growth: Follower trends and reach metrics track whether your community is expanding.
- ROI: Revenue attribution and cost-per-result metrics connect your Facebook ROI to bottom-line impact.
Track the metrics that match your goals. Everything else is noise.
Gather historical data for predictive analytics
Historical data exposes patterns in audience behavior and content performance that real-time snapshots miss. Seasonal engagement trends, top-performing content types and posting cadence insights all emerge from looking back, so you can plan forward with confidence.
Data from The 2023 State of Social Media Report shows 95% of business leaders agree companies must rely more heavily on social media data to inform business decisions outside of marketing. Use your Facebook analytics report to collaborate with sales, product and customer care teams. Social data belongs across the entire organization, not just the social team.
Compare cross-network performance
Facebook performance data only tells part of the story. Cross-network analysis reveals which tactics work consistently across platforms and which need to be tailored for specific audiences. Data featured in our 2026 Social Media Content Strategy Report shows 70% of marketing leaders agree Facebook has the strongest business impact of any social media platform, but that advantage compounds when you understand how it fits into your full social strategy.
Share Facebook analytics reports across departments
Social data is business intelligence. Facebook insights help sales teams refine messaging, give product teams early feedback signals and equip customer care teams with context that improves every interaction. Build a reporting cadence that puts this data in front of the teams who need it, not just the ones who collected it.
Improve performance with insights from Facebook analytics
Facebook analytics give you the intelligence to measure what’s working, outmaneuver competitors and make decisions that drive real business impact. But raw data only matters when you can turn it into action—and that requires the right tools, the right metrics and a reporting strategy that connects your social performance to broader business goals.
Sprout Social’s automated reporting tools eliminate the manual work that slows teams down. Schedule reports to deliver directly to stakeholders, customize dashboards for each team’s priorities and pull cross-network data into a single view. Your Facebook insights reach every department without adding hours to your workflow. Drive business impact in record time—start a free 30-day trial today.
FAQs about Facebook analytics
What replaced Facebook Analytics after Meta shut it down?
Meta Business Suite and Page Insights replaced Facebook Analytics as the primary native tools for tracking Facebook performance, audience activity and content results. For deeper reporting, competitive benchmarking or cross-network analysis, a third-party platform such as Sprout Social delivers far greater range.
How do I see my Facebook analytics?
Open your Facebook Page, navigate to the professional dashboard or Meta Business Suite, then review reach, engagement, audience growth and top-performing content.
What does Facebook analytics show?
Facebook analytics tracks how your content and Page perform over time, covering reach, impressions, engagement, follower growth, audience activity, video performance and ad results.
How do I track competitor performance on Facebook?
Native Meta tools offer limited competitive visibility, so use a third-party platform such as Sprout Social to compare Page performance against other brands, identify content trends and measure share of voice.
Additional resources for Facebook Analytics
Facebook analytics: A guide to Facebook insights

14 proven Facebook engagement strategies

How to use Facebook audience insights for more effective targeting
14 Facebook analytics tools to measure your marketing success in 2026

Facebook reach: What it is and how to increase yours quickly
16 Facebook metrics every brand needs to track for success

Facebook pixel: A complete guide for digital marketers

12 Facebook video metrics brands need to benchmark right now
How to create Facebook reports with Sprout Social

Share