YouTube analytics: How to analyze your YouTube data

Written by Brent Barnhart
Published on November 12, 2025
Reading time 9 minutes

Table of Contents
Building a strong YouTube channel starts with understanding your audience.
Do viewers love your videos? Is your channel growing? Where do your views come from?
These are all questions that directly impact your content and approach to YouTube marketing. And one of the best places to get answers to these questions is through social media analytics — specifically YouTube analytics.
YouTube’s native analytics provides heaps of data to uncover everything you need to know about your channel and content performance. But it’s overwhelming if you’re new to it.
Check out this comprehensive guide to navigate YouTube analytics and use it to your advantage.
What are YouTube analytics?
YouTube Analytics is the comprehensive data dashboard that tracks your channel’s performance across four essential pillars:
- Engagement (views, likes, shares),
- Audience (demographics and watch behavior),
- Traffic sources (search, suggested videos), and
- Revenue (ad earnings and monetization).
These insights are crucial for content creators and marketers to accurately understand audience behavior, optimize content strategy and measure the true business impact of their YouTube efforts.
Benefits of tracking YouTube analytics
You can’t grow your channel if you don’t know how your audience engages with your videos.
And so the benefits of having a pulse on your YouTube analytics can’t be overstated.
1. Spot audience performance trends
Creators should be wary of blanket advice regarding what’s “optimal” on YouTube.
If you want to know what your specific audience does or doesn’t want, look no further than your YouTube analytics data to uncover insights. For example, do your viewers tend to prefer 10+ minute videos or YouTube Shorts? Do you notice an uptick in subscriber engagement when you upload less?
Not to mention, comparing your own growth patterns against industry rivals through a thorough YouTube competitor analysis can help you determine if a dip in views is an industry trend or a specific content gap you need to address.
Test publishing cadence alongside quality signals—like impressions click-through rate and audience retention—to see if fewer, better videos outperform a higher volume for your audience.
YouTube analytics provides valuable information so you create content with more confidence.
2. Learn what content resonates with your YouTube audience
The YouTube algorithm might seem complex, but one factor is crystal clear: Your content format directly impacts your video engagement and dictates your ability to build an audience. To illustrate, analyze why a reaction video might earn more views than an in-depth explainer.
The advice to “create relevant content” only becomes actionable when you have video performance data to back it up. Be strategic with your content format and prioritize high-impact thumbnails and titles that drive higher click-through rates. Most importantly, craft content that genuinely holds your audience’s attention by creating a strong opening hook and maintaining momentum throughout the piece.
3. Assess how assets affect performance
Remember that your content is only one piece of your YouTube content strategy.
Consider how assets and publishing details also impact your channel’s performance:
- Thumbnails
- Captions
- Hashtags and keywords
- Channel branding
- External links
To understand how these elements impact your content, check your dashboard. For deeper insights, use our YouTube strategy template. It’s designed to support you in optimizing your YouTube content creation process and refining your strategy continuously.
How to find YouTube analytics
Let’s start with the basics: accessing your YouTube analytics. While YouTube itself offers native analytics, we’ll kick things off with Sprout Social. Not only does Sprout Social provide in-depth YouTube insights, but it also allows you to easily compare your YouTube performance with other social media platforms—a key benefit for understanding your overall social strategy.
How to access YouTube analytics in Sprout Social
Step 1: If you don’t already have a Sprout Social account, sign up for a free trial using your business email. You don’t even need a credit card.
Step 2: Once logged in, go to “Account and settings > Connect a Profile“. You also connect a profile by clicking + Connect a profile from Groups & Social Profiles in Settings.
Step 3: Select Group and Platform. Select the Group the profile belongs to from the “In Group” dropdown. Then click “Connect” on YouTube.
Step 4: Authorize your YouTube profile. Click “Go to YouTube” and follow the prompts to authorize your YouTube profile and connect it to Sprout Social.
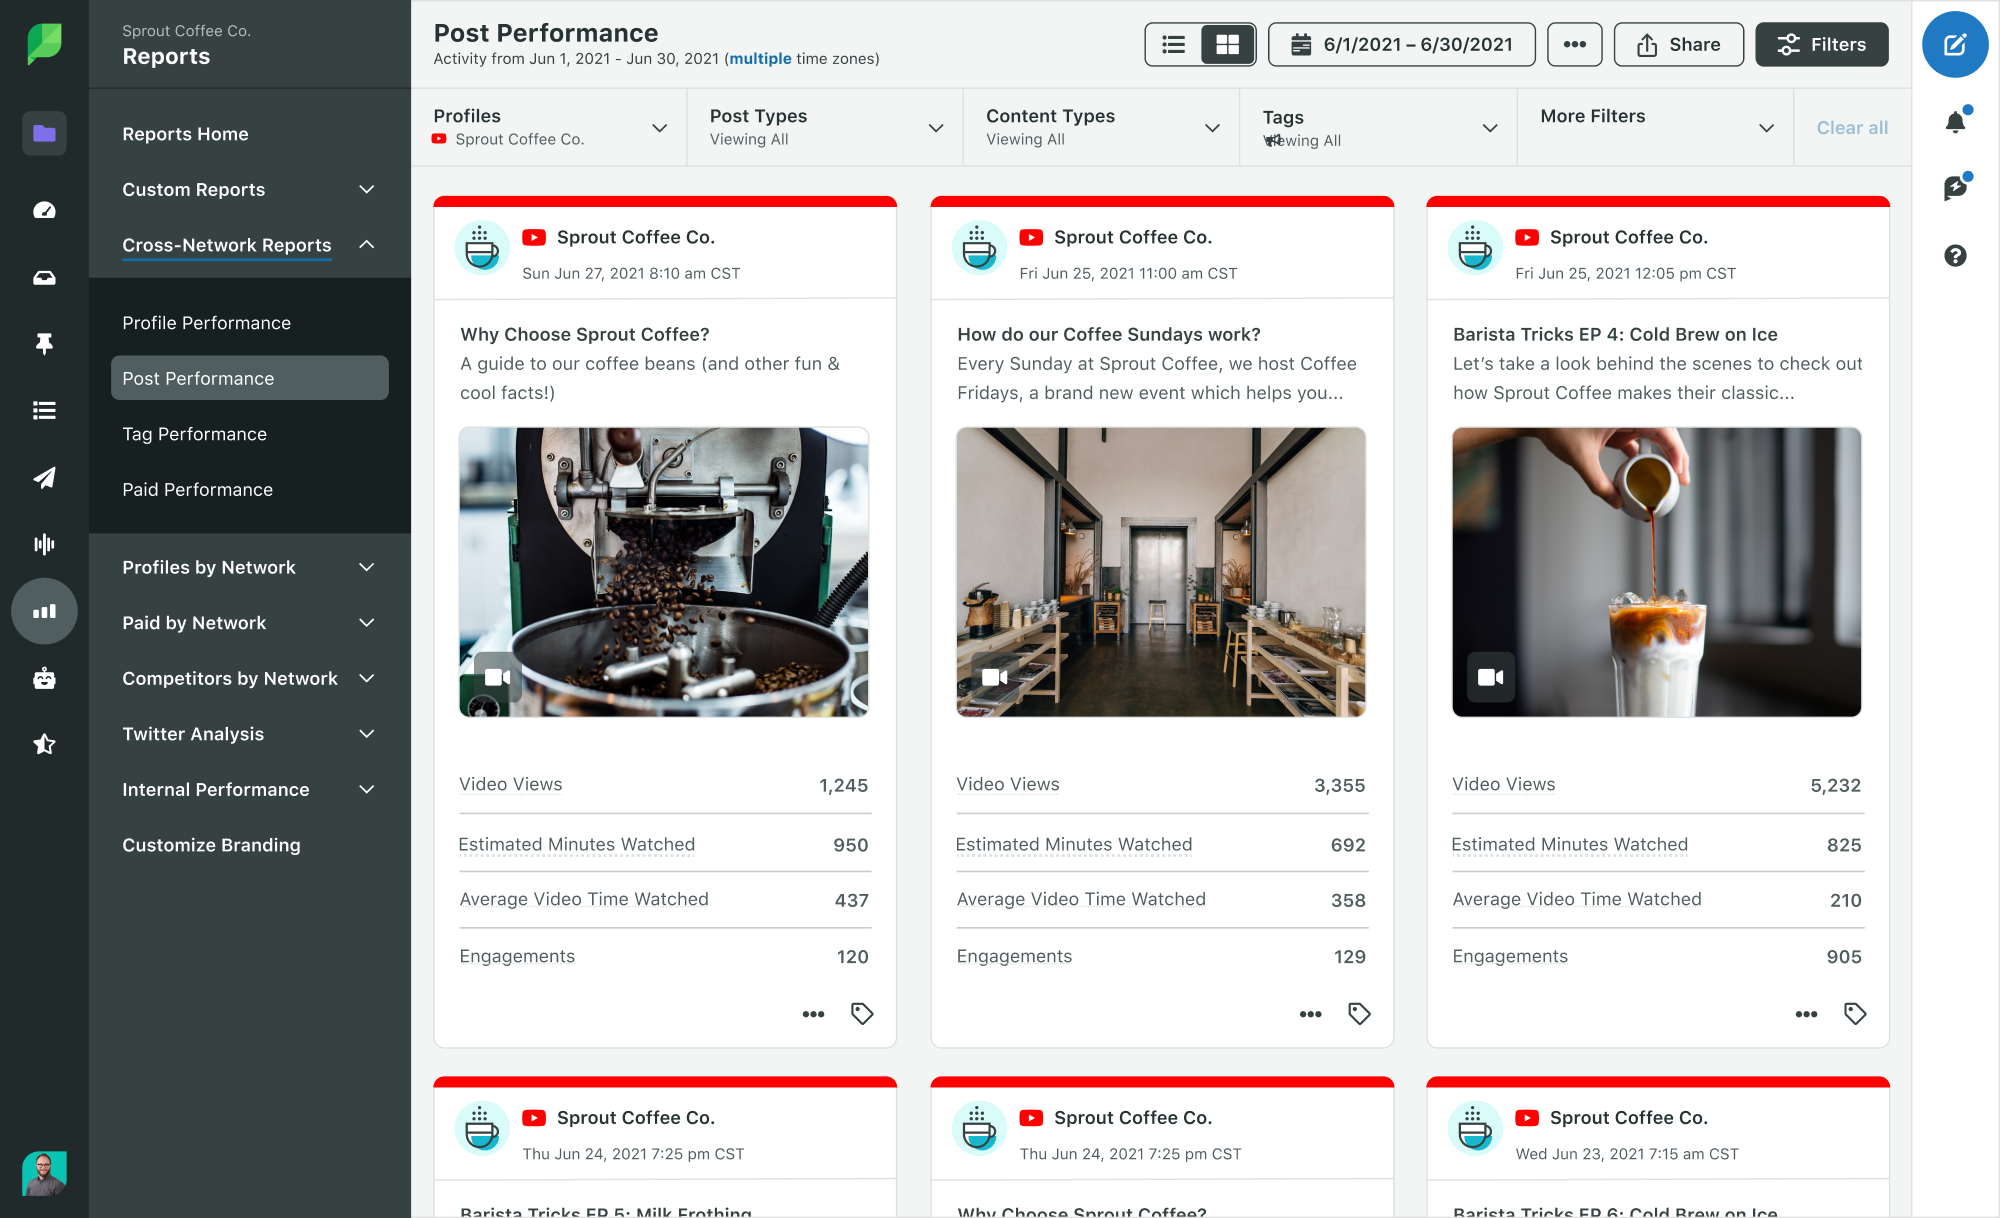
To access your YouTube Video Analytics Report in Sprout Social
Step 5: Navigate to the Reports tab.
Step 6: Click YouTube Videos under the YouTube Reports dropdown.
Understanding YouTube Video Analytics Data
The YouTube Videos report shows your YouTube videos’ immediate and long-term impact and success. Quickly review your top-performing videos or examine your YouTube performance data to uncover engagement metrics for each video. You can:
- Track progress over time
- Make adjustments to your strategy
- Measure the success of campaigns to track the ROI of YouTube marketing efforts
Unlocking Video Performance with Sprout Social
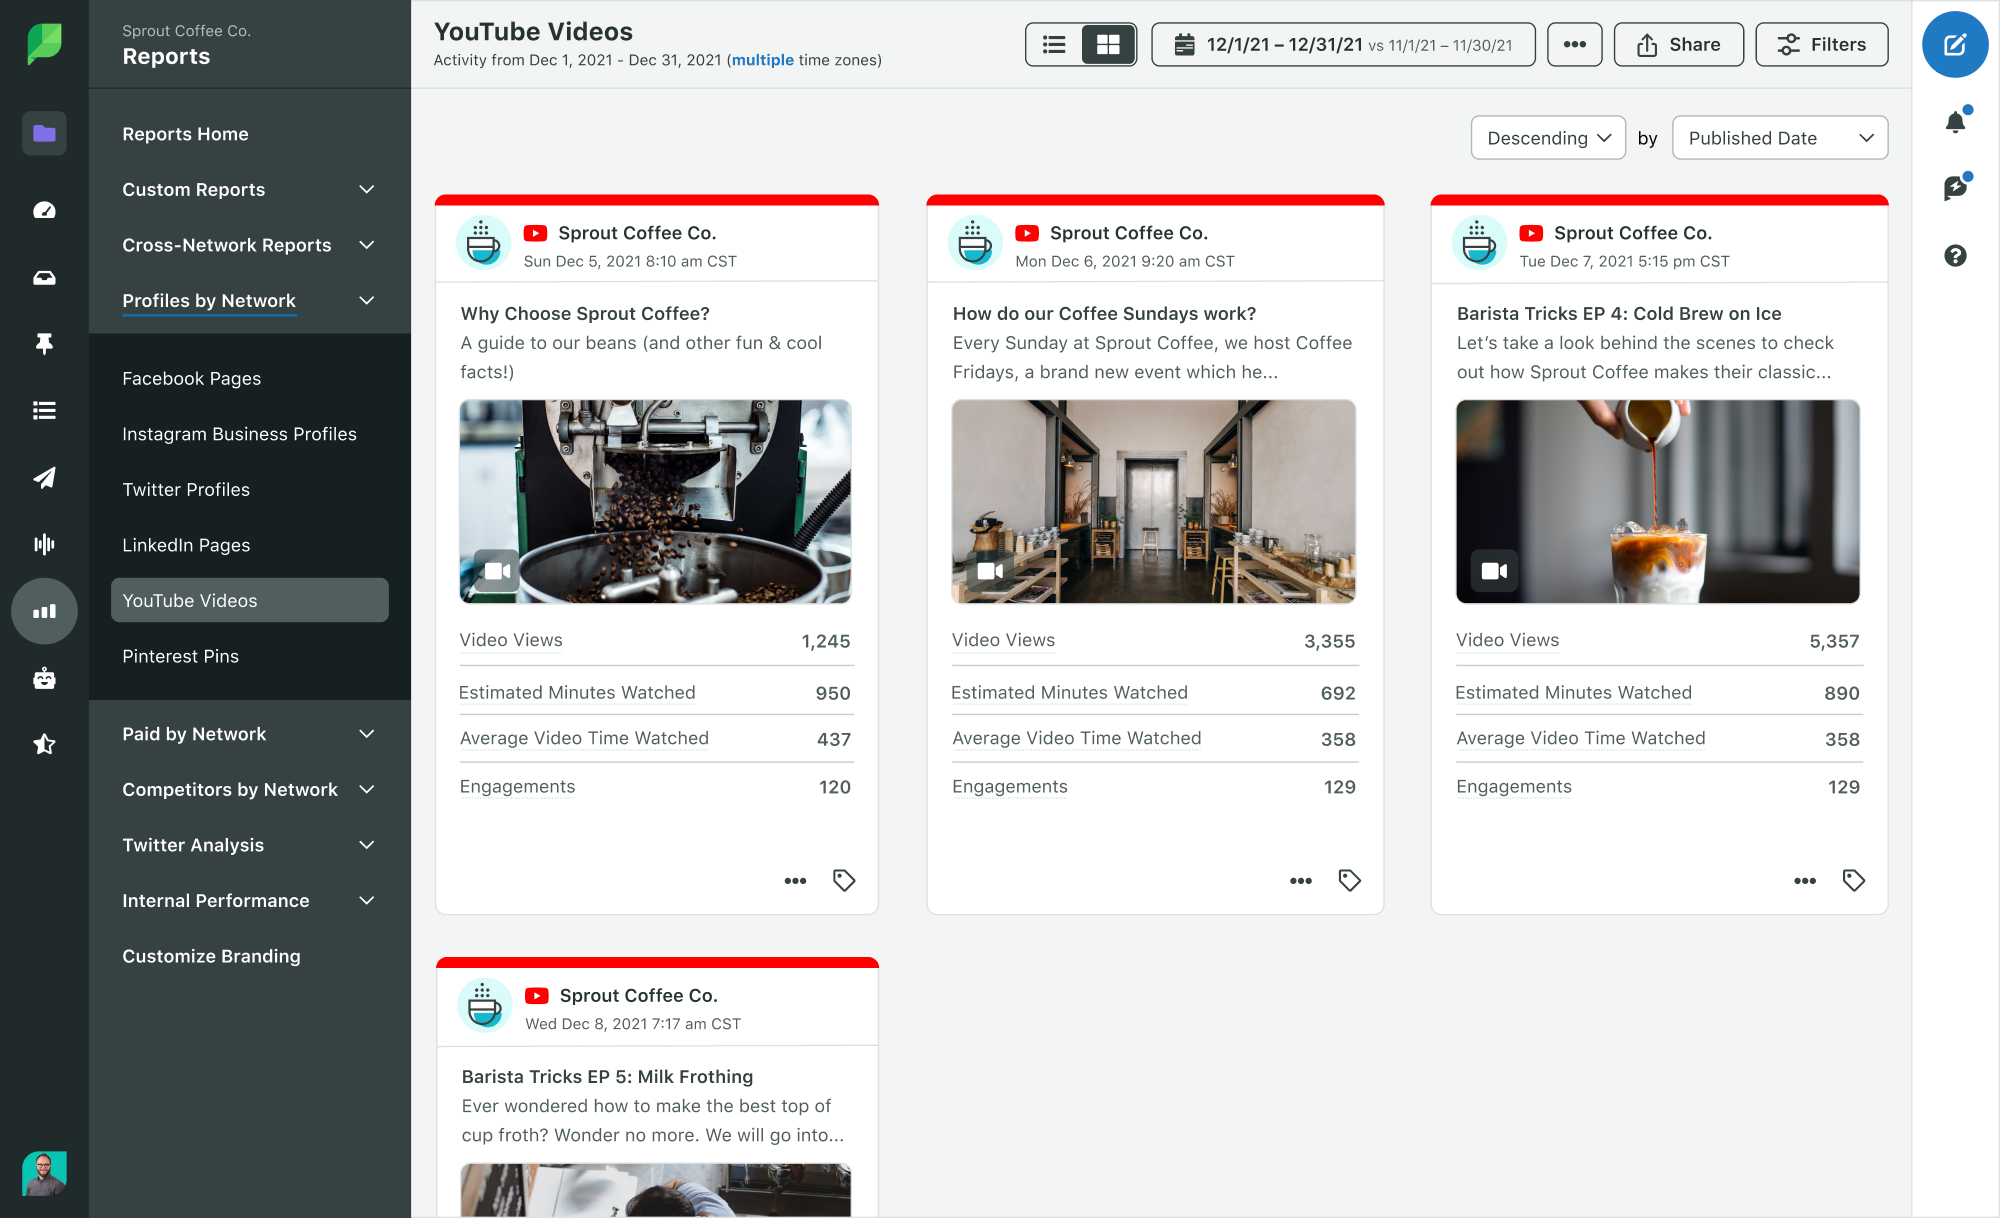
Video Views: The total number of views your video receives indicates reach and brand awareness. Maximize views by promoting across multiple channels and using relevant keywords.
Average View Duration: This metric goes beyond simple views to reveal how long viewers are watching your videos. A longer average view duration signals higher engagement and suggests your content is resonating.
Engagements: This metric tracks the total number of likes, comments and shares your video receives, providing valuable insight into audience interaction and interest. High engagement shows that viewers aren’t just passively consuming your content; they’re actively participating.
Published Date: Analyzing video performance in relation to its publish date reveals important trends. Experiment with different posting times and days to identify what works best for your audience.
Visibility Status: Understanding whether a video is public, private or unlisted is crucial for assessing its reach and targeting. Public videos are accessible to everyone, while private videos are restricted to specific viewers.
By carefully tracking and analyzing these data points, you gain a deeper understanding of your video performance, identify areas for improvement and develop a content strategy that drives meaningful results.
You also access YouTube analytics natively on a desktop or within the app.
How to access YouTube analytics on desktop
To access the YouTube analytics tool, log in directly from studio.youtube.com. You can also click on your profile icon from your YouTube account and select “YouTube Studio.”
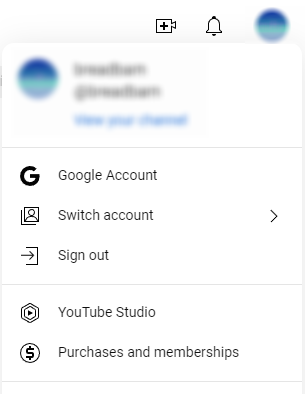
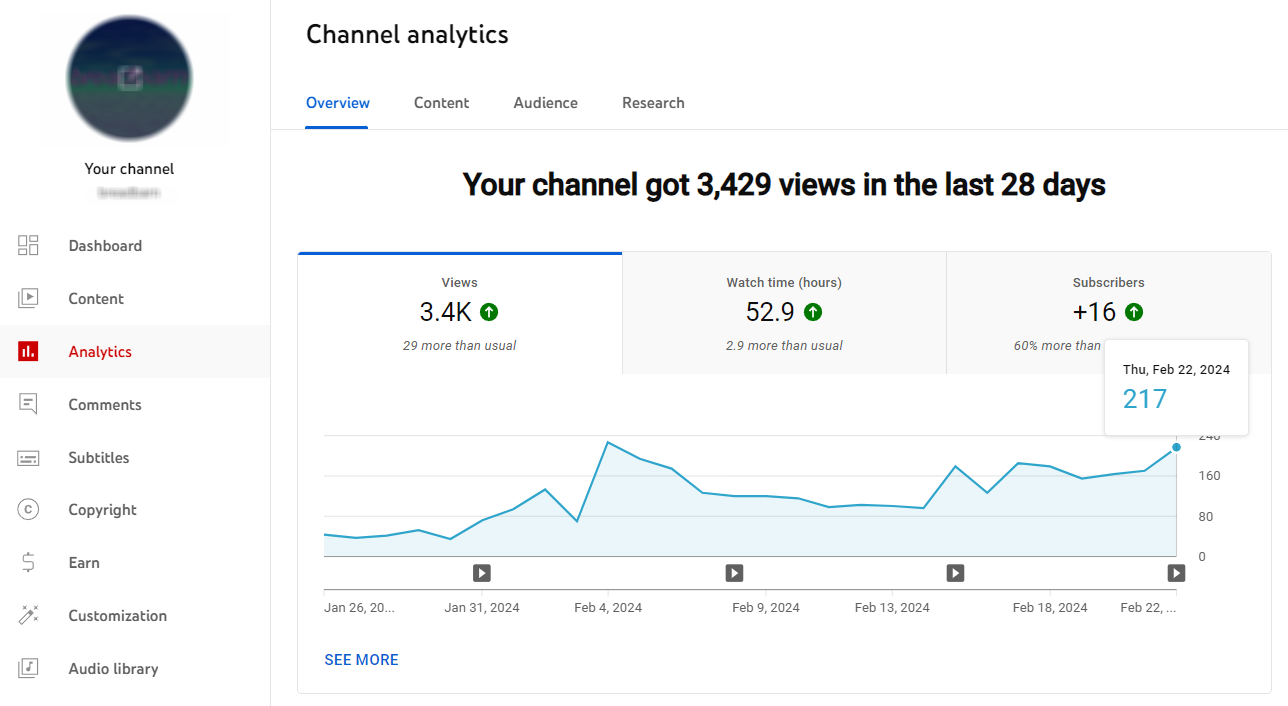
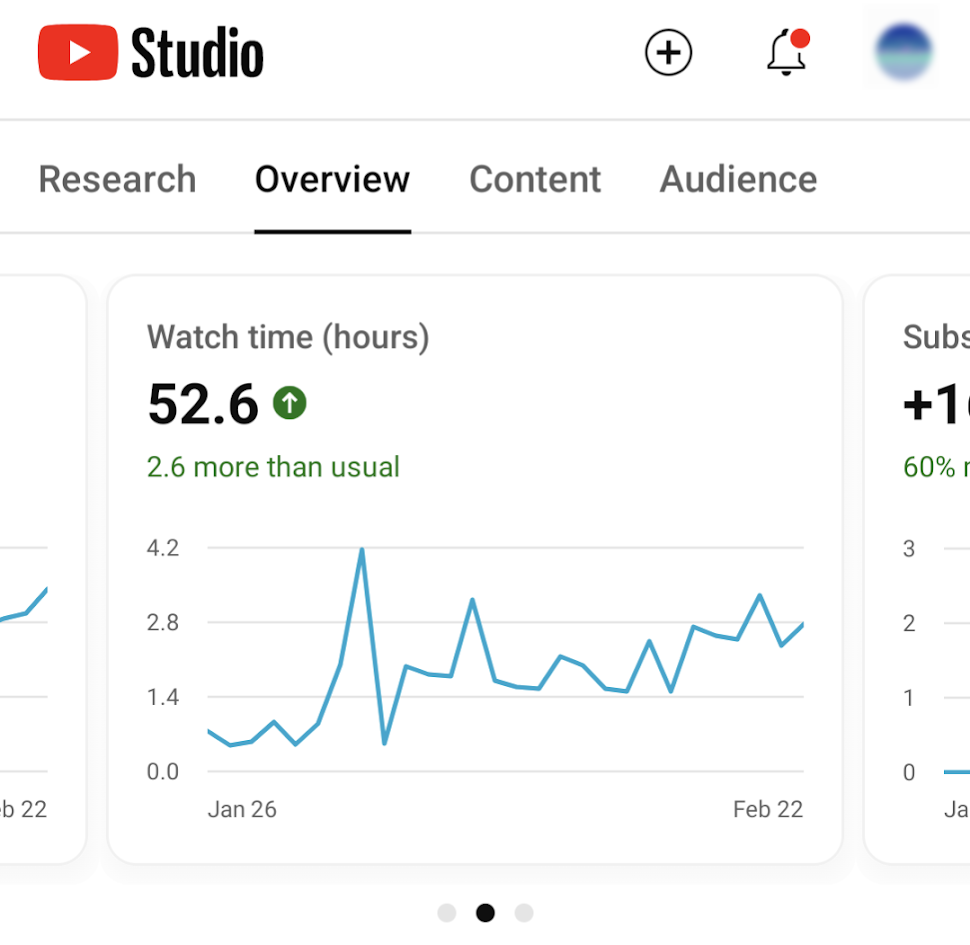
From your YouTube Studio interface, click on Analytics in the left-hand panel to start exploring your native YouTube dashboard.
Here you get an overview of your channel’s performance. Navigate further with the Content, Audience and Research tabs for more granular metrics, too.
How to access YouTube analytics on mobile
From the YouTube mobile app, select your profile picture and tap “Your Channel.” Then select the graph icon (next to “Manage videos”).
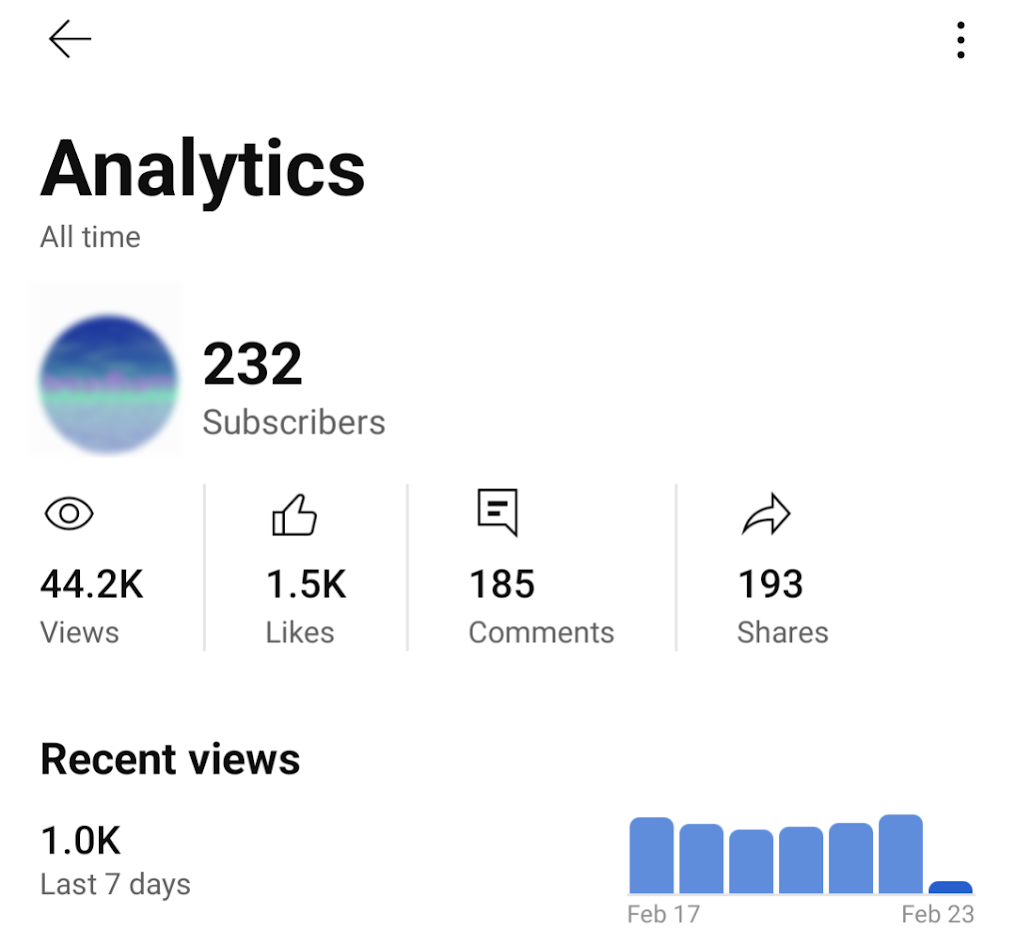
Alternatively, download the full YouTube Studio app which offers many of the same metric breakdowns as the desktop version. You can find a prompt to download the app at the bottom of your mobile YouTube analytics page.
YouTube analytics for business strategy
Data without direction is just noise. The power of YouTube analytics isn’t in collecting numbers. Instead, it’s in transforming those numbers into decisions that move your business forward.
Your analytics dashboard tells the story of what’s working and what’s not. Which content themes resonate most with your target audience?
What video formats keep viewers watching until the end? These insights don’t just inform your content calendar. They justify your budget, prove ROI to executives and reveal opportunities your competitors are missing.
YouTube channel analytics and metrics to track
In YouTube Studio, select the “Analytics” in the left-hand menu for your channel-wide data.
YouTube Studio provides comprehensive channel-wide analytics through two main categories:
| Metric Category | Specific Metrics | What It Measures |
|---|---|---|
| Content Performance | Channel views, Watch time, Impressions, Click-through rate, Average view duration, Key moments for audience retention | How your content performs and attracts viewers |
| Audience Growth | Subscribers gained, Realtime reports, Top content | Channel growth and most popular videos |
| Discovery & Traffic | How viewers find your videos, Traffic sources, Browse features, Playlists | How viewers discover and access your content |
| Demographics | Returning vs unique viewers, Geography, Age and gender | Who your audience is and where they’re located |
| Timing Insights | When viewers are active, Video growth patterns | Optimal posting times and content trends |
YouTube video analytics and metrics to track
In YouTube Studio, select “Content” in the left-hand menu to see a list of all your videos.
Then, tap the Analytics icon next to the thumbnail for a breakdown of metrics for a specific video.
Video-specific analytics fall into three core categories:
Engagement metrics
- Views: Total number of views your video received
- Watch time: Total hours people spent watching
- Average view duration: Average length of video playback
- Average percentage viewed: Average percentage watched during playback
- Subscribers: New subscribers gained from this video
- Impressions: How often your thumbnail appeared to viewers
- Impressions click-through rate: Percentage who clicked after seeing your thumbnail
- Likes (vs. dislikes): Ratio of “thumbs up” versus “thumbs down” ratings
- End screen element click rate: How often viewers clicked your end screen
Awareness metrics
- How viewers find this video: Traffic sources (suggested videos, search, playlists)
- Impressions and watch time: Visual representation of thumbnail to view conversion
- External sites or apps: Off-platform traffic sources like Reddit or Discord
- Bell notifications sent: Subscriber notification count for new videos
- YouTube search terms: Keywords viewers used to find your content
- Content suggesting this video: Impressions from video recommendations
- Playlists featuring this video: Number of playlists including your content
Audience insights
- Returning viewers: Viewers who previously watched your content
- Unique viewers: Individual viewers (excluding repeat views)
- Age and gender: Demographic breakdown of viewership
- Watch time from subscribers: Time subscribers spent on your videos
- Top geographies: Locations where videos are viewed most
- Top subtitle / CC languages: Most common subtitle languages
Cross-platform video analytics with social media tools
Cross-platform video analytics reveal which platforms drive the highest engagement rates, longest view times and most conversions. This data-driven approach supports you in allocating budget effectively and identifying your most valuable audience segments across TikTok, Instagram, Facebook and YouTube.
Key benefits of unified video analytics:
- Resource optimization: Focus time and budget on highest-performing platforms
- Audience insights: Understand where different demographics engage most
- Content strategy: Identify which video formats work best on each platform
- ROI measurement: Track business impact across your entire video strategy
Using a comprehensive social media management platform lets you compare video views, engagement rates and audience growth across all your social media platforms in a single dashboard. This cross-platform view reveals patterns you’d never spot by jumping between native analytics tools.
You’ll see which platforms drive top-of-funnel awareness versus deeper engagement. You’ll understand which video formats perform best on each platform.
According to Sprout Social’s 2025 Content Benchmarks Report, YouTube maintains a 1.08% engagement rate across industries. This makes it a powerful complement to platforms like Instagram (1.61%) and TikTok (1.75%). Understanding these performance benchmarks across platforms helps you set realistic goals and optimize your video strategy for maximum impact.
How to see YouTube analytics for other channels
Without using a third-party YouTube analytics or a competitive analysis tool, there’s limited data you gather on competitors or creators in your space.
Natively, you can see limited data for other channels under the “Audience” through in your main YouTube Analytics dashboard. Here you get a snapshot of the activity and content preferences of your viewers.
- Channels your audience watches
- What your audience watches
- Formats your viewers watch on YouTube (videos, Shorts and Live)
Note that this data is incomplete until you have a larger viewership to populate each field.
YouTube analytics tools to level up your strategy
Video marketers are spoiled for choice when it comes to YouTube analytics tools.
Although YouTube’s native data is pretty robust, third-party tools fill in the gaps and uncover new opportunities to grow your YouTube channel. Many of these opportunities can stem from your social marketing efforts.
Sprout Social
Sprout Social offers powerful tools to analyze your YouTube performance. The platform lets you easily visualize your content performance across channels to see exactly where you stand.
You can also gain video-specific insights to understand how to improve your publishing and engagement efforts.
Google Analytics
Google Analytics can give you a more detailed look into your channel performance as it pertains to your website. You’ll be able to track how people are converting on your website from YouTube via referral/UTM parameters.
You can also track the traffic coming from your YouTube videos to your website.
Team collaboration for YouTube analytics
Team-based YouTube analytics workflows increase productivity by eliminating siloed data access. Shared dashboards support real-time collaboration across content creation, community management and strategy teams.
Collaborative analytics features that drive results:
- Shared reports: Everyone accesses the same performance data
- Task assignment: Assign actions based on specific video performance
- Real-time notifications: Alert teams to engagement spikes or issues
- Custom permissions: Control who sees what data across your organization
When your entire team accesses the same insights in real-time, you move faster. Creative teams understand which content themes to prioritize.
Community managers spot conversation trends worth engaging. Executives see the business impact without needing a deep dive into the data.
Grow your channel with YouTube analytics
We get it: there’s a lot to take in!
But YouTube analytics inform your strategy and amplify your marketing efforts. Consider using a tool like Sprout Social to help you step up your YouTube marketing.
From cross-publishing and asset management and beyond, our platform allows you to seamlessly combine your YouTube presence with your social campaigns. And if you haven’t already, you can take the first step by checking out our YouTube strategy template!
YouTube analytics FAQs
How do you find YouTube analytics?
You can access your YouTube analytics via YouTube Studio on desktop or mobile. If you click on the profile picture for your channel, you’ll see a tab for Studio in the dropdown menu.
How do I turn on YouTube analytics?
YouTube analytics are activated on your account by default. However, some metrics and fields won’t populate fully until your channel hits a certain viewership threshold. In other words, your account needs enough activity to provide consistent data to channel owners.
How often should I review my YouTube analytics?
Review your YouTube analytics weekly for active channels to spot trends without chasing daily fluctuations. Check daily only during major campaign launches or new content testing.
What's a good engagement rate on YouTube?
According to Sprout Social’s 2025 Content Benchmarks Report, YouTube maintains an average engagement rate of 1.08% across industries. Focus on improving your own historical average rather than chasing universal numbers.
Can I share YouTube analytics access with my team?
Yes. Within YouTube Studio, you grant different permission levels to team members based on their roles.
How do I export YouTube analytics data for executive reports?
YouTube Studio allows you to download basic reports as CSV files. For presentation-ready reports, consider using a platform like Sprout Social that automatically generates visual reports you can share with stakeholders.
What's the difference between YouTube analytics and Google Analytics for YouTube?
YouTube analytics tracks video performance on the platform itself, while Google Analytics measures website conversions from YouTube traffic. Use both together for comprehensive ROI measurement.

Share