YouTube metrics that drive growth and business impact

Table of Contents
With over 2.7 billion users, YouTube isn’t just a video platform—it’s a hub for engaging with audiences and building community.
Whether you’re scaling your channel or improving your views and engagement, YouTube analytics helps you understand what works, where to optimize and how to tie your efforts to measurable outcomes.
We’ll break down the top YouTube metrics you should know about, how to build smarter strategies and how to tie your campaigns to ROI reporting.
Why YouTube data matters for your content strategy
YouTube data transforms guesswork into growth strategy. According to the Social Media Content Strategy Report, consumers are now slightly more likely to interact with short-form video (52%) than long-form (48%), which marks a shift from previous years that’s crucial to understand when building out your content strategy.
YouTube analytics eliminate the guesswork from your video strategy. Every view, click and comment tells a story about what drives your audience to action.
Smart marketers use this data to:
- Make YouTube content decisions: The data tells you what your target audience likes. Knowing if you have high video views, watch time and engagement for a certain video tells you what’s working and where there are opportunities to expand.
- Prove ROI: You need to connect your videos to business outcomes and analytics help you do that. For example, any conversions or spikes in product page traffic can connect back to your video and show that it’s made a difference for your brand.
- Review video performance and adapt: YouTube analytics supports you in creating a tight feedback loop. If you want to improve watch time, for instance, start by analyzing the titles and thumbnails for your high-performing videos. What do they have that the other videos don’t? Or, look at the hooks of your top-performing videos. Are there types of hooks that pull viewers in to watch longer than others?
YouTube analytics support you in doubling down on what’s working and strategically pivoting when necessary.
How to access YouTube analytics
YouTube offers robust internal analytics that allow you to analyze your videos and engagement in real-time. Here’s how to access it:
- Sign in to YouTube and click on your profile icon. Choose YouTube Studio from the menu.

- On the left sidebar, click Analytics. From there, you’ll see your dashboard.

-
- Explore data in the Overview, Content, Revenue and Audience sections.

Understanding YouTube’s metrics and counting rules
YouTube’s metrics work differently than you might expect. Understanding how views and engagement are counted supports you in interpreting your data and making confident strategic decisions.
What is a YouTube view?
A YouTube view is counted when a viewer actively chooses to initiate and watch your content on the platform.
YouTube states that views and other engagement metrics are only counted when they reflect genuine human interaction. The platform’s systems verify that these metrics come from real users who intentionally engage with content—ensuring that views are not the result of automated programs, spam or accidental activity.
While YouTube doesn’t publicly disclose an exact time threshold, a view generally confirms the consumption of your content was meaningful and deliberate.
How are YouTube Short views different?
YouTube Short views are counted differently because of how people consume short-form, vertical videos.
Here is the key distinction: A view registers the moment a viewer starts watching. There is no minimum watch time threshold, unlike the often-discussed (but unconfirmed) 30-second metric for long-form video.
This means even a fraction of a second of attention counts, provided the engagement is authentic as YouTube actively filters out automated or rapid-fire, non-genuine views.
Engagement metrics that spotlight what’s working
Video engagement is complex, which is why you need multiple metrics to see what’s resonating. Here are some metrics you can start with:
Views
A view is the metric for the number of times users watch your video.

Increase views by:
- Studying your most-watched videos: Identify commonalities in the headlines, topics, video descriptions and thumbnails (the details that capture audience attention and drive engagement).
- Collaborating with YouTube influencers or brands: They introduce you to the right viewers and increase your channel’s exposure.
- Learning from trending videos and themes: Find relevant opportunities to join in on trending topics or challenges to increase reach and engagement.
As of March 2025, YouTube counts Shorts views differently, measuring a view every time a Short plays or replays—with no minimum watch time required. The older metric, now called Engaged Views, required a minimum video watch time. A best practice is to improve your hooks and promise value as fast as possible to keep viewers engaged and encourage rewatches.
Watch time
This metric measures the total hours your viewers spend watching your content. Retention, watch time and other valid engagement signals help YouTube’s algorithm understand what to recommend.
Ways to increase watch time include the following:
- Posting videos consistently: Release videos on a regular schedule that sets audience expectations, builds viewer loyalty and encourages repeat visits.
- Increasing retention within videos: Produce intros that immediately hook viewers. Add pattern interruptions early with quick cuts, text overlays and engaging visuals to encourage higher watch times.
- Recommending videos: Feature follow-up content or use an End Screen to nudge users to view more.
Average view duration
Average duration reveals how long viewers stay and watch a video, supporting how you measure YouTube engagement and retention.
Along with the techniques mentioned for increasing watch time, apply these tactics:
- Changing visual components to grab attention: Change camera angles and add graphics, images, headers and other elements to shift patterns and keep viewers interested.
- Adding a cliffhanger: Promise value in your intros so users will want to finish or watch a video longer.
- Hosting YouTube livestreams: Viewers enjoy live videos. Host livestreams to engage your audience in real-time, building community and generating longer watch times from live participation and views after the event.

Front-loading value drives retention. Deliver your most compelling content within the first 15 seconds to hook viewers.
Shorts extend up to three minutes but operate differently than traditional videos. Track swipe-away rates to identify when viewers lose interest and optimize your content.
Audience retention
This metric tells you when you tend to lose viewers during the video. For example, was there a dip early on? That’s a sign to improve your intro or revisit topic relevance. Or was there a healthy, consistent curve? That’s a sign you’re engaging with your audience.
Audience retention is a great metric for studying viewer behavior throughout your video. Improve your channel performance by:
- Noting key moments: Pinpoint the moment viewers leave or stay engaged. Then, compare these retention trends across all your videos for commonalities and insights.
- Structuring new content based on retention curves: Apply the successful retention patterns you’ve analyzed to support the creation of future videos based on what’s working.
Retention looks different for Shorts. YouTube designed the format for quick views, encouraging users to watch many short videos in a short amount of time. While keeping retention high is challenging, even minor improvements make a big difference in your Shorts’ performance. As you master retention in this competitive format, you can apply those techniques to your longer-form videos.
YouTube metrics that reveal your audience
Knowing who you’re reaching is the difference between a successful YouTube social media strategy and one that doesn’t get much traction. Follow these key metrics to find your viewers:
Demographics
YouTube demographics include details like age, gender, location and the devices your audience uses.
Impressions and CTR
Impressions refer to how often users see your video thumbnail in their feed or app, and click-through rate (CTR) is the percentage of users who click on the video. If you have a low CTR, your topic choice, title or thumbnail needs improvement.
Sprout Social’s Profile Performance Report consolidates YouTube engagements and growth metrics alongside your other social media platforms. This cross-platform view reveals how your YouTube strategy impacts your broader social media performance, making it easier to prove ROI to stakeholders.

Subscriber gains (and losses)
The subscriber metric shows how many subscribers you’ve gained or lost—all based on video content. If your subscriber count increases, it’s a sign that your videos resonate with viewers. This insight supports your decisions on what kind of content to publish in the future.
Unique viewers
This metric tells you how many people are watching your videos. A high unique-to-view ratio means you’ve got substantial reach. A lower measurement indicates repeat views from loyal viewers.
Returning viewers
The returning viewer metric measures how many users returned to your YouTube channel. That’s a sign you’re building brand affinity, and a signal that your content is hitting home. You’re doing something right if this metric is growing.
Subscriber watch time
This metric shows you how long subscribers watched your videos. By comparing it with watch time from non-subscribers, you’ll uncover new insights, such as:
- More time from non-subscribers means you’re expanding your reach.
- More time from subscribers means you’re converting new accounts.

The good news for you is that you’re working in a favorable environment. YouTube has one of the largest shares of time spent on a video-sharing website. In 2024, analysts predicted US viewers would spend an average of 48.7 minutes daily on the site.
YouTube metrics that show viewer interest
Once you know who’s watching your videos, you’ll dig deeper by studying user behavior. Use these metrics to learn more about your viewers’ interests:
Likes, dislikes, comments and shares
These actions show how your content resonates with users. Comments and shares indicate depth of engagement, while other interactions, such as likes and dislikes, suggest initial interest.
Engagement rate
YouTube calculates engagement rates based on your likes, comments and shares. This useful metric supports you in gauging how your video engages your YouTube audience.
Key moments for retention
YouTube also provides insights based on video spikes, replays and dips in your retention graph. This data helps you discover what’s working and what’s costing you viewers.
But it’s important to note that metrics vary depending on the format.
YouTube Shorts achieve high retention and replays, while a traditional YouTube video won’t reach the same high metrics but still produces deeper engagement and longer watch time.
YouTube metrics for tracking traffic sources
Traffic sources reveal where your views come from so you’ll refine your social media marketing strategy to produce conversions on your website. YouTube’s native analytics include metrics such as impressions, views and average view duration in the data view connected with your traffic sources. Here are some YouTube metrics to look out for:
Traffic source types
Here’s how viewers find your content:
- YouTube search: If many viewers are finding your videos through search, it suggests an effective keyword strategy for video titles and subjects.
- Suggested videos: These videos appear to users who watch similar videos in your space. This signals you’re gaining traction with YouTube’s algorithm.
- Browse features: This shows your visibility on the homepage and subscription feeds.
- External sources: Common examples include embeds on your website, Google or Bing searches or links from other social media platforms. This is where keywords and SEO come into play.
CTR by source
For this specific YouTube key performance indicator (KPI), analyze your CTR by each source to improve future videos.
For example, compare how thumbnails and titles perform across different contexts, such as YouTube search, suggested videos and other traffic sources.
Optimizing different content types with analytics
Not all videos are created equal, and your strategy for a long form deep dive differs from a YouTube Short.
- Long-form videos: Prioritize watch time and audience retention. These metrics show you’re holding attention over a longer period, which is a powerful signal to YouTube’s algorithm.
- YouTube Shorts: Focus on views and viewed vs. swiped away. The goal is to stop the scroll. High view counts and a low swipe-away rate mean your hook is effective.
- Live streams: Track peak concurrent viewers and average watch time. This data reveals your ability to build and sustain a live, engaged audience.
How to use YouTube data across platforms
Integrating insights from multiple YouTube metrics empowers your social media team to craft a more effective strategy across all your social media accounts. Here’s how:
Spot high-performing content
As you test videos, you’ll discover some clear winners.
For your long-term strategy, analyze successful videos to identify commonalities—such as themes, thumbnails, production styles and more—and pinpoint what’s working on your audience.
These insights inspire new content for your other social media accounts. For example, if a concept works well on YouTube, remix it into Instagram-native posts incorporating those themes. If a long-form video performs strongly, have your social content team repurpose it into multiple short clips for Shorts.
Strengthen your other social accounts
Cross-posting supports you in reaching a wider audience by increasing the visibility of your videos. Share videos across your social media platforms and make them feel native to each space. For example, you can repurpose your top-performing videos into LinkedIn clips or TikTok videos.
These steps accelerate your YouTube channel’s growth by expanding discovery across platforms. Execute these tactics:
- Include social handles in your YouTube video descriptions to direct viewers to your other social media platforms.
- Use YouTube transcripts to pull captions and quotes for social posts on platforms like X (formerly Twitter) or LinkedIn.
- Automate clips with tools like Descript.
- Start small and focus on just two social media platforms to learn from your strategy.
- Add a CTA for your original YouTube video, allowing viewers to dive deeper into the subject.
Align with business goals and objectives
Data offers immense value for any social media professional. By using data to learn and refine your strategies, you’ll tap into its full potential, which is crucial for effective social media management and reporting.
To communicate ROI and value to your stakeholders, you need to leverage your YouTube analytics. Your metrics should support you to:
- Show brand awareness with impressions and unique viewers.
- Demonstrate engagement with returning viewers and user comments.
- Prove ROI with increased watch time on product videos and visits to tracked links or pages.
These kinds of analytic reports win over leadership and provide clarity to your YouTube strategy.
Managing YouTube analytics alongside other social platforms creates data silos that hide your true social media impact. The solution lies in unified analytics that connect YouTube performance to your broader marketing goals.
Take your YouTube marketing strategy further with Sprout Social
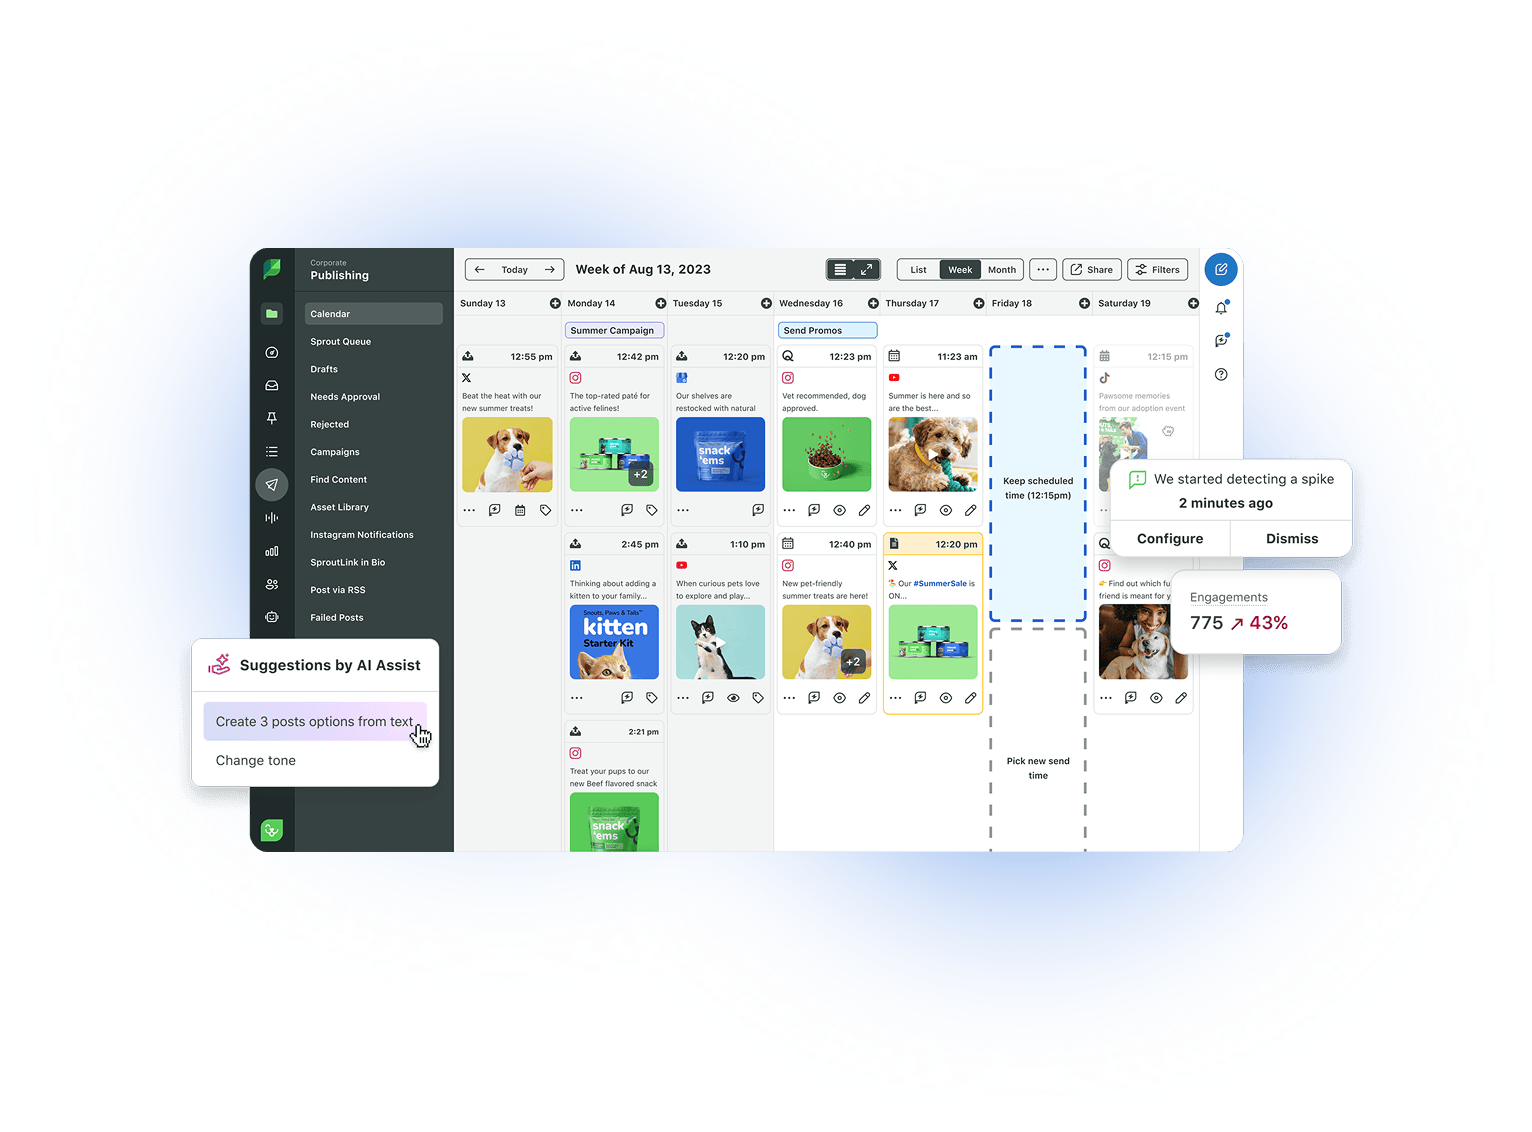
With Sprout Social, you’ll consolidate your entire social media strategy, supporting you to publish more effective social media content across platforms. Our all-in-one platform integrates with YouTube and your other social media accounts, delivering essential capabilities such as a unified dashboard for all your social media metrics, automated reporting to tie business goals to ROI and real-time engagement tools.
Start your free trial today to learn how to measure, manage and drive stronger results with your YouTube strategy.
YouTube analytics FAQs
What is the 30-second rule on YouTube?
The “30-second rule” is when a viewer watches more than 30 seconds of a YouTube ad video, it is treated by YouTube as a meaningful view. YouTube hasn’t disclosed an exact time threshold for organic views, only that views must come from real, intentional watchers.
Does rewatching a video on YouTube count as a view?
Yes, every rewatch counts as a new view, making high replay numbers a strong indicator that your content delivers lasting value to your audience.
How often should I check my YouTube analytics?
Check weekly for overall trends and channel health, but monitor daily for the first few days after publishing new content to catch early performance patterns and optimization opportunities.
Can I track YouTube analytics alongside other social platforms?
Advanced social media management platforms like Sprout Social integrate YouTube analytics with other social media platforms, providing unified reporting that shows how your video strategy impacts overall social performance.
What's the difference between views and impressions on YouTube?
Impressions count how many times your thumbnail appears to users, while views count video watches your video on YouTube and meets YouTube’s legitimacy criteria, making views a stronger indicator of content engagement.


Share