Instagram Analytics Tools
Top 14 Instagram analytics tools for growth in 2026
Unlock the full potential of your Instagram strategy with this in-depth guide to analytics. Learn how to better understand your audience, track the metrics that matter, and turn insights into action with tools like Sprout Social.
Reading time 11 minutes
Published on December 18, 2025
Table of Contents
Summary
- Instagram analytics encompasses a range of data points including reach, impressions, engagement rate, content interactions and audience demographics. These metrics help formulate effective marketing strategies and understand audience preferences.
- Benefits of using Instagram analytics include informing content creation, monitoring competitors, identifying performance trends and identifying audience demographics and behaviors.
- Access Instagram analytics natively or through Sprout Social for business and creator accounts to get track content performance, audience growth and engagement metrics.
Instagram is a powerful social media platform for marketers. But algorithm shifts, limited data windows and an overload of metrics make it tricky to get a clear picture of how your Instagram strategy is performing.
There are several Instagram analytics apps you can use in tandem with the best social media analytics tools to gain clarity and control of your Instagram performance and master your key marketing metrics.
Whether you are focused on Stories, user-generated content (UGC), or influencer campaigns, this combination of free and paid Instagram reporting tools can help you optimize your Instagram marketing strategy for 2026.
What are Instagram analytics?
Instagram analytics is a collection of data and performance metrics for your posts and account. Think key metrics, such as the number of Likes, comments, shares and impressions a post gets.
Analytics reveal your growth, audience behavior and most popular posts. Harness that data to improve your social presence and tie results to real business goals.
How Instagram analytics make your strategies smarter
Instagram analytics reports give you a competitive edge, so you aren’t guessing what resonates with your followers and target audience. Instead, you use the data to understand Instagram engagement trends, Likes and discover what works.
Here are other ways you can turn data into actionable insights:
- Spot market and user trends: Analytics reveal insights like the best time to post on Instagram, top-performing formats and audience behavior trends. These metrics support you in making data-driven decisions that improve campaign performance and return on investment (ROI).
- Learn more about audience nuances: Gain a deeper understanding of your audience by analyzing metrics like sentiment, story completion rate and save rate. Combining these metrics with A/B testing supports your experiments to see what works better. Your findings will guide your creative direction and content calendar planning.
- Curate and personalize your content: By segmenting audiences with data that shows their interests and values, you can build high-impact campaigns that speak to specific target audiences, improving responses and engagement within each group.
- Catch trends: Use Instagram
‘‘s data and AI-powered analytics platforms like Sprout Social to identify shifts in conversations, hashtag usage and styles. This helps you adapt to trends, supporting your brand’s cultural relevance. - Study competitors: Instagram analytics enables you to benchmark your performance by analyzing competitors’ public Instagram data on engagement tactics, follower growth, etc. Use these insights to identify gaps in their strategy or model projects based on successful themes.
- Combine data for holistic social insights: You are managing different social media accounts and tons of information. Breaking silos and getting all your information in one place is critical for making the best decisions. Use platforms like Sprout Social to combine data for a centralized view of the customer journey to inform your cross-channel strategy and messaging.
Top 14 Instagram analytics tools
There’s no shortage of Instagram analytics tools available. Here’s a list of the most popular social media analytics software for marketers:
1. Sprout Social
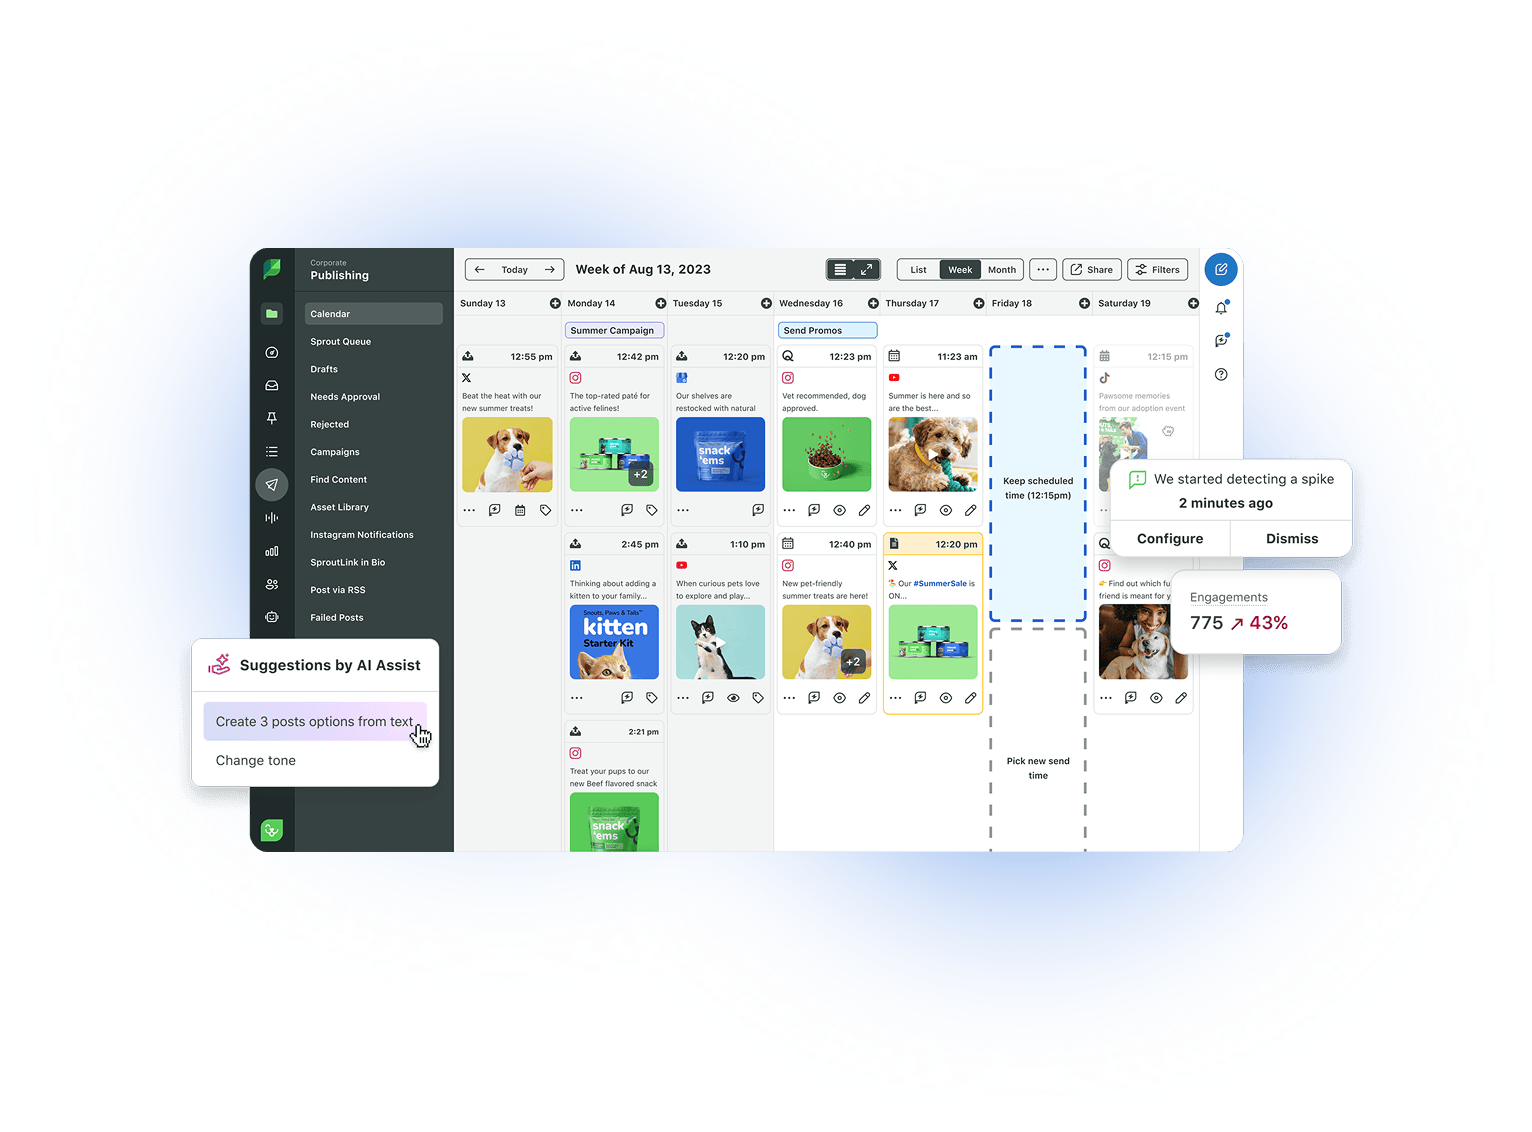
Whether you’re examining hashtag trends to inform future content or evaluating team performance to optimize operations, you can do it at scale with Sprout Social by measuring everything from follower growth to engagement across different products, brands or locations simultaneously.

Instagram Competitor Reports offer a way to benchmark your performance against your rivals. This tool lets you track key Instagram metrics, such as follower growth, engagement and posting frequency, for any public Instagram Business Profile. These insights help you see how you compare to the average performance of your competitors and show you areas for improvement to surpass them.
If you partner with Instagram influencers, you can manage the entire relationship through Sprout Social’s Influencer Marketing solution. Find and vet influencers, manage campaigns and get ROI reports all in the same place.
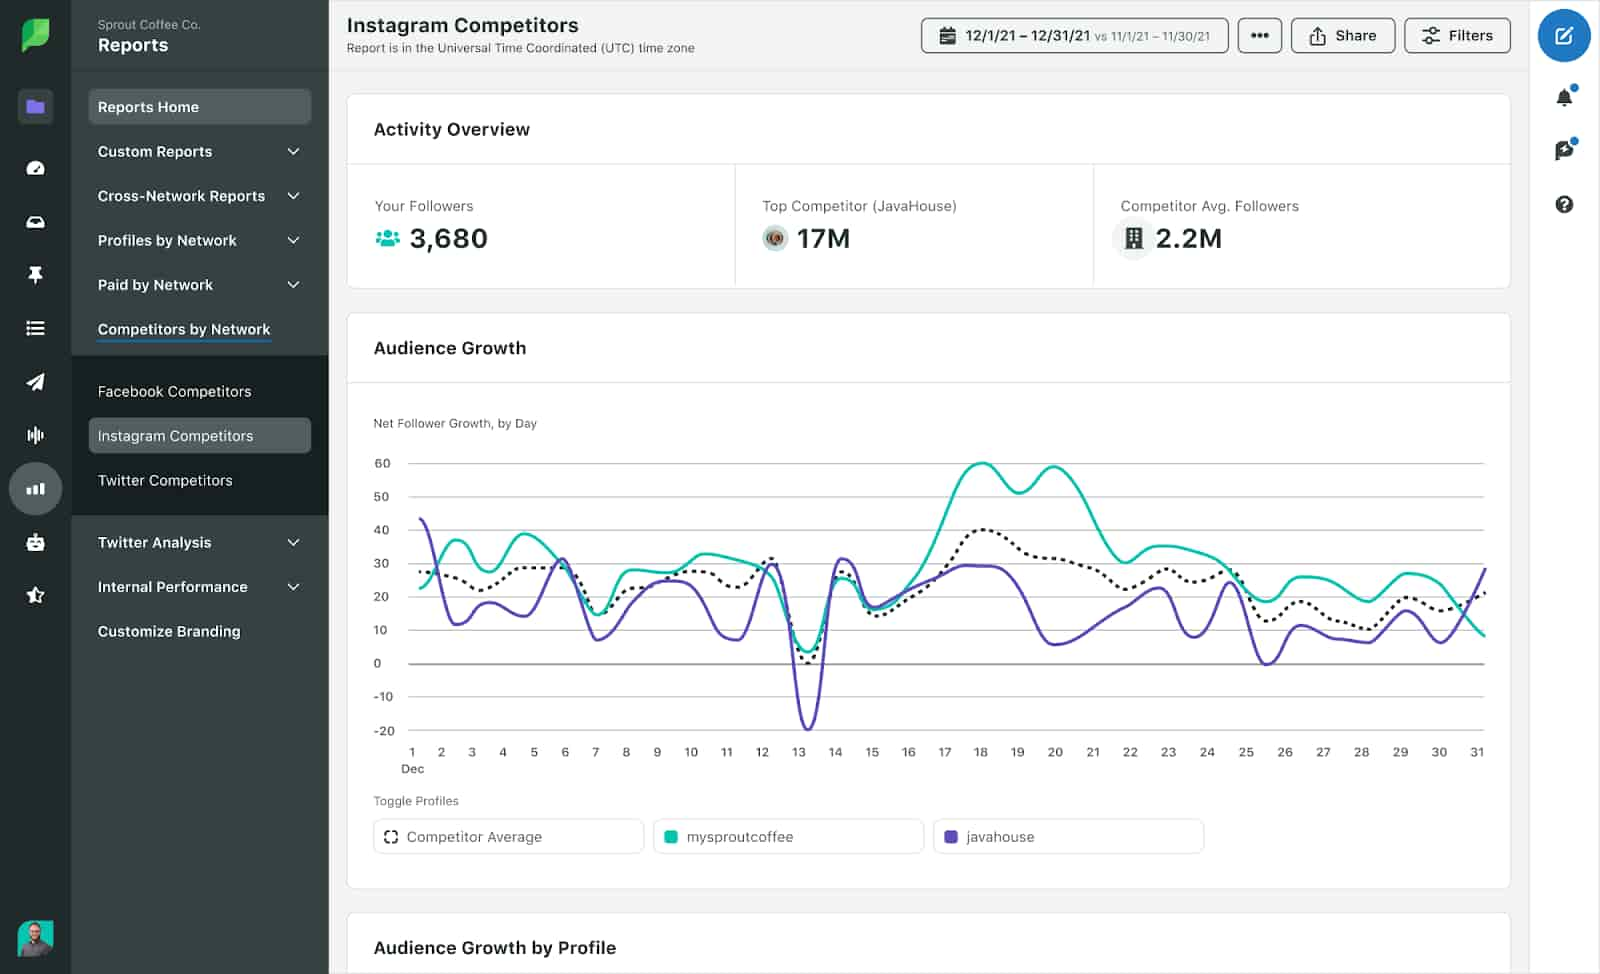
Sprout Social also has powerful social listening capabilities. It lets you cut through the noise to narrow down targeted insights and trends for your audience. Find out your brand health, sentiment insights, industry shifts and more.
Not only can you use Sprout Social for not only Instagram marketing management, but also for your other accounts like LinkedIn, Facebook, and YouTube— to easily compare your results side-by-side.
Key capabilities:
- Separate paid and organic performance: Connect your progress across organic and paid categories to build a unified strategy.
- Instagram scheduling and publishing: Collaborate with your team. Automate your Instagram content posting. Track top posts, comments and other KPIs and discover engaged influencers.
- Real-time monitoring: Quickly analyze Instagram data at the post and profile level.
- Visual and holistic reporting: Dig even deeper into your Instagram data with interactive graphs and metrics. Create a custom, presentation-ready report with the data that’s most valuable for you.
- Smart Inbox: Monitor and get alerts for keywords, hashtags and mentions so you’re always up to date with your audience and
canstart authentic conversations. Sort your inbox with tagging and filtering to prioritize your strategies. - AI-powered captions: Generate Instagram captions with AI Assist to create captions in your brand
‘‘s tone and voice, freeing up time to improve strategy.
2. Instagram Insights
Don‘‘t neglect the native social media reports that Instagram provides. Instagram Insights reports cover impressions, engagement, reach and top posts, among other metrics. Break down this data from the span of a few months or even years.

Key features:
- Native experience: Get raw data from the source and visualize it through an easy user experience.
- Core metrics: Study key analytics like follower activity, performance and engagement.
- Familiar interface for Meta users: Benefit from a familiar interface as you work within the Meta suite.
As a side note, Meta Ads Manager is another native tool that analyzes paid posts, supporting your ad spend optimization.
3. Iconosquare
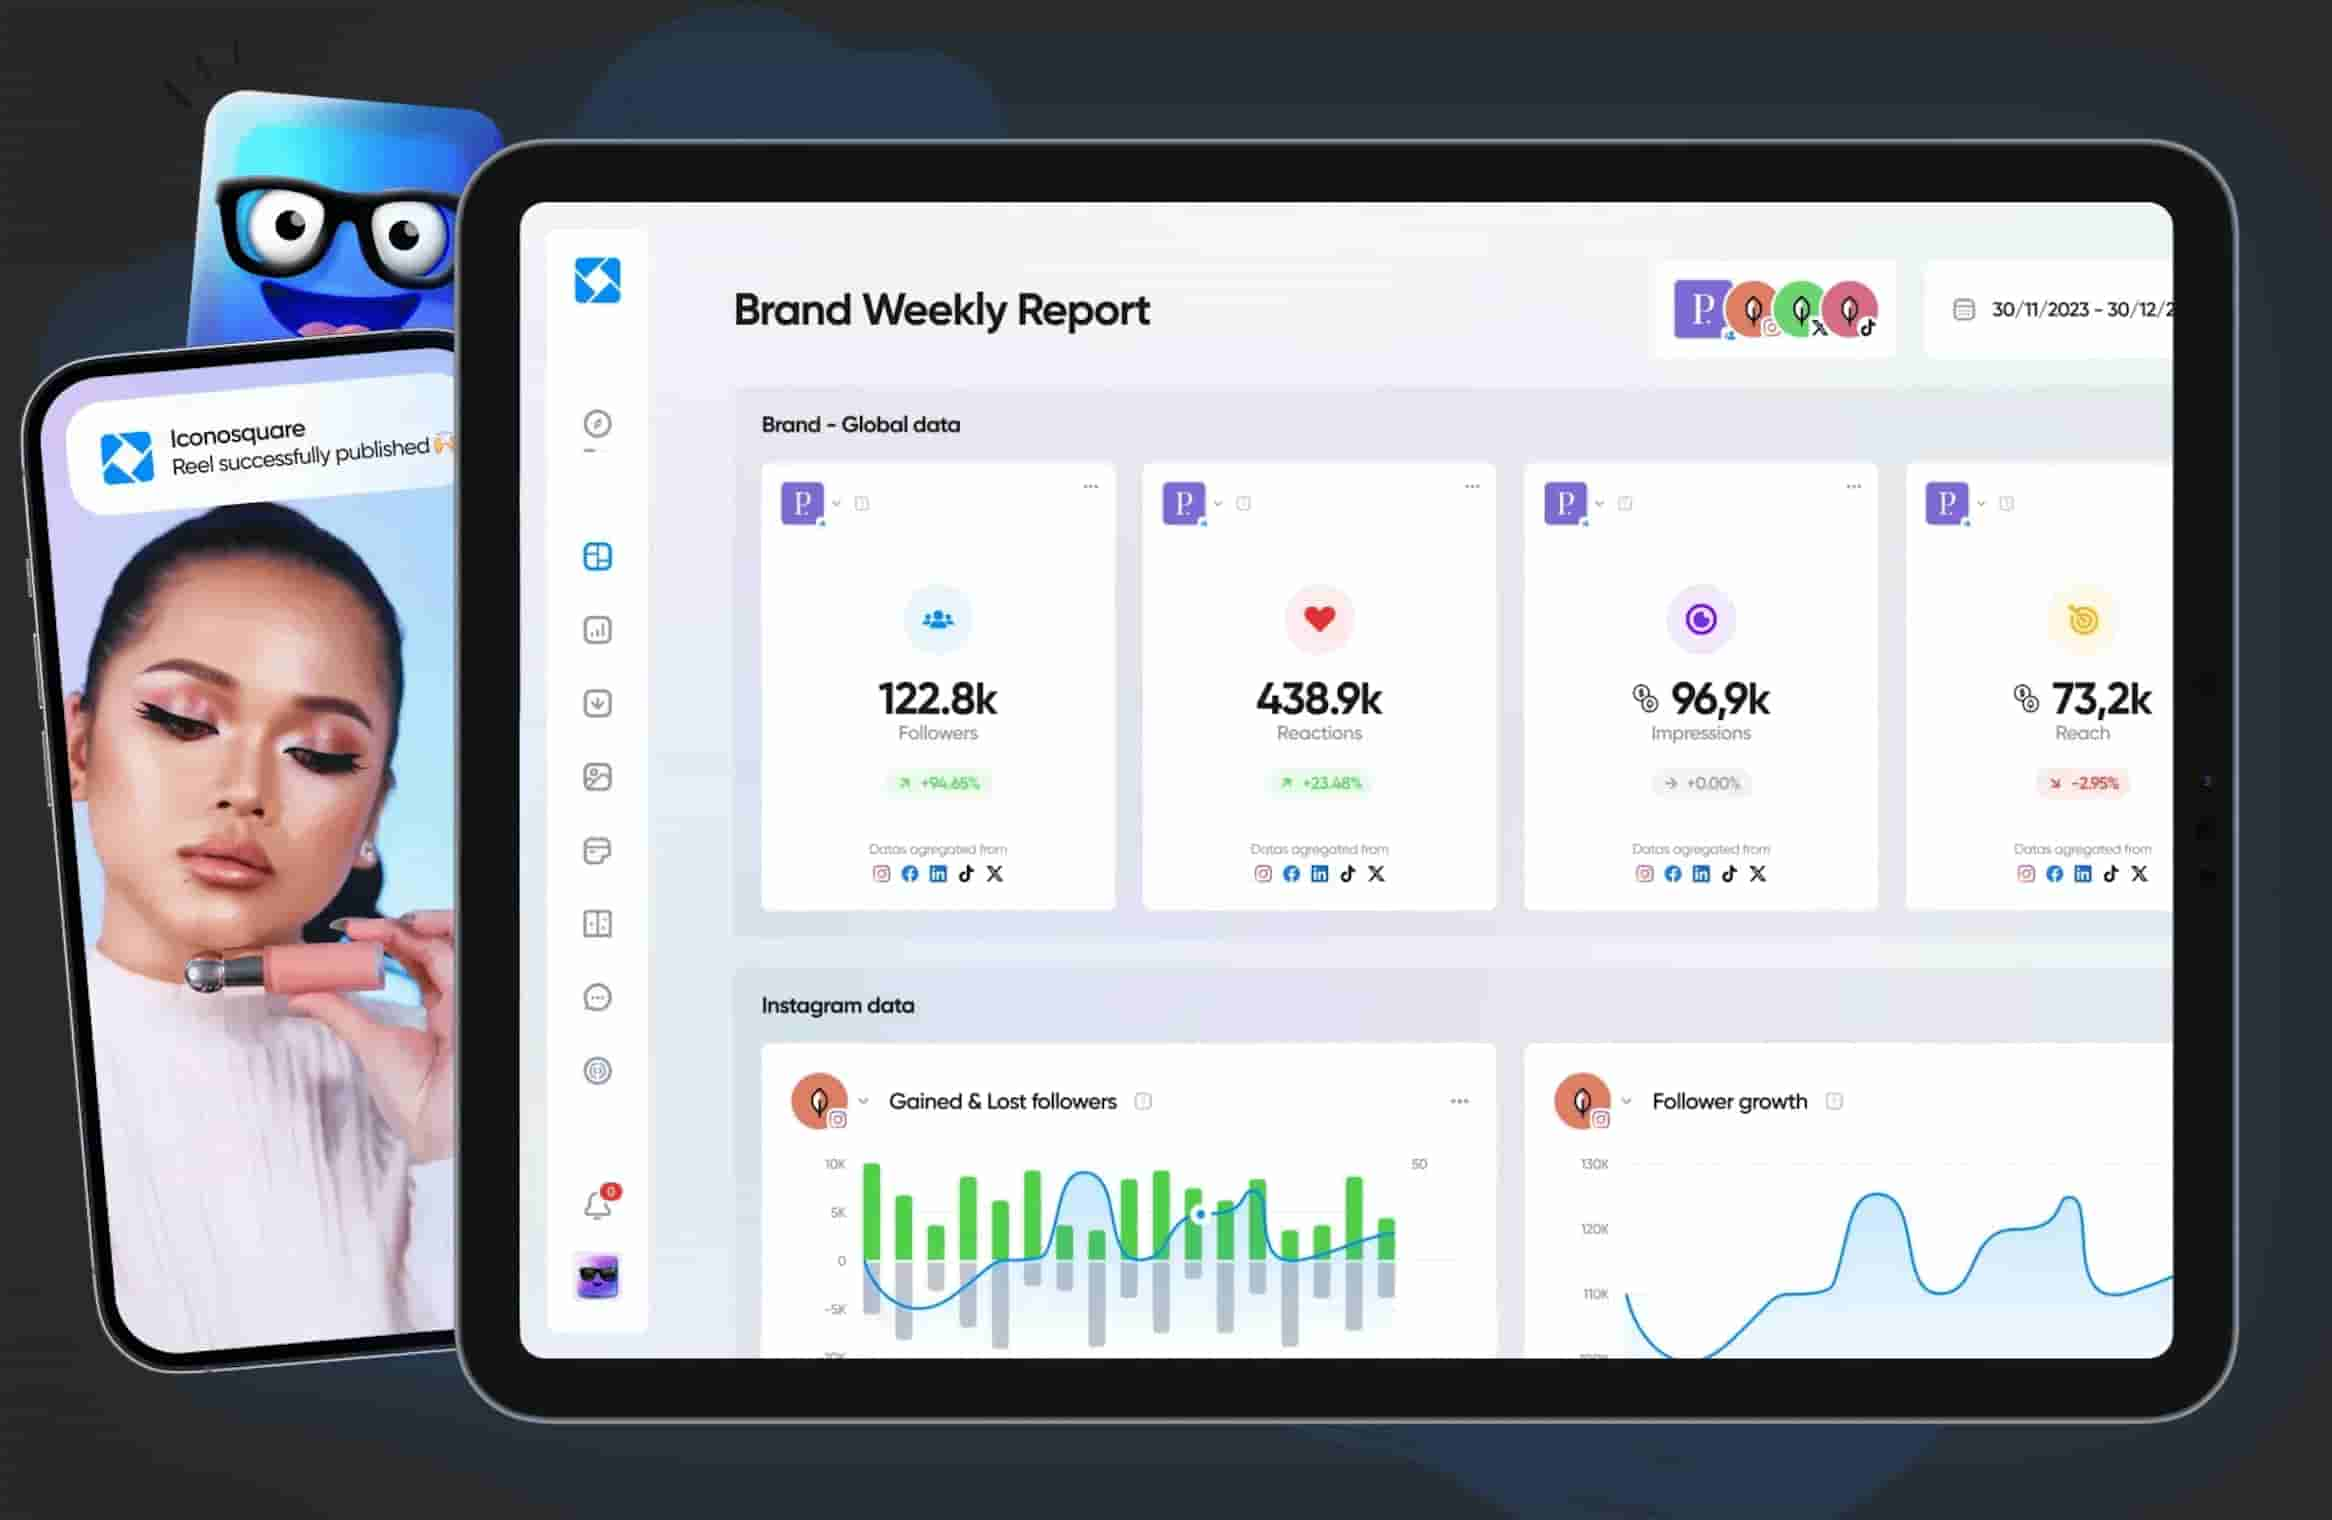
Iconosquare is an Instagram analytics tool that‘‘s tailored for agencies and brands managing multiple accounts. The platform‘‘s features include competitive hashtag and performance tracking.
Key features:
- Free Instagram audit: Receive audits for accounts with a business profile, which checks for profile completion and assesses their 30 most recent posts.
- Analytics and reporting: Get analytics and data visualizations for your Instagram account.
- Collaboration tools: Work with your team to create, publish and analyze your performance.
- Post scheduling: Set automatic times and a calendar for your posts.
4. Keyhole
Keyhole provides real-time hashtag tracking for Instagram, making it perfect for social media contests, brand campaigns or other marketing efforts that center around hashtags.

Key features:
- Data on your influencers: Gather metrics on partner influencers to learn how your campaigns are performing.
- Personalized analytics: Get insights on your posts, Stories, Reels and more to improve campaigns.
- Custom reports: Create PDFs for your team to access analytic reports and real-time dashboard updates.
5. Social Status
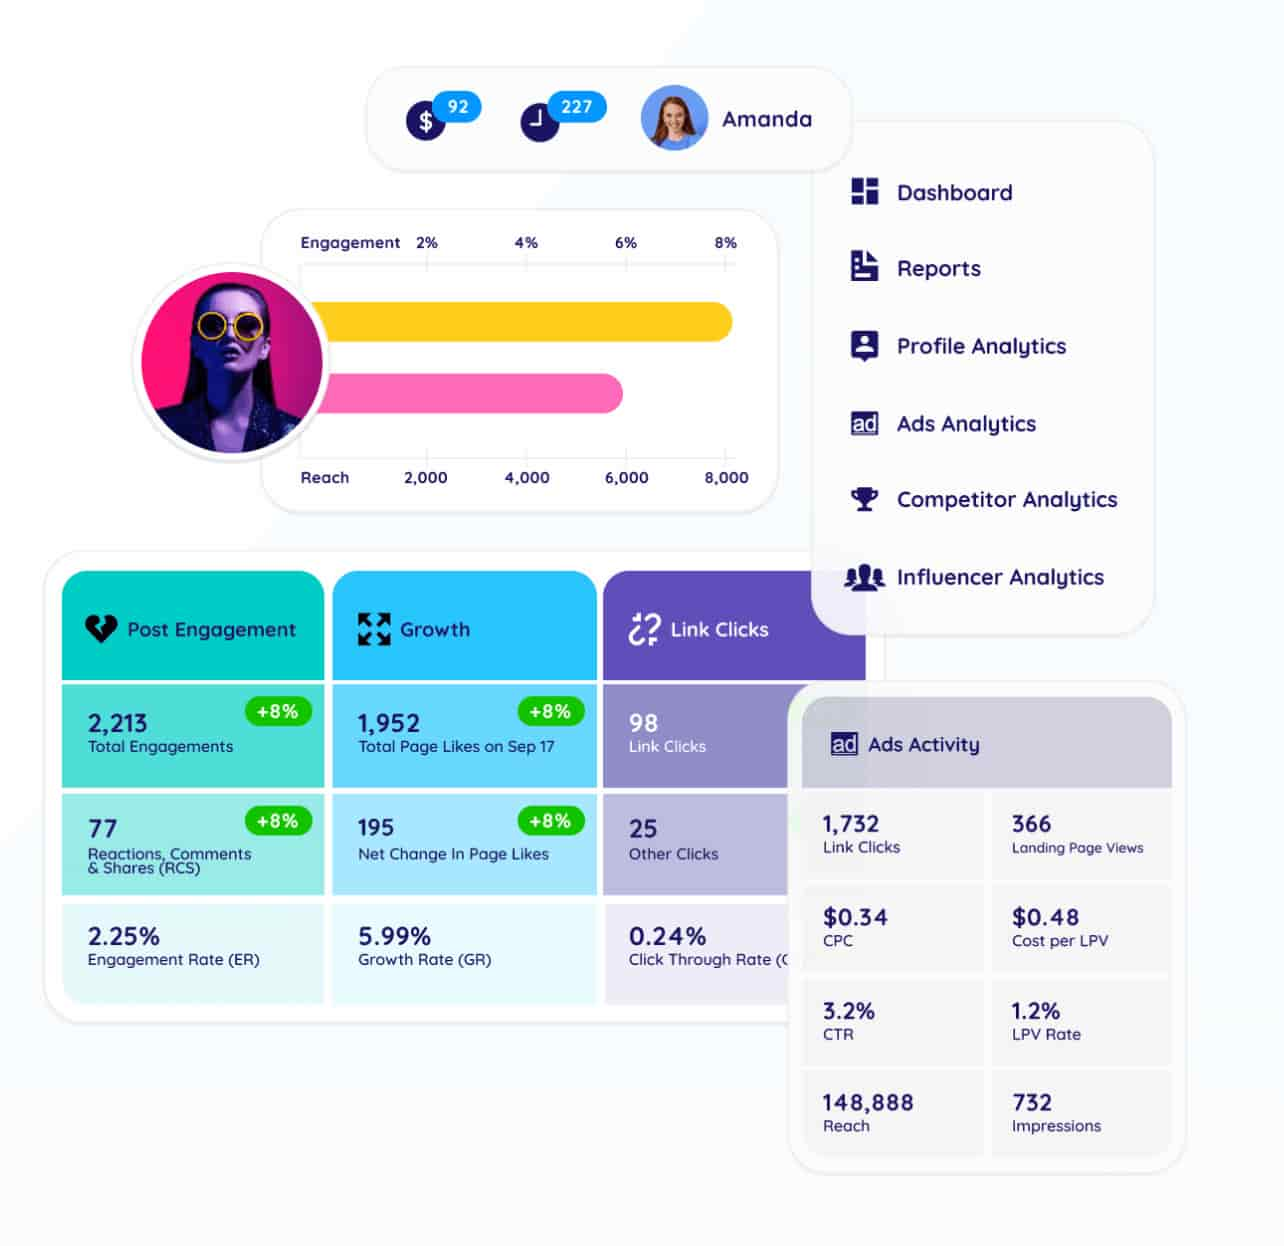
Social Status is an Instagram analytics tool that provides a comprehensive view of how your account is performing, who your audience is and what kind of content resonates with them. The platform lets you analyze data from different types of content, such as posts, Stories and ads, so you can get a better understanding of your audience‘‘s behavior.
Key features:
- Instagram profile analytics: Get data on your content feed, audiences, growth, link clicks and more.
- Multi-platform analytics: Collect and study data from all your social media accounts in one dashboard.
- Audience demographics: Leverage features to track and report on your followers, including their gender, country and age.
6. Hootsuite
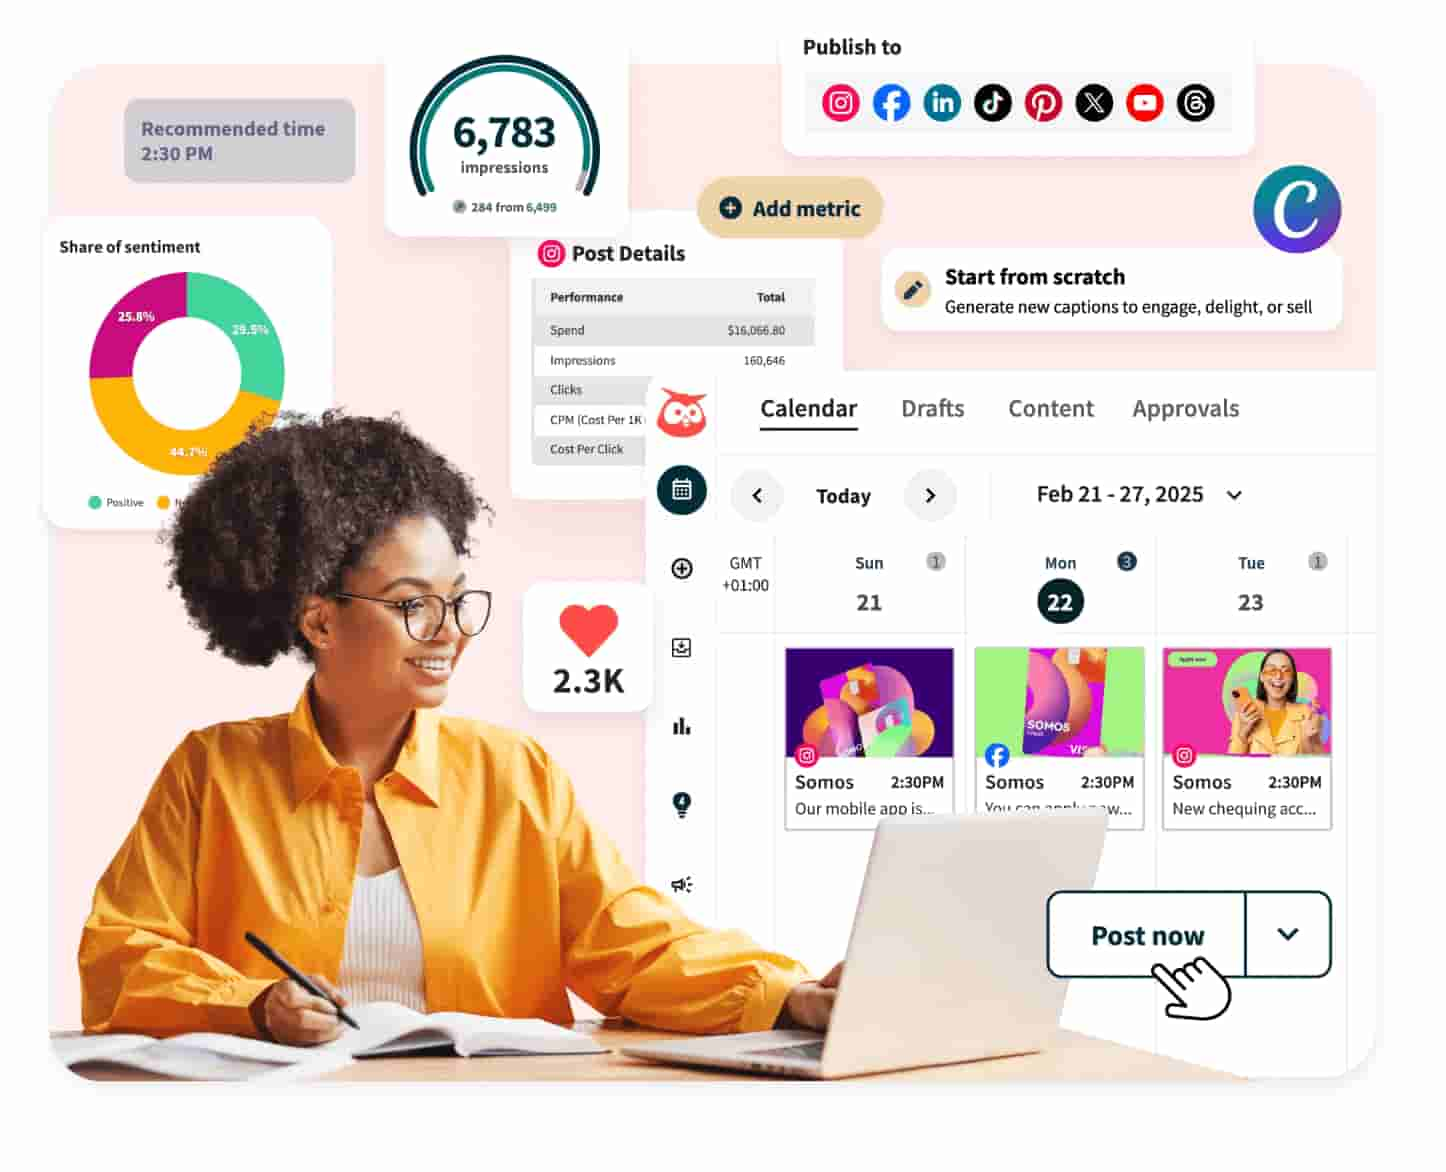
Hootsuite offers an Instagram analytics solution that enables users to track and understand their account’s performance. Through detailed metrics on follower growth, post engagement and audience insights, users can assess content effectiveness and refine their strategies.
Key features:
- Social media performance suite: Track metrics you need, including post engagement times, competitor benchmarks, and paid and organic performance.
- Schedule post features: Create and automate posting within the platform.
- Social listening: Follow mentions, trends and keywords.
- In-platform communication capabilities: Connect with customers and your target audience through direct messages and comment integrations.
7. Squarelovin
Squarelovin, a platform that specializes in influencer marketing, provides users with Instagram analytics and offers insights into engagement, follower growth and content performance. Its data shows when to post and how many people interact with each post.
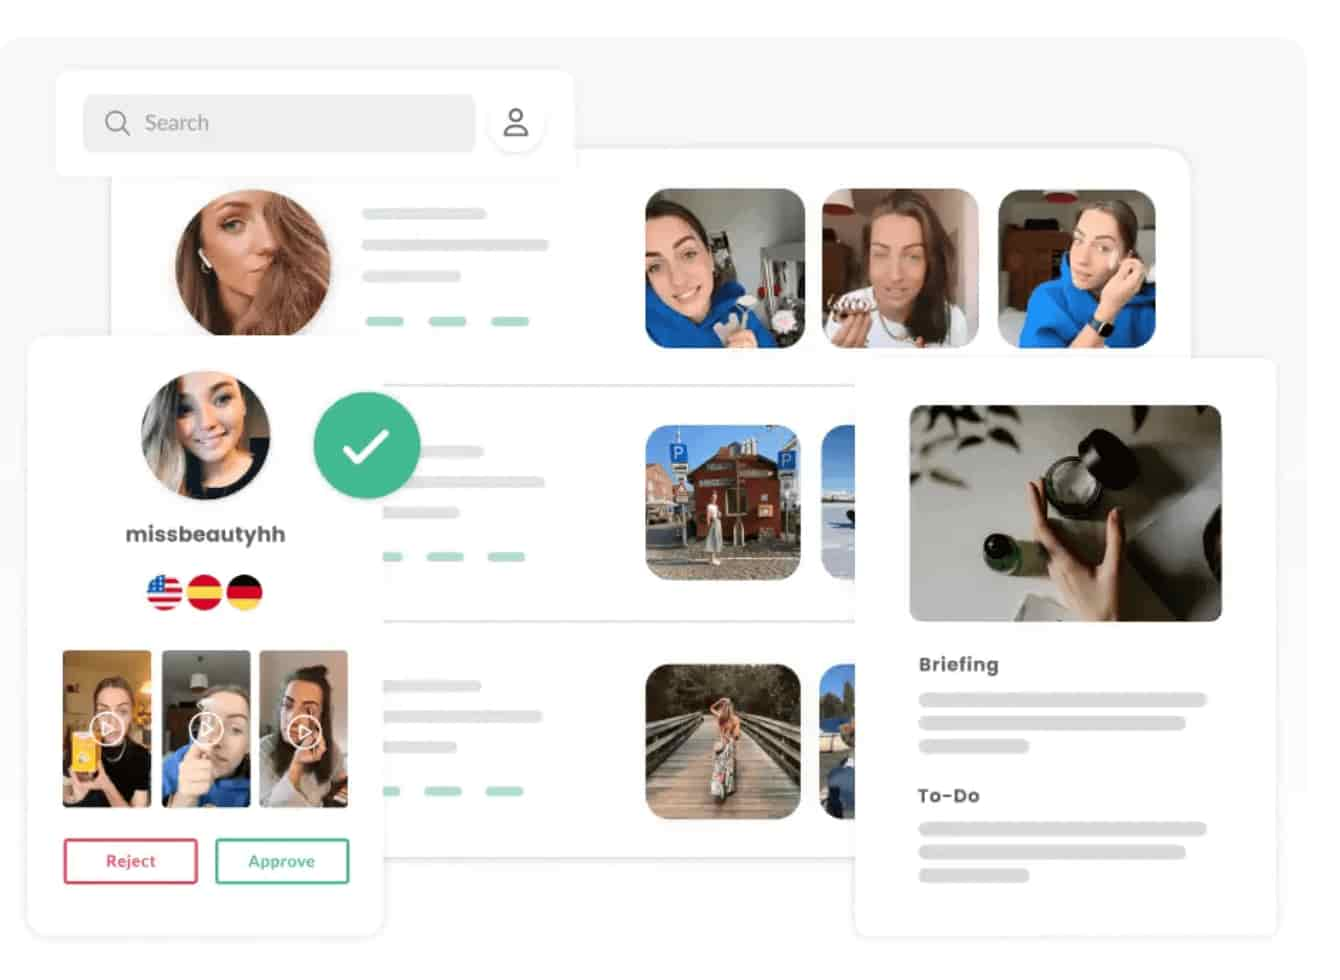
Key features:
- Organized dashboards: Analyze Instagram creators and process applications with attribute highlights and recommendations.
- User-generated content: Access a UGC library connected to your brand, industry and audience.
- Features to publish and measure content: Create and publish content and access reporting for your team and partners.
8. Sendible
Sendible is an Instagram analytics software that provides detailed insights into account performance, including metrics on engagement, follower growth and post reach. It also has reporting features that help users see how different types of content engage their audience.
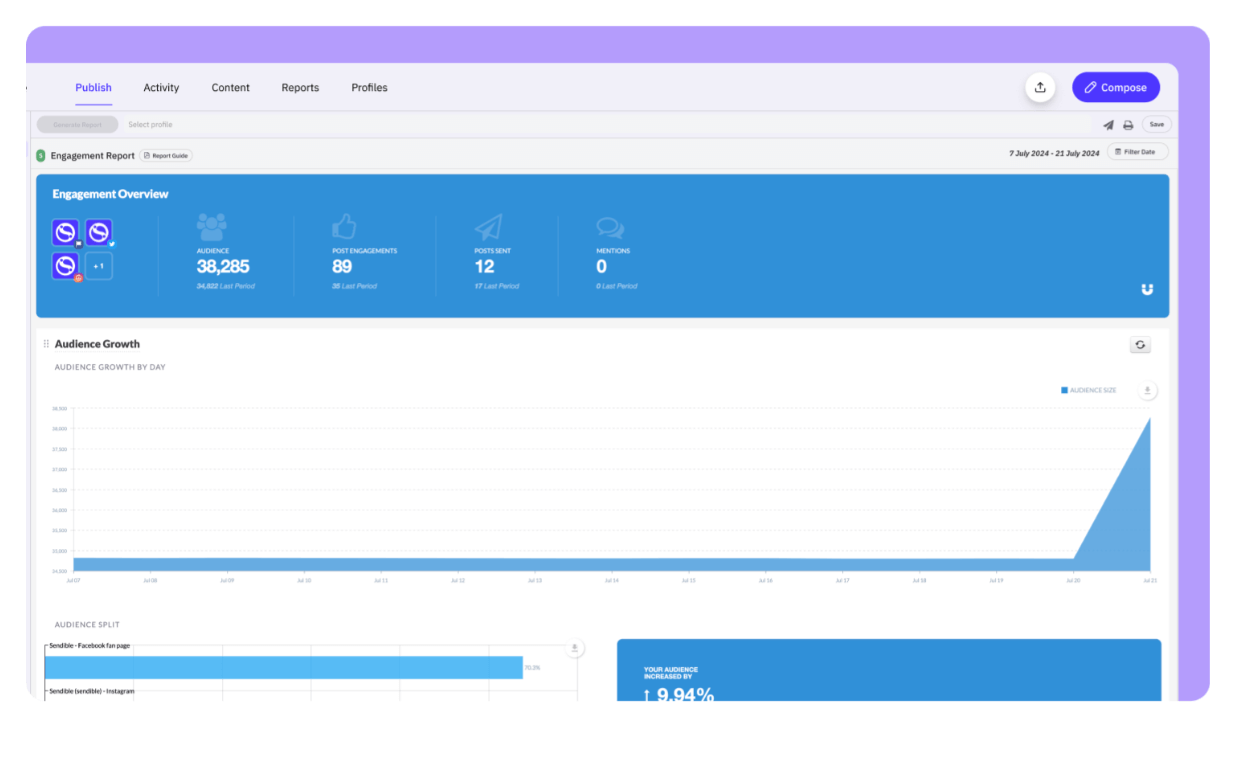
Key features:
- Efficient tracking: Analyze comments and interactions to manage engagement more efficiently.
- Core insights: Study performance comparisons over time, identify trends and refine content strategies.
- Collaboration: Use the workflow features to share dashboards and add in-app approval processes.
9. Bitly
Tracking your Instagram bio link is a must-do for monitoring the success of your social campaigns. This rings true whether you’re trying to sell products or drive traffic to your site.
Bitly is a tried-and-tested link-tracking tool that’s suitable for both budding businesses and big brands on Instagram.

Key features:
- Short links and tackle insights: Breaks down your bio click links in conjunction with Google URL builder to provide an in-depth performance report of your campaigns.
- Features to track paid campaigns: Track links in your paid Instagram campaigns, beyond bio URLs.
- QR codes and landing pages: Build trackable QR codes and minimalist landing pages for quick marketing solutions that capture data. The platform also integrates with social media management tools like Sprout Social.
10. Phlanx
Phlanx”s ngagement calculator analyzes the engagement rate of any given Instagram account and is primarily for influencers.
The platform calculates the engagement rate by dividing the number of Likes and comments a post receives by an account’s follower count. There’s no magic number for what a brand influencer’s engagement rate should be, although, for some marketers, a ballpark of around 3% is good to average.

Key features:
- Fast influencer check-ups: See how high an influencer’s engagement rate is, plus other details like average Likes.
- Fake followers: Easily find fake followers or determine whether or not an influencer’s posts get legitimate engagement.
- Competitor information: Track competitors’ engagement rates, in addition to your own.
11. ContentStudio
ContentStudio provides Instagram analytics that allow users to track engagement metrics, follower growth and content performance. It also offers insights into which posts drive the most interaction, which makes identifying successful content types easier.
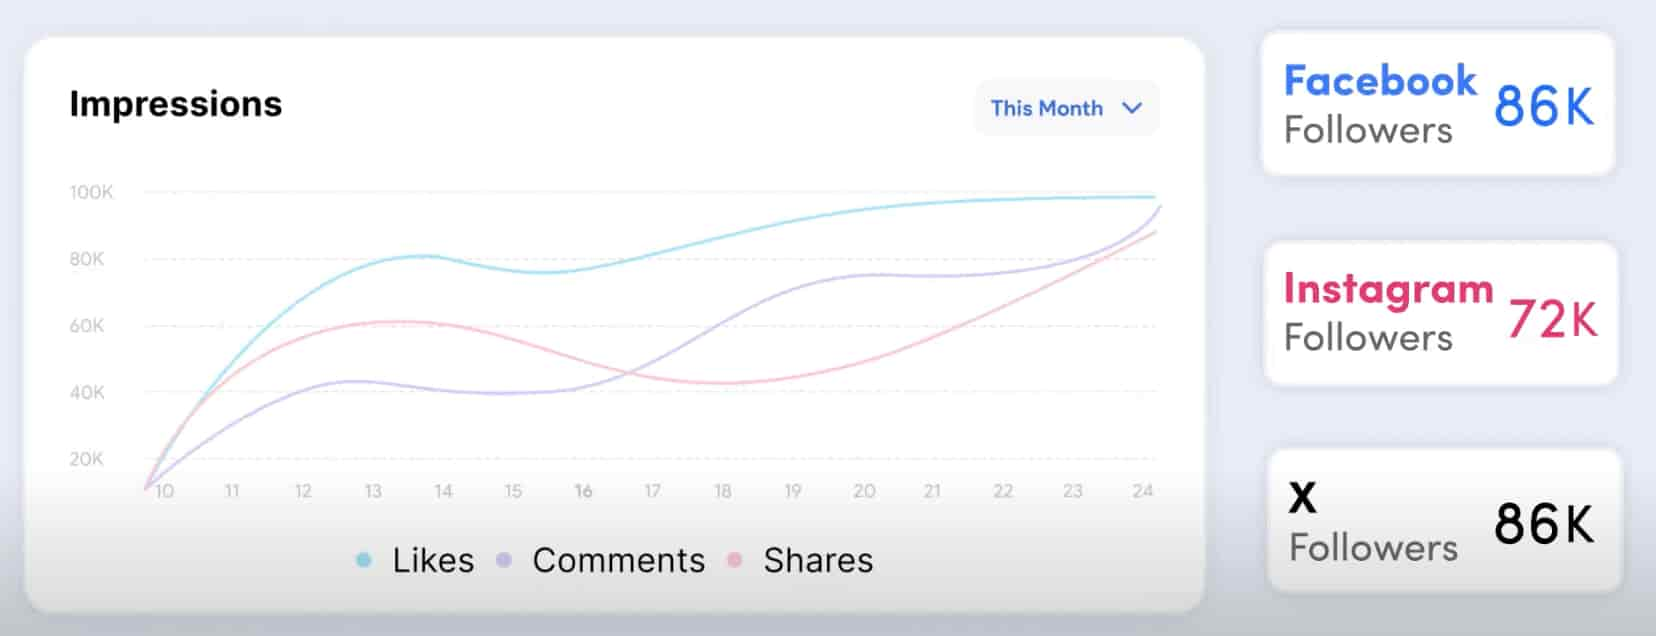
Key features:
- Core analytics: Study Instagram audience demographics and optimal posting times to inform more effective scheduling and strategy decisions.
- Unified dashboards: Consolidate data from multiple accounts for a centralized view of performance across various profiles and platforms.
- AI writer: Use AI to generate captions, suggest hashtags and create images.
12. Metricool
Metricool’s social media management tool provides Instagram analytics that help users monitor account performance, including metrics on follower growth, engagement rates and content reach. The tool also provides insights into the best times to post based on audience activity, which allows users to refine their scheduling for optimal engagement.
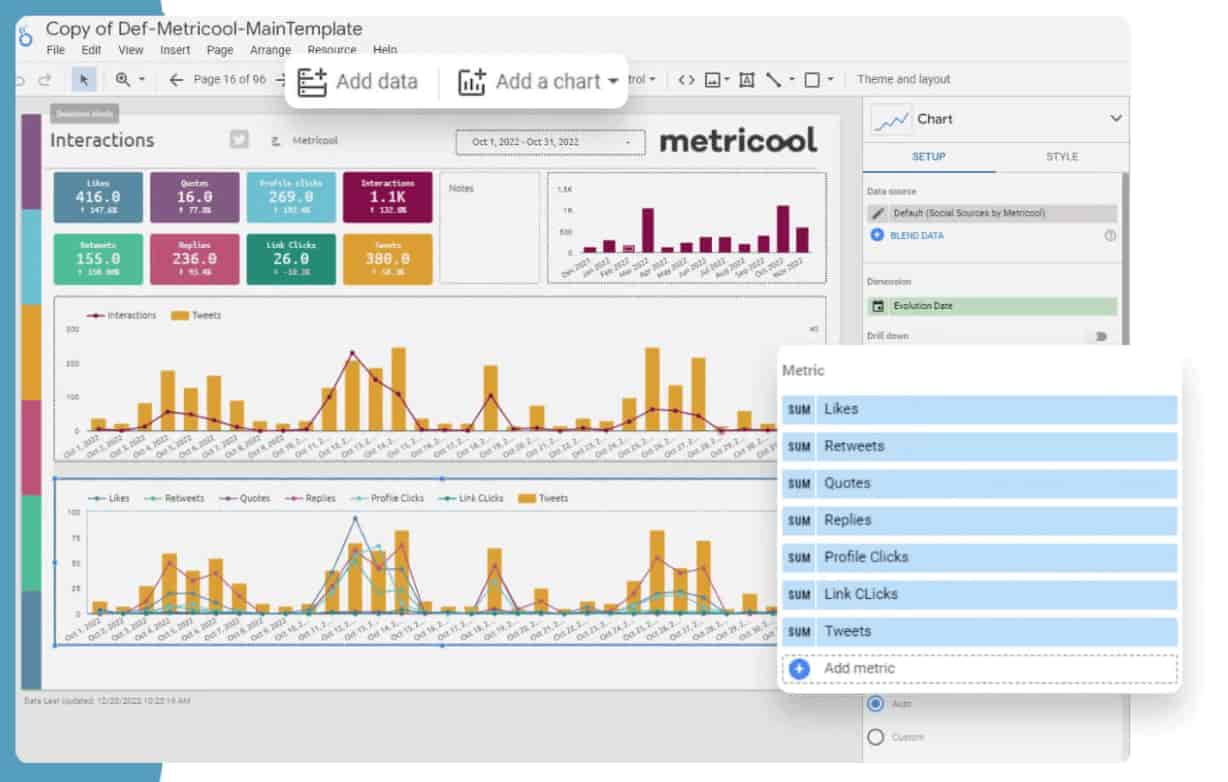
Key features:
- Format analysis: Compare content types to see which ones resonate most with followers.
- Clear visual reports: Easily track trends over time and consolidate performance data from multiple accounts into one dashboard.
- Collaboration: Work with your team to plan, post and report on performance.
- Fast reporting: Download CSV files to quickly share results with your team and partners.
13. Pallyy
Pallyy is a social media management platform ideal for fast-growing brands and agencies. With it, you can schedule posts, reply to messages and access data in your dashboard.

Key features:
- Competitor insights: Track 10 competitors at a time for insightful trends, gaps and ideas.
- Capabilities to analyze your posts: Get core metrics—such as engagement rates, likes, comments and more—per post.
- Custom reports: Easily build reports with wedges and download them as PDFs.
14. Brand24
Brand24 uses AI for social media management, listening, tracking and mentions across social media, podcasts, reviews and more. It helps you manage your Instagram and social media across the internet—a useful PR tool for your social media strategy.

Key features:
- Monitoring across the internet: View insights from millions of online sources in real time.
- Social listening: Get sentiment analysis for mentions to understand your audience’s thoughts on your brand and the industry.
- Reporting: Measure and communicate your PR on social.
How to select the right Instagram analytics tool for your needs
Choosing the right Instagram analytics tool is overwhelming when so many options and strategies exist. Here’s a quick guide to picking the best Instagram analytics platform for your business:
Identify your business objectives
Start by deciding what you want to achieve with Instagram analytics, including:
- Tracking performance
- Understanding audience behavior
- Benchmarking competitors
- Refining your strategy with advanced metrics
Clearly defining your priorities is the first step. When you understand your priorities, you can then narrow down the must-have features in a tools from the nice-to-haves. For example, if a key objective is to drive traffic from Instagram, a platform with an integrated ‘link in bio‘ solution, like Sprout Social, directly supports that goal by streamlining campaign tracking and user experience.
Confirm your budget
Native Instagram insights offer a starting point, but paid software solutions deliver deeper insights and automate your analyses.
Solutions like Sprout Social offer pricing that scales with your brand. Whether you’re a growing brand or an enterprise-level organization, Sprout Social’s capabilities scale with you and your budget. Beyond that, it enables you to connect your performance to business goals and ROI so you know which investments result in business impact.
Look for key integrations
There‘‘s no point in using a solution if it can‘‘t talk to your other tools. Your Instagram analytics management platform should integrate with your martech stack so your data isn‘‘t siloed and your technology scales with the rest of the business.
Sprout Social breaks down silos by creating a unified management experience within a single dashboard–with all your social accounts. Also, combine your views, such as your CRM, BI platform and collaboration tools, like Slack.
Prioritize tools with an intuitive interface
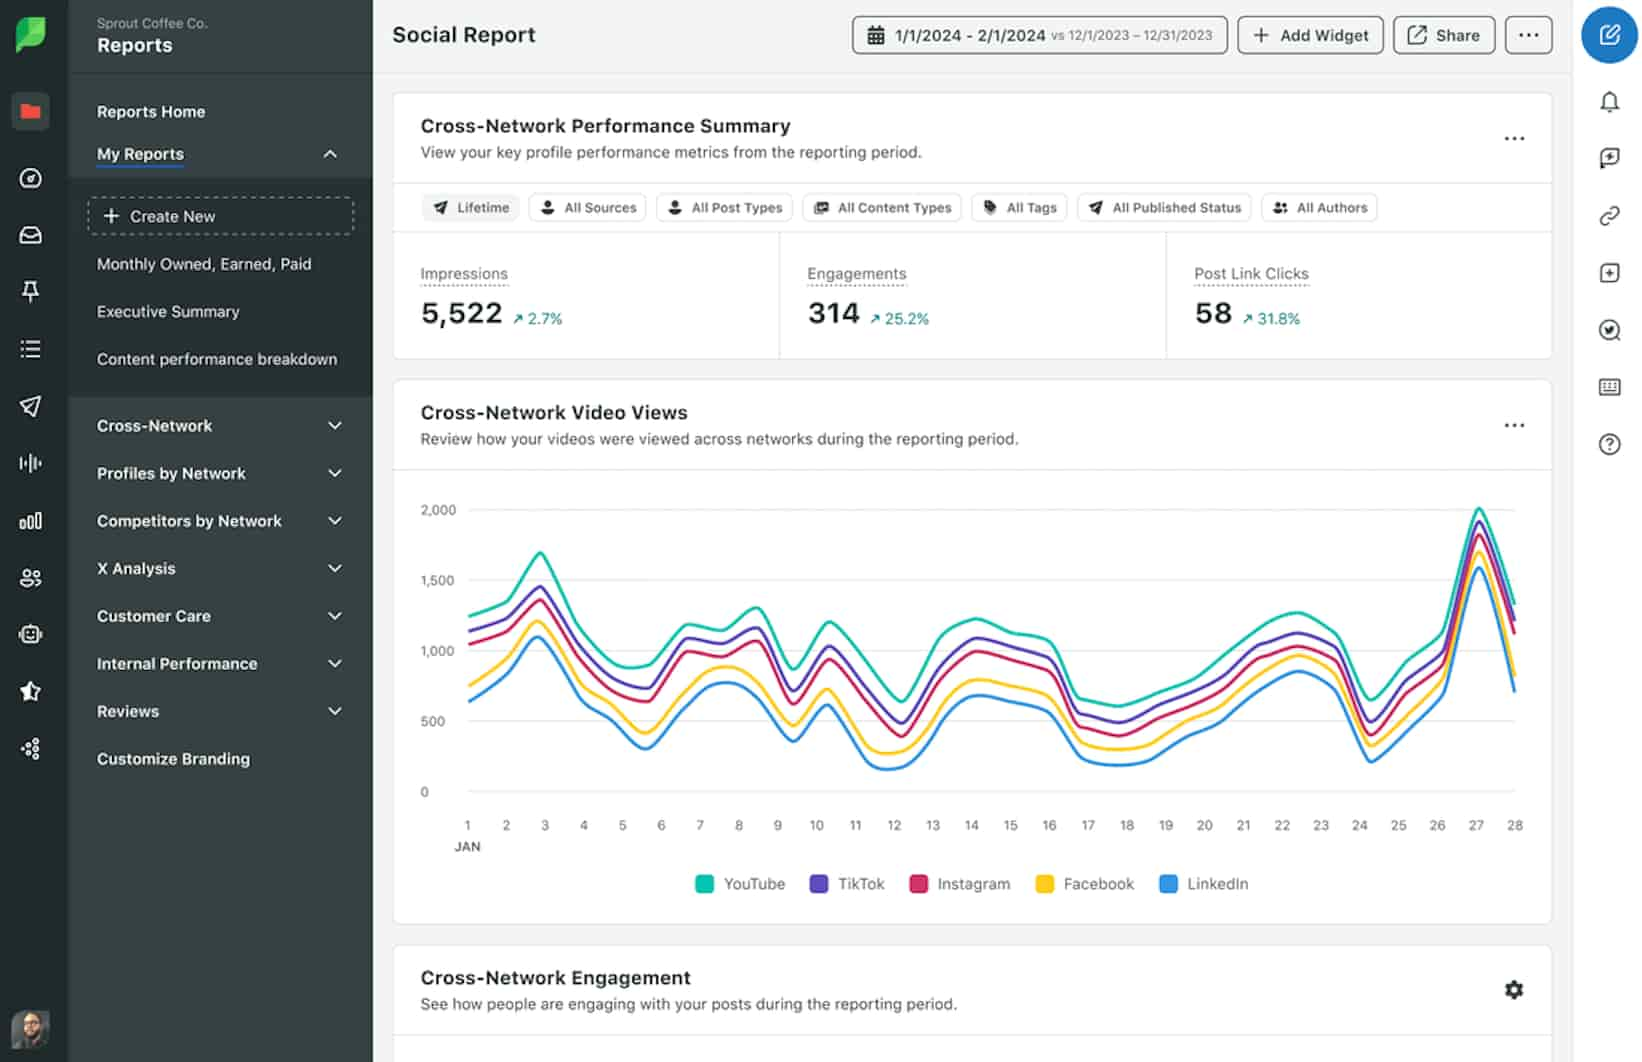
The solution your team uses should streamline and simplify their work. Look for tools that are user-friendly and intuitive. Dashboards, for example, should consolidate your key metrics in digestible reports tailored to your team’s needs.
With the right tool, your team will spend less time digging for information and more time applying actionable insights.
How to view Instagram analytics using Sprout Social
Here‘‘s how to analyze your Instagram data, with Sprout Social serving as an example to illustrate the reporting process:
- Sign up for a free trial with Sprout to get started. Enter your name, email and a password.

- Connect your Instagram account and your other social profiles for a unified view. This should take a few seconds. For more information on connecting a profile, scan this support article.
Two. Connect your Instagram account and your other social profiles for a unified view.

- Once you’ve added all your social profiles, click on Reports in the left toolbar. Navigate to Reports home > select Profiles by Network.
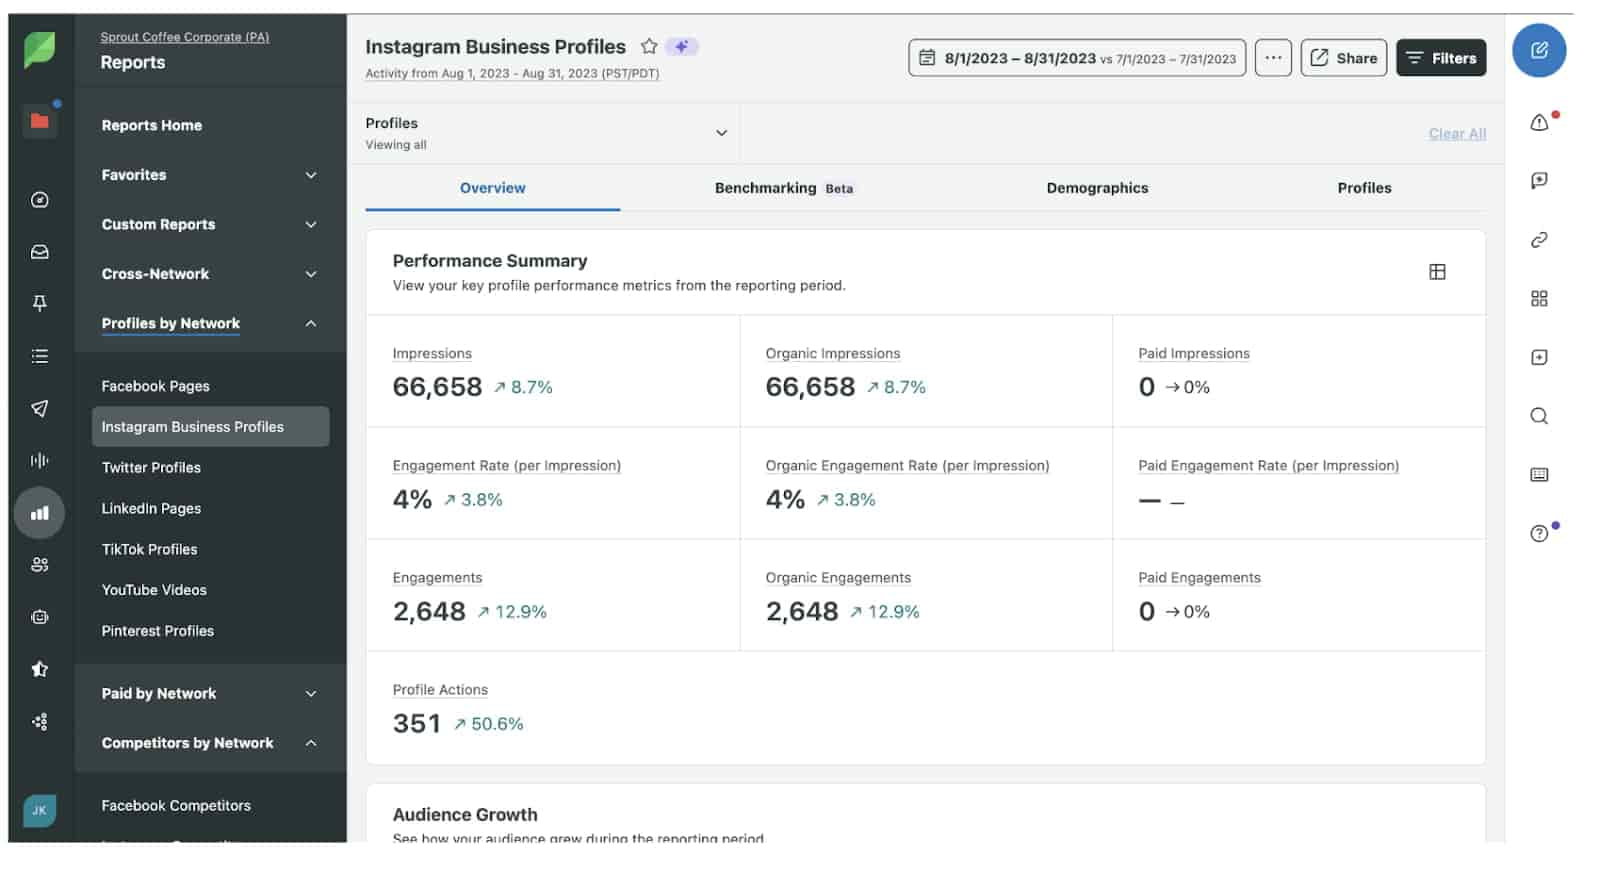
- Choose Instagram Business Profiles for a complete overview of your Instagram business accounts. You can find organic and paid metrics, such as impressions, audience growth, engagement rate and publishing behavior.
Not only will you get advanced analytics with your Instagram account, but you’ll also be able to compare those results with your other social media accounts. These side-by-side comparisons help you evaluate your entire strategy. This supports you in learning from Instagram and applying any transferable insights to your other social media platforms, like TikTok, X (formerly known as Twitter), LinkedIn and more.
Empower your Instagram strategy with Sprout Social
Instagram analytics give you a roadmap to improving meaningful engagement, audience growth and strategic impact.
Sprout Social’s Instagram analytics solutions provide the insight you need to strengthen your social media strategy and tie your efforts to real business objectives.
Sprout Social is an all-in-one solution that unifies your social media accounts in one dashboard. Get deeper Instagram insights with cross-platform reporting, automated delivery, team collaboration and direct capabilities to prove your strategy’s ROI.
Get valuable Instagram insights with Sprout Social and transform them into actionable steps. Start with a free 30-day trial today.
Additional resources for Instagram Analytics Tools
37 essential Instagram metrics to measure performance in 2026
Top 14 Instagram analytics tools for growth in 2026
How to boost Instagram impressions and reach in 2026
How to analyze Instagram Reels analytics to grow
Instagram Story analytics: how to track the right metrics for your brand



Share