How to build a strategic YouTube dashboard: A guide to YouTube Studio and beyond

Written by John Paul Hernandez
Published on March 11, 2026
Reading time 11 minutes
Table of Contents
A strong YouTube strategy starts with understanding your data. While the native YouTube dashboard, officially known as YouTube Studio, gives you core metrics for video management, it often operates in a silo.
For marketing teams, a successful strategy requires a social media reporting solution that connects video performance to broader business goals.
This guide walks you through the essentials of the native YouTube Studio dashboard and shows you how to build a strategic, cross-channel dashboard using a unified reporting platform like Sprout Social.
What is the YouTube dashboard (and where to find it)?
Your YouTube dashboard is the central command center for creators and brands located inside YouTube Studio. It’s the backend interface where you manage videos, playlists and live streams, moderate comments, review monetization eligibility, view channel analytics and control channel settings.
You can access YouTube Studio in two ways:
- Desktop: Go to studio.youtube.com after signing in to your YouTube account. Or, click on your YouTube profile picture and select YouTube Studio.
- Mobile: Download the YouTube Studio app for iOS or Android to monitor performance, manage comments and edit metadata on the go.
While YouTube Studio is essential for managing any channel, marketers and social media teams often need deeper reporting than what the native tool provides. To connect YouTube data with cross-network insights, you need a third-party platform.
A tour of your YouTube Studio dashboard
Your YouTube Studio dashboard acts as the control center for everything related to your YouTube channel. Whether you’re publishing YouTube videos, reviewing analytics or managing community guidelines, this is where you start.
Below is a complete walkthrough of the key tabs and why they matter to marketers building a data-driven YouTube strategy.
The Channel dashboard: Your 30,000-foot view
When you first log into YouTube Studio, you land on the Channel dashboard—your high-level snapshot of recent activity so you can check channel health in seconds.
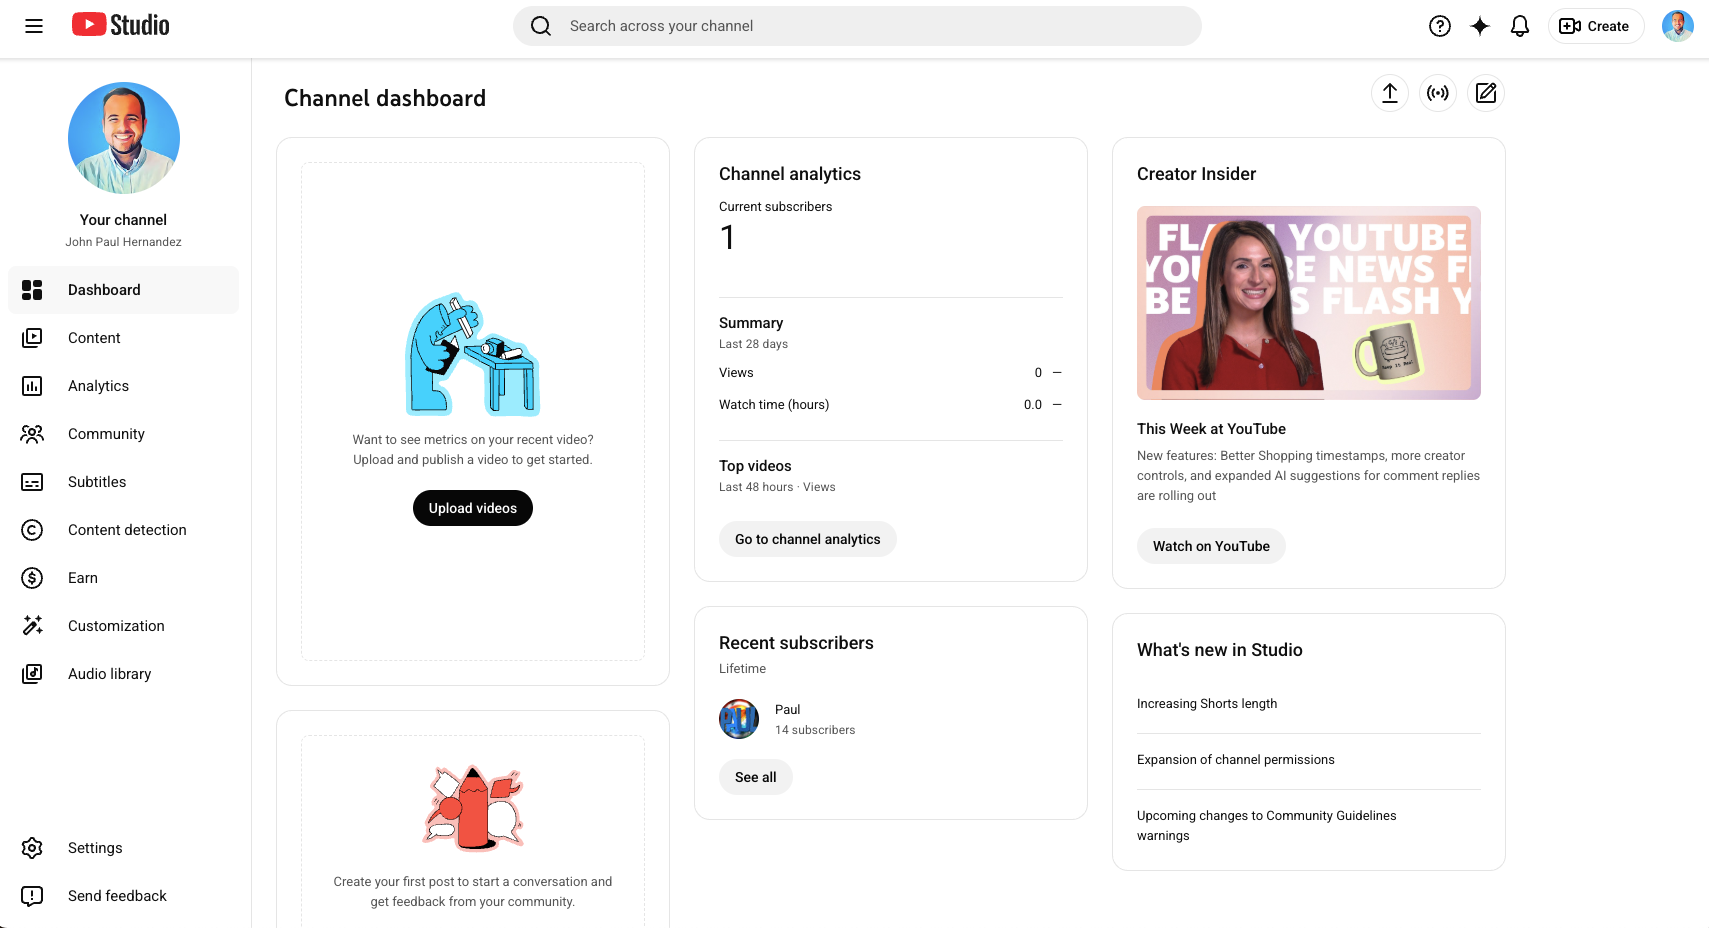
This page functions as your mission control. It pulls together core metrics so you can quickly evaluate channel performance without digging into individual reports.
- Performance snapshot: Track views, watch time and subscriber changes for your channel over a recent period (e.g., last 28 days)
- Latest video performance: Ranks your most recent upload against your previous videos using metrics like views, click‑through rate and average view duration
- Recent comments: A quick-access feed to review and reply to the latest viewer comments
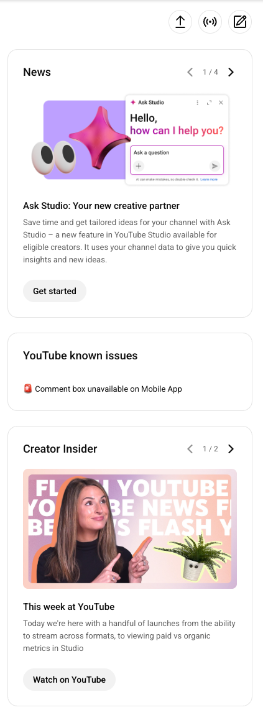
- Known issues: YouTube’s status widget listing widespread bugs, outages or analytics/reporting delays
- News and Creator Insider: Updates on network features or trends that may impact your strategy
The Content tab: Your video management hub
The Content tab is where you manage your entire YouTube channel library, including long-form videos, Shorts, posts, playlists and past live stream recordings.

You perform the following tasks in your YouTube content library:
- Optimizations: Edit titles, descriptions and thumbnails to improve CTR and optimize for the YouTube algorithm
- Visibility and restrictions: Manage visibility settings (Public, Private or Unlisted) and review copyright claims
Consistent metadata, strong titles and accurate visibility settings directly influence your discoverability, watch time and overall channel performance.
The Analytics tab: Your core data deep dive
The Analytics tab is where marketers spend most of their time. It houses the metrics that help you understand not only what happened, but also why it happened—the foundation of any strategic decision.
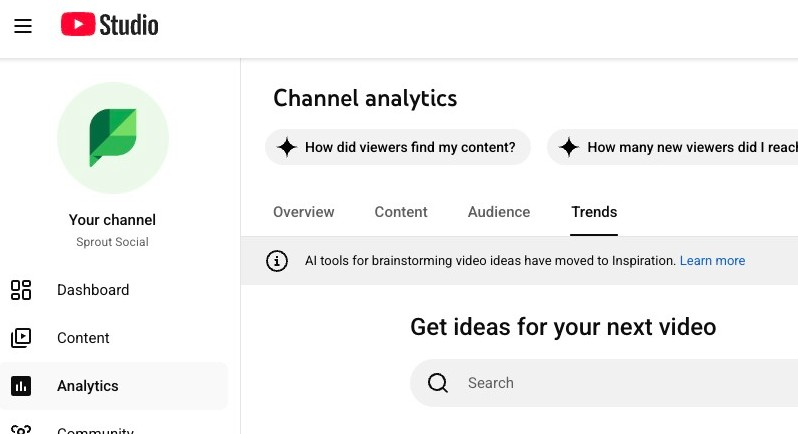
You’ll find four major sub-sections in the Analytics tab:
- Overview: High-level metrics like views, watch time, subscriber growth, real-time activity and top videos
- Content: Subscribers, impressions, how viewers find you, new viewers, and traffic sources
- Audience: Watch behavior, popular videos with different audiences (new, casual and regular), videos that grow your audience list, watch time from subscribers and viewer demographics
- Trends: Insights into top-performing formats, content types and topics based on user behavior
Key metrics here include impressions, traffic sources and audience retention curves. These reveal how viewers discover your videos, when they drop off and what keeps them engaged.
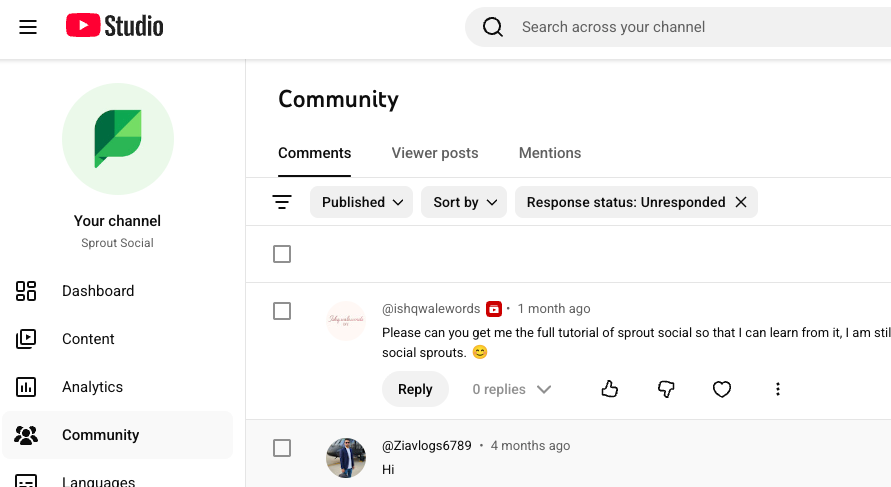
The Community tab: Your community pulse
The Community tab gives you visibility into conversations around your channel. It includes the following insights.
- Comments: A filterable feed showing viewer comments, the video they came from and moderation tools
- Viewer posts: Depending on your channel’s eligibility, you may have access to YouTube’s Community posts, allowing you to publish updates, polls or images directly to your audience
- Mentions: A running list of every time your channel is mentioned across YouTube—via titles, descriptions, Shorts or Community posts
Monitoring comments and mentions enables you to respond faster, spot trends and maintain a healthy community presence—signals that tell the algorithm your content is valuable.
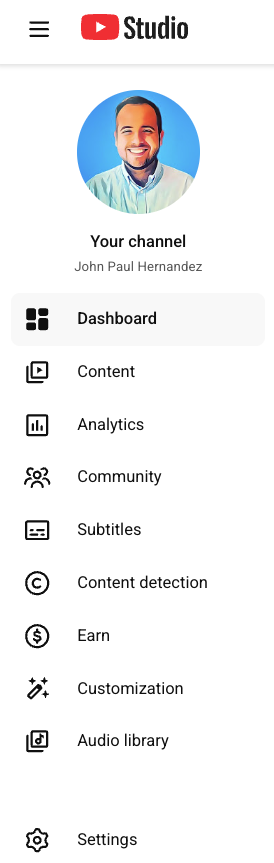
Other YouTube Studio tabs
You’ll also find several specialized tabs that support channel management:
- Language: Tools for adding translations and improving accessibility
- Content detection: Copyright insights and matching detection
- Earn: Monetization settings, revenue analytics and eligibility status
- Customization: Layout, branding elements and profile picture updates
- Audio library: Free music and sound effects for your videos
These tabs help you maintain brand consistency, monitor monetization and ensure your content meets YouTube’s community guidelines.
Why the native YouTube reporting dashboard isn’t enough for marketing teams
YouTube Studio offers essential insights for managing a channel, but most marketing teams need a more complete picture to understand how YouTube contributes to business outcomes.
Native channel analytics are powerful for creators, yet they operate in a silo—separate from the rest of your social media strategy.
For brands, agencies and cross-functional teams, relying solely on native analytics presents several strategic challenges:
Isolated YouTube data limits strategic insights
YouTube Studio only shows YouTube metrics. Native tools cannot compare your video performance to Instagram Reels, TikTok posts or LinkedIn videos. To understand true performance impact, marketers need to evaluate YouTube videos alongside other social media content.
Without cross-network visibility, it’s difficult to understand whether a spike in watch time or a drop in subscriber count is part of a larger trend.
Inefficient workflows for teams
Marketing teams often need to share performance snapshots, respond to comments and review video analytics collaboratively. But native access often requires sharing login credentials or manually exporting data into spreadsheets, slowing down collaboration for cross-functional teams.
As your YouTube channel grows, teams need a central place to analyze engagement, manage notifications and coordinate responses without switching tabs or sharing personal credentials.
Lack of customizable, comparative views
The native YouTube studio dashboard offers fixed views. While the native tool provides must-have metrics, it wasn’t designed for complex business reporting, multi-profile management.
Because of these limitations in the layout, you can’t easily build:
- Campaign-level reports
- Side-by-side comparisons of top videos
- Tag-based segments
- Long-term trend visualizations
- Multi-channel QBR dashboards
Difficult to tie YouTube analytics to business impact
Marketers need to understand not just what the data says, but what it means.
Native tools don’t connect channel performance to ROI, audience growth or cross-channel influence—a gap solved by using Sprout Social’s unified social media reporting tools.
While all of these limitations exist for YouTube Studio, it doesn’t mean you’re stuck with blind spots. Instead, use a platform like Sprout to consolidate your social media marketing channels and get a more in-depth analysis of YouTube.
What’s included with Sprout’s YouTube analytics dashboard?
Sprout Social unifies your YouTube analytics with the rest of your social strategy and creates a cohesive reporting experience, transforming raw data into business intelligence.
Sprout surfaces essential data in an organized, intuitive way that helps you understand your YouTube videos in the context of everything else your team is producing.
This turns day-to-day reporting into strategic insight, especially when you’re managing campaigns across multiple platforms. Here are some specific reports you can create:
YouTube Videos Report: View YouTube performance at a glance
Sprout’s YouTube Videos Report offers a clean, visual overview of how each video is performing. You can sort by views, engagements, average view duration, visibility status and publish date to quickly identify high-performing content and understand whether a new upload is resonating with viewers.

When you need to go deeper, Sprout’s Premium Analytics reveals long-term performance patterns through trend graphs and comparative visualizations. It’s especially useful for reporting on growth and surfacing insights for leadership.
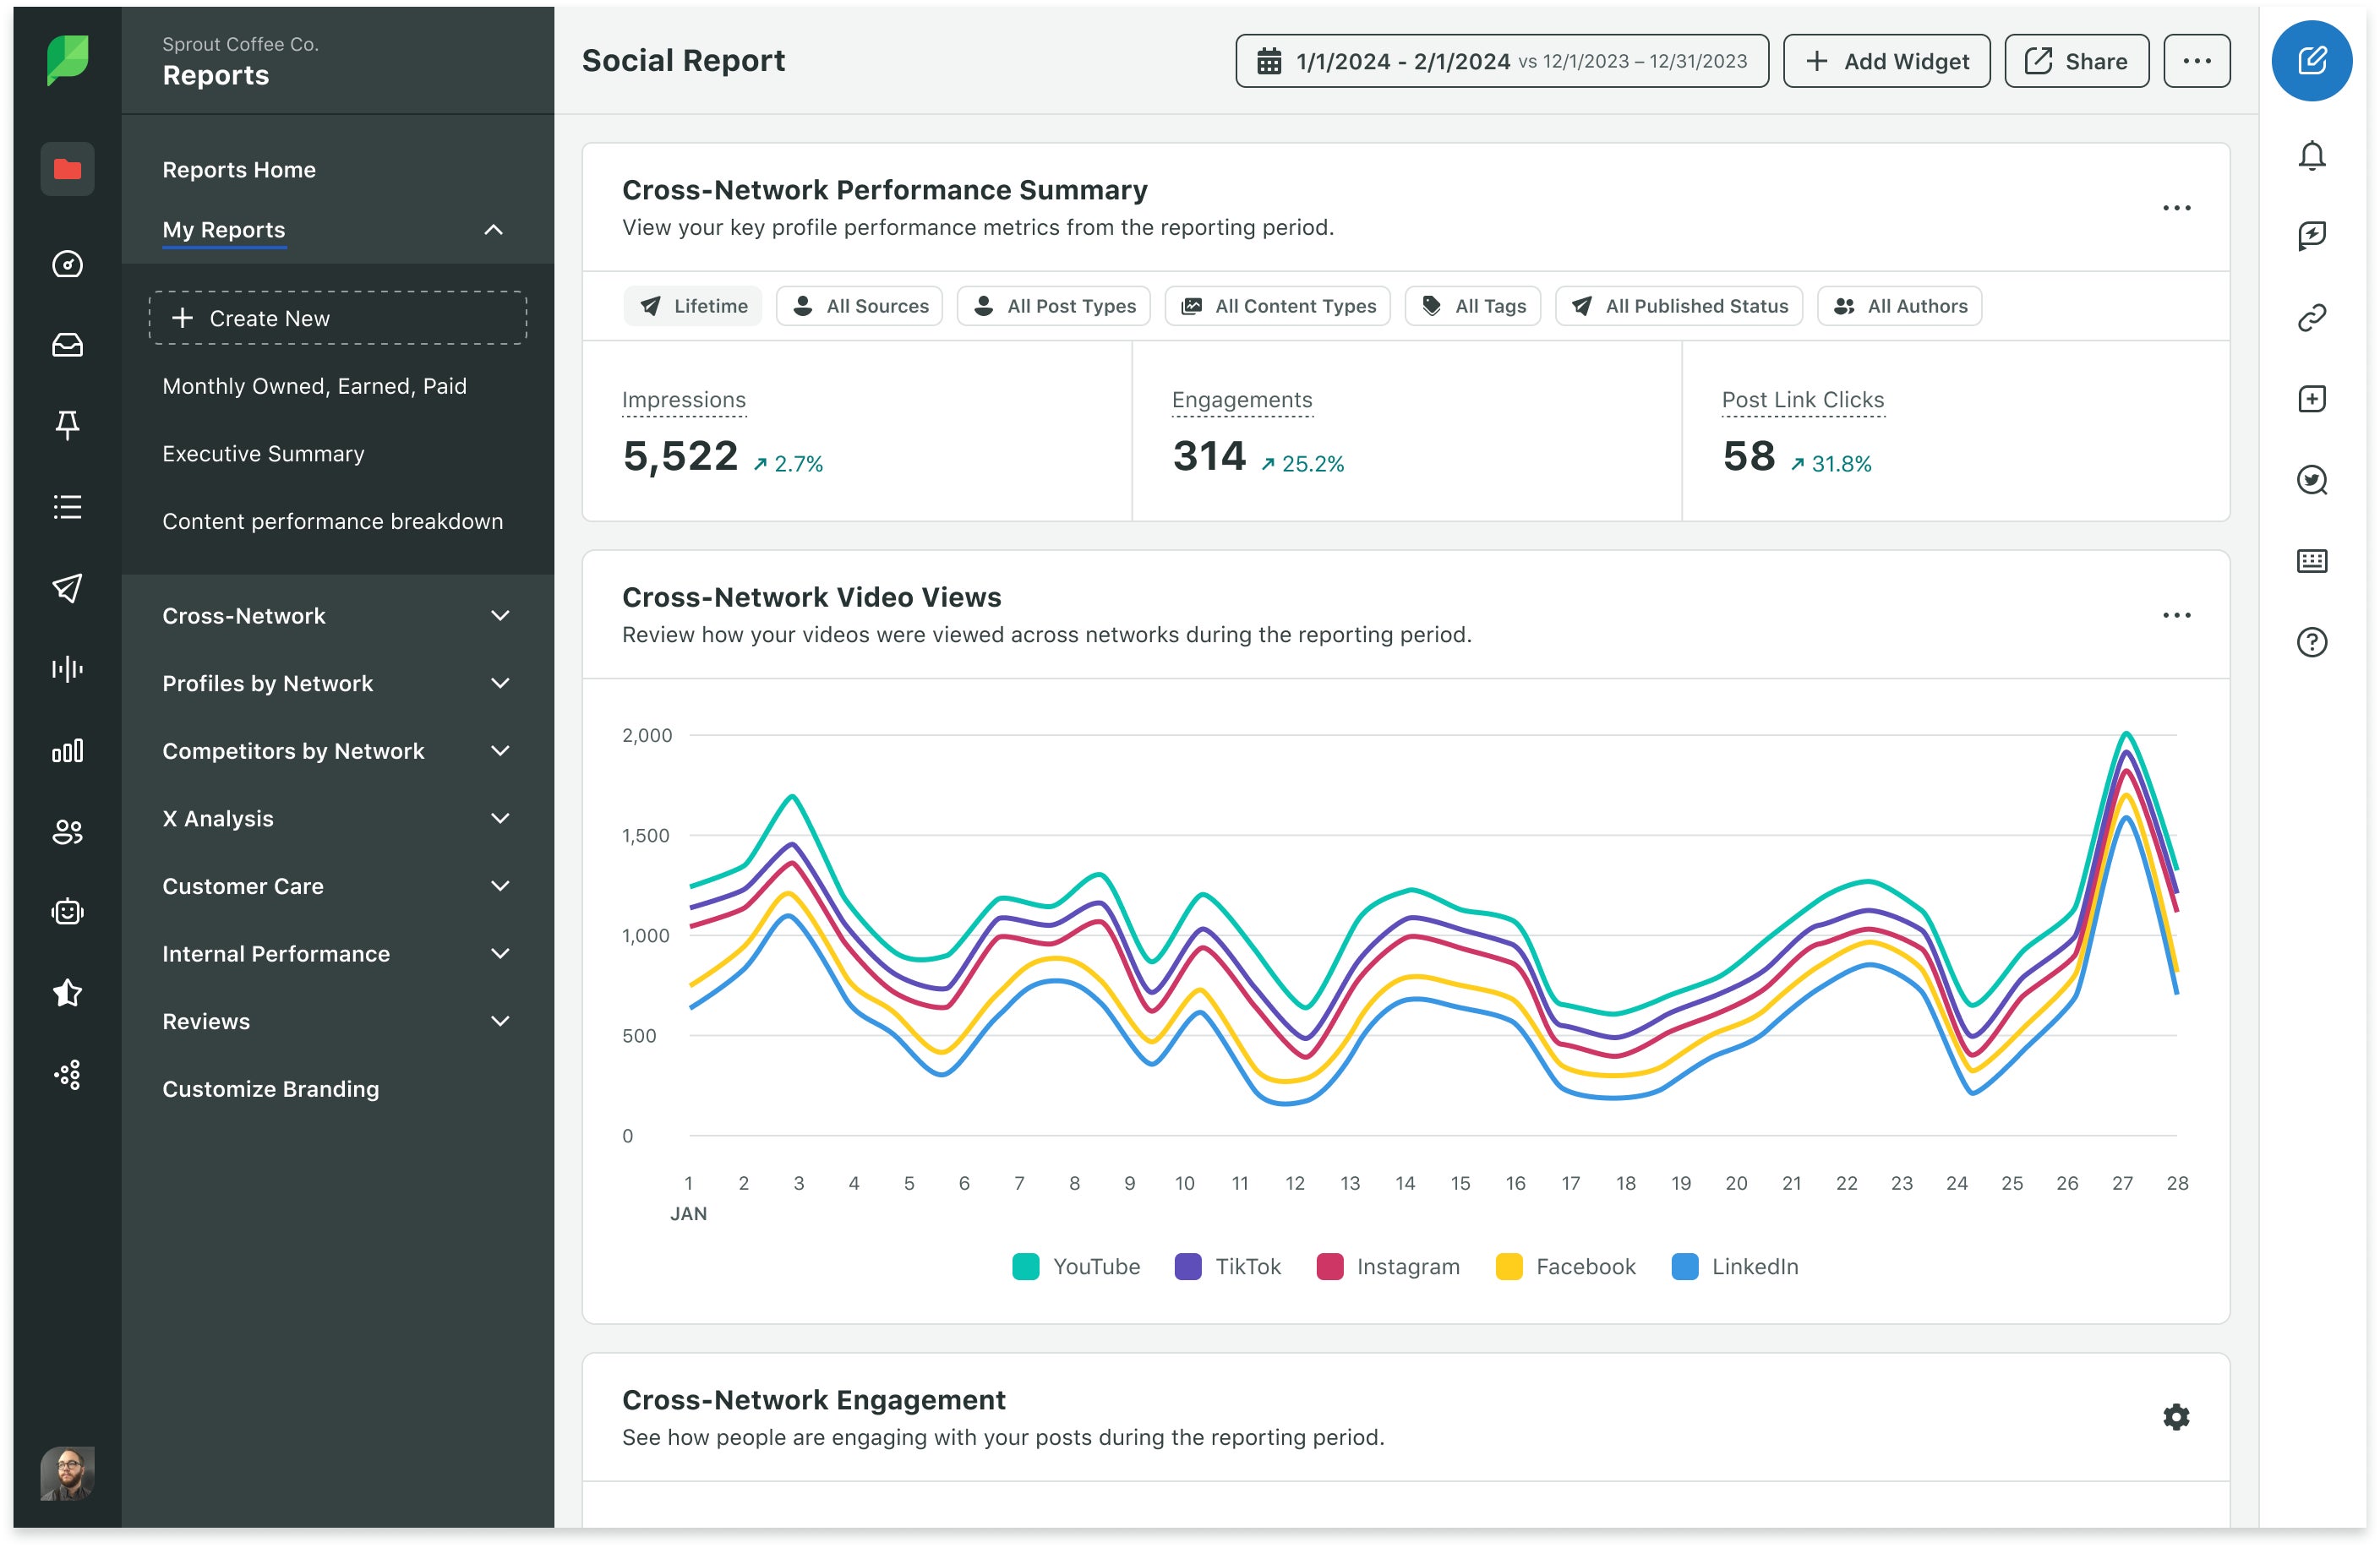
Profile Performance Report: Gain insights across all your social accounts
The Profile Performance Report brings your cross-network analytics into a single view so you can understand how YouTube fits into your entire social media ecosystem.
It aggregates total engagements across platforms and breaks out YouTube-specific actions such as likes, dislikes, comments, shares, annotation clicks, card interactions and new subscribers.
The report also shows how your videos contributed to cross-network video views and overall audience growth. While it doesn’t display impressions or post link clicks for YouTube, you can still compare publishing activity and subscriber gains across channels to evaluate YouTube’s contribution to larger brand objectives.
Post Performance Report: Dive into video performance
For a deep dive into individual content, the Post Performance Report offers a consolidated view of both publishing details and engagement metrics.
It shows how viewers interacted with each video, how those interactions compare to others in your library and which creative decisions—such as thumbnails or titles—may have influenced results.
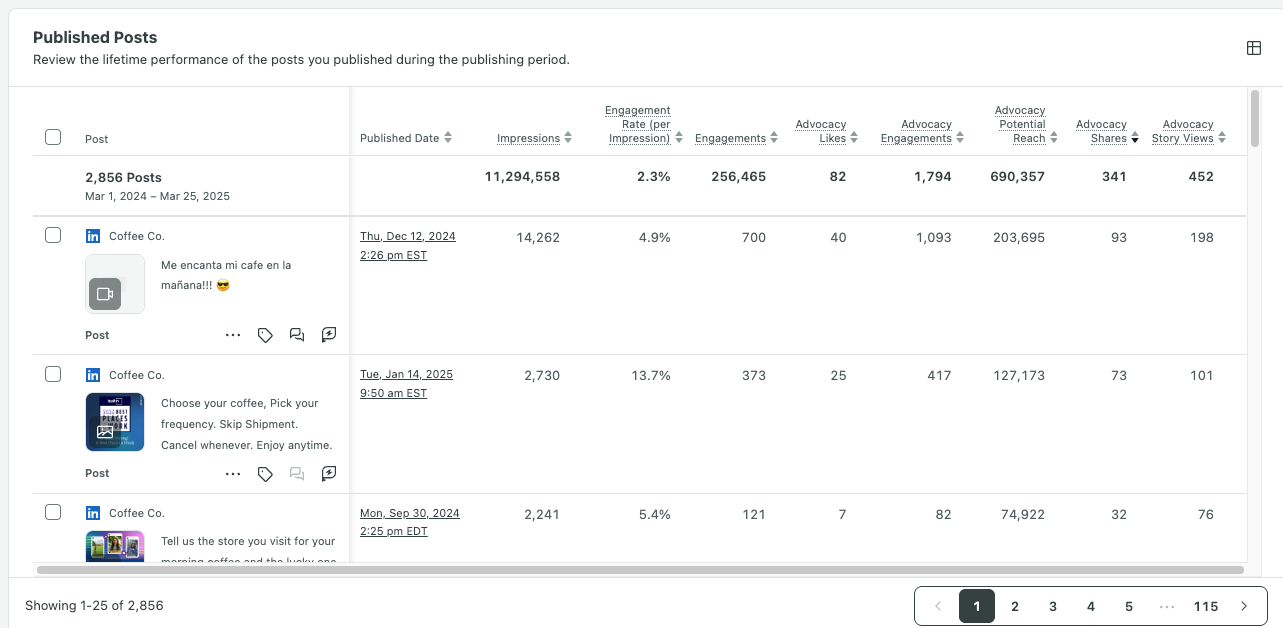
Because you pull all relevant data into one place, you can track performance without manually piecing together metrics from separate screens. This makes this report especially useful for understanding the “why” behind your top-performing uploads.
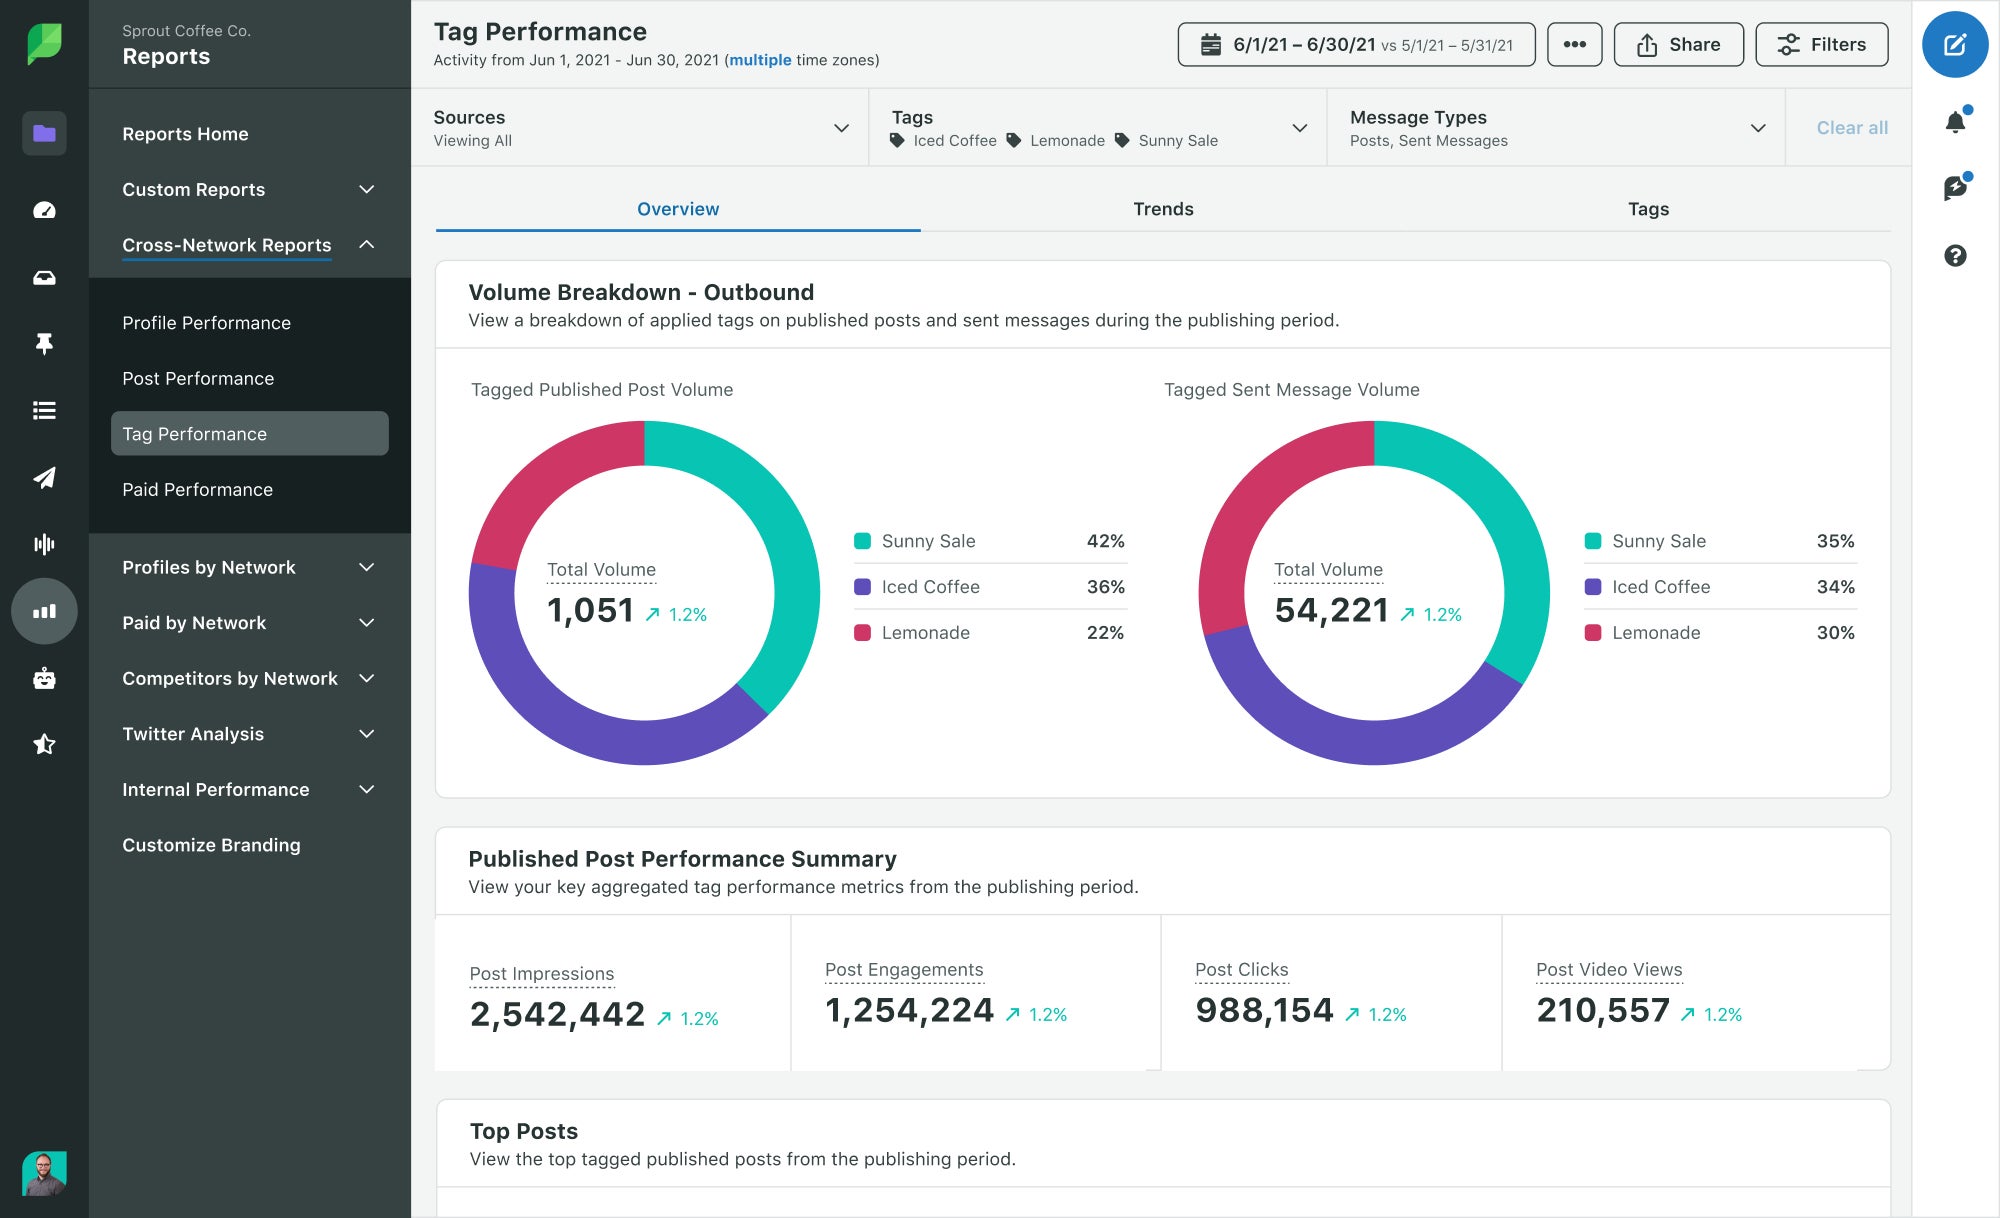
Tag Performance Report: Track results by campaign
Sprout’s Tagging capabilities turn your analytics into a truly strategic YouTube dashboard. Tags act as custom labels you attach to videos—such as campaigns, content pillars, product categories or publishing themes.
Once you apply tags, Sprout automatically organizes performance data by tag so you can see which initiatives are driving the strongest results.
This moves you beyond simply tracking what performed well to understanding why certain formats or topics consistently deliver impact.
For marketing teams, this is often the missing piece that transforms raw YouTube analytics into actionable strategy.
How to build a YouTube dashboard with Sprout Social
Building a strategic YouTube dashboard in Sprout is a straightforward process that gives you full control over your analytics.
Once connected to Sprout, your data is automatically organized into flexible reports you can customize for your team.
The entire workflow helps you move from monitoring metrics to understanding how your YouTube videos contribute to business results across your entire social media strategy.
Here’s the step-by-step process of setting up your YouTube dashboard in Sprout:
Step 1. Connect your YouTube channel
Integrating your YouTube channel with Sprout Social only takes a few minutes. This secure, one-time setup authorizes Sprout to pull your channel analytics, populate reports and manage publishing.
To connect your YouTube account to Sprout, go to Account and Settings in Sprout, then click Connect a Profile.
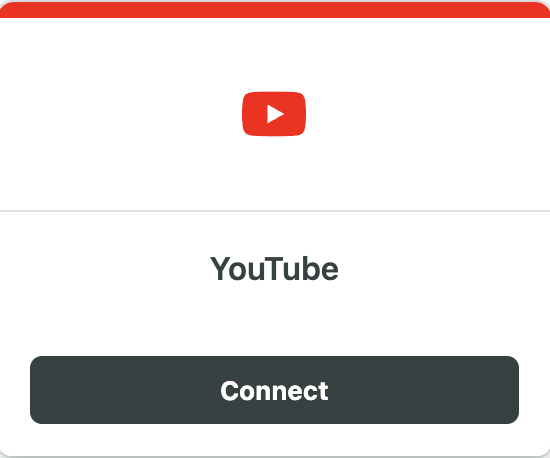
Once connected, your historical data begins to sync automatically. This gives your team access to a complete picture of video performance.
Step 2. Select your core YouTube reports
After your YouTube account is connected, Sprout generates your base YouTube reporting views immediately. Navigate to the Reports tab to access your Videos Report, Profile Performance Report and Post Performance Report.
Each report highlights different layers of insight—from high-level publishing trends to deep dives into individual video metrics. This ensures you start with a business-ready dashboard without building anything from scratch.
Step 3. Customize your reports with tags
Customization is where your YouTube dashboard becomes uniquely yours. Sprout’s filtering options enable you to segment your data by date ranges, visibility status, video types, post attributes and more.
Using Tags takes this further by transforming your analytics into a strategic storytelling tool. When you apply tags—like “Product Demo,” “Q4 Campaign,” “Event Recap,” “Playlist Series” or “How-to tutorial”—Sprout organizes your analytics around those themes.
This lets you understand which content pillars consistently perform well, which campaigns drove the strongest results and which videos contributed most to your KPIs. This replaces manual spreadsheet sorting with a dashboard that reflects exactly how your marketing team works.
Step 4. Build cross-network reports
To build a complete performance picture, add your YouTube analytics to Sprout’s cross-network reporting. This enables you to compare YouTube performance directly alongside Instagram Reels, TikTok videos, LinkedIn posts and other social media channels.
This enables you to create executive summaries, quarterly business reviews and cross-channel campaign reports from one place. The consolidated workflow makes it easier to present results to stakeholders, identify patterns across platforms and optimize your content strategy based on the full customer journey.
5 essential YouTube metrics to track in your dashboard
Once you centralize your YouTube analytics, you need to know which metrics reveal the most about your channel performance.
Each metric below influences how the YouTube algorithm surfaces your content, and each one gives you practical insights for optimizing your next upload.
Watch time and audience retention
Watch time shows how many total minutes viewers spend watching your content, while audience retention reveals exactly where viewers stay engaged and where they drop off.
These two metrics work together to highlight how compelling your video structure is.
For example, if you see a steep decline at the 30-second mark, treat it as a signal to tighten your intro or adjust your pacing. A smooth retention curve often means your video delivers what the viewer expects from the title and thumbnail.
Traffic sources
Traffic sources tell you how viewers find your videos, whether through YouTube Search, Suggested Videos, external websites or direct links.
This metric shows whether your content is discoverable, recommended or primarily driven by off-platform promotion.
When YouTube Search is one of your top sources, it means your keyword strategy is strong and worth doubling down on. A high percentage of Suggested Videos usually means your content keeps viewers on the network, making it easier for the algorithm to recommend your uploads more often.
Subscriber growth rate
Subscriber growth shows how effectively your videos convert casual viewers into long-term followers.
Instead of looking only at total subscribers, this metric highlights which specific videos drove the strongest growth.
For example, if a particular tutorial drove a noticeable subscriber spike, consider expanding that playlist or building similar content.
Engagement rate
Engagement rate measures how actively your audience interacts with your content through comments, likes and shares. These engagement metrics reveal how viewers feel about your videos and whether your message resonates.
Comments in particular give you direct access to audience sentiment and questions, offering insights you can use to refine your storytelling or identify new content opportunities.
Sprout’s Smart Inbox enables you to track, filter and respond to YouTube comments in one place, ensuring you maintain consistent engagement across your channel without needing to toggle between tabs in the YouTube Studio dashboard.
Click-through rate (CTR)
CTR shows how effectively your titles and thumbnails convince viewers to click, making it one of the most important signals in the YouTube algorithm.
A low CTR paired with strong watch time often means the content itself is strong, but the packaging needs refinement.
If viewers click but quickly leave, your thumbnail or title might be promising something different than the video delivers.
Treat CTR as a guide for A/B tests to better understand what sparks curiosity.
Go beyond data to drive your YouTube strategy
A successful YouTube strategy goes beyond checking metrics inside YouTube Studio. The native dashboard gives you essential data, but a unified platform like Sprout Social turns that data into a cross-channel strategy you can act on.
When your YouTube analytics sit alongside insights from Instagram, TikTok, LinkedIn and other social media channels, you eliminate silos, support smoother team collaboration and build business-ready reports with tags, filters and flexible views.
Ready to create a YouTube dashboard that helps your team make smarter decisions? Start your free trial of Sprout Social.
37 free social media strategy templates that will elevate your workflows
Published on December 5, 2025 Reading time 15 minutes

Share