Twitter metrics: How & why you should track them

Written by Jenn Chen
Published on September 14, 2021
Reading time 7 minutes

First introduced as a micro-blogging platform, Twitter (rebranded as “X”) has evolved into a multi-faceted social network. It’s become a breaking news source, a customer service channel and a networking site. For companies, having a Twitter presence means you’re able to connect one-on-one with your customers while also increasing your brand recognition.
Twitter’s statistics are impressive:
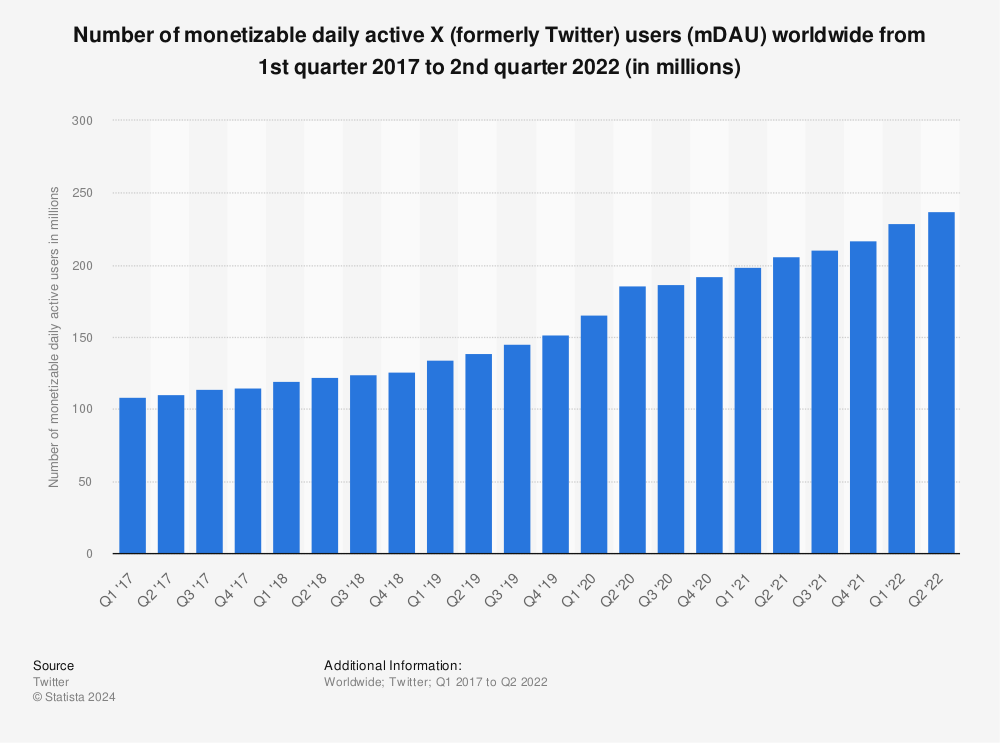
- 206 million monetizable daily active users in Q2 2021. This number has been steadily increasing over the years.
- The US has the most users at 73 million. Japan is the next highest at 55.55 million users.
- The 2021 Sprout Social Index™ revealed that 30% of consumers want brands to use Twitter more and 52% of marketers currently use Twitter.

Keeping all this in mind and knowing that your company will be using Twitter as a marketing platform, it’s important to note down which metrics to track. Understanding Twitter metrics and being able to make sense of analytics are vital to ensuring the success of your social media marketing strategy.
So, what are Twitter metrics, why should you measure them and which ones should you track?
What are Twitter metrics & why should you measure them?
Twitter metrics are data points that you track to determine your success on the network.. These metrics are found in your Twitter analytics. Metrics by themselves don’t mean anything since the benchmarks for success for an account can vary based on factors like industry niche or business size. Your Twitter metrics need to be analyzed for a specific purpose, like seeing if you met your social media goals or understanding if an ad campaign succeeded.
Metrics provide you with the data you need for a number of different areas:
- To know when to post for the most engagement
- To understand your brand’s share of voice
- To see how effective and responsive your customer care team is
- To run a competitor analysis
- To adjust your approach on marketing campaigns
Oftentimes, multiple metrics are used together since relying on a single metric to determine a goal’s success doesn’t give the full picture.
Let’s take a look at the top Twitter metrics to track.
Twitter metrics to track
Twitter metrics fall into a few categories. There are Tweet-level metrics that solely look at the performance of Tweets you post. These include metrics like Top Tweet and Link Clicks. Then there are profile-level metrics that analyze your account as a whole. These include metrics like Profile Clicks and Demographics. Then there are advertising metrics that analyze how your paid campaigns are performing.
All of these metrics can be found either in your Sprout Twitter Analytics Reports or in your account’s Twitter Dashboard.
Top Tweet
What it measures: The Tweet with most impressions or engagements over a given amount of time.
Why track? It’s important to know which of your Tweets have been high performers so you can start to analyze any trends among your other top Tweets. If you run Twitter ads, the top Tweet is oftentimes a good one to promote.

How to track: In the Twitter Dashboard, the Top Tweet by impressions over 28 days is identified on the home page. In Sprout, the top three Tweets by lifetime engagements are in your Twitter Profiles Report.
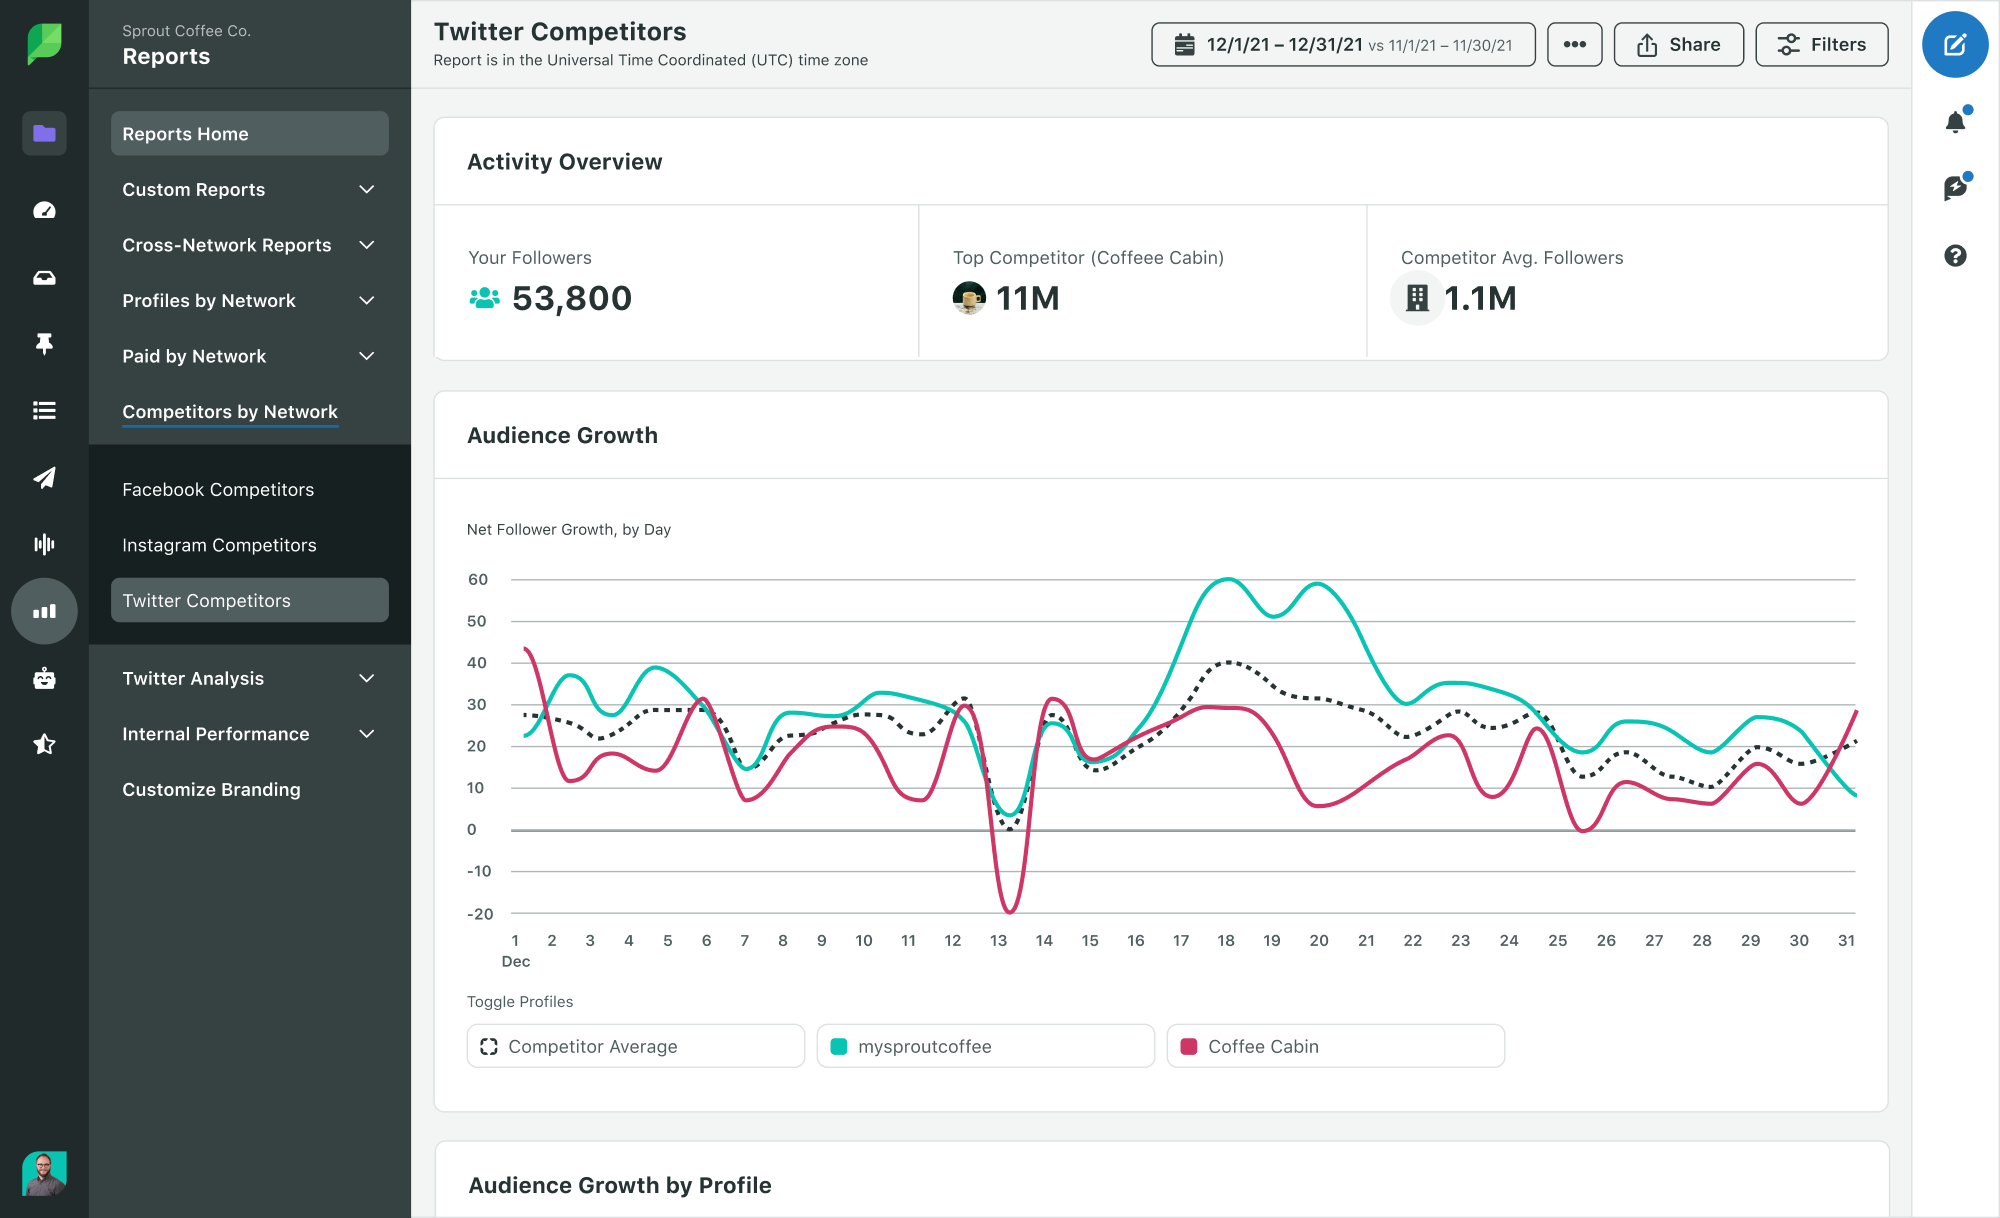
New followers
What it measures: The number of new followers you’ve gained over the course of time, usually by the month.
Why track? Likes are nice but follows are even better. New followers mean that audiences think your profile is important or interesting enough to watch and regularly get your content in their feeds. This is a useful metric for brand awareness and growing your audience. Conversely, if the number drops, you might need to investigate further to see what the causes were.
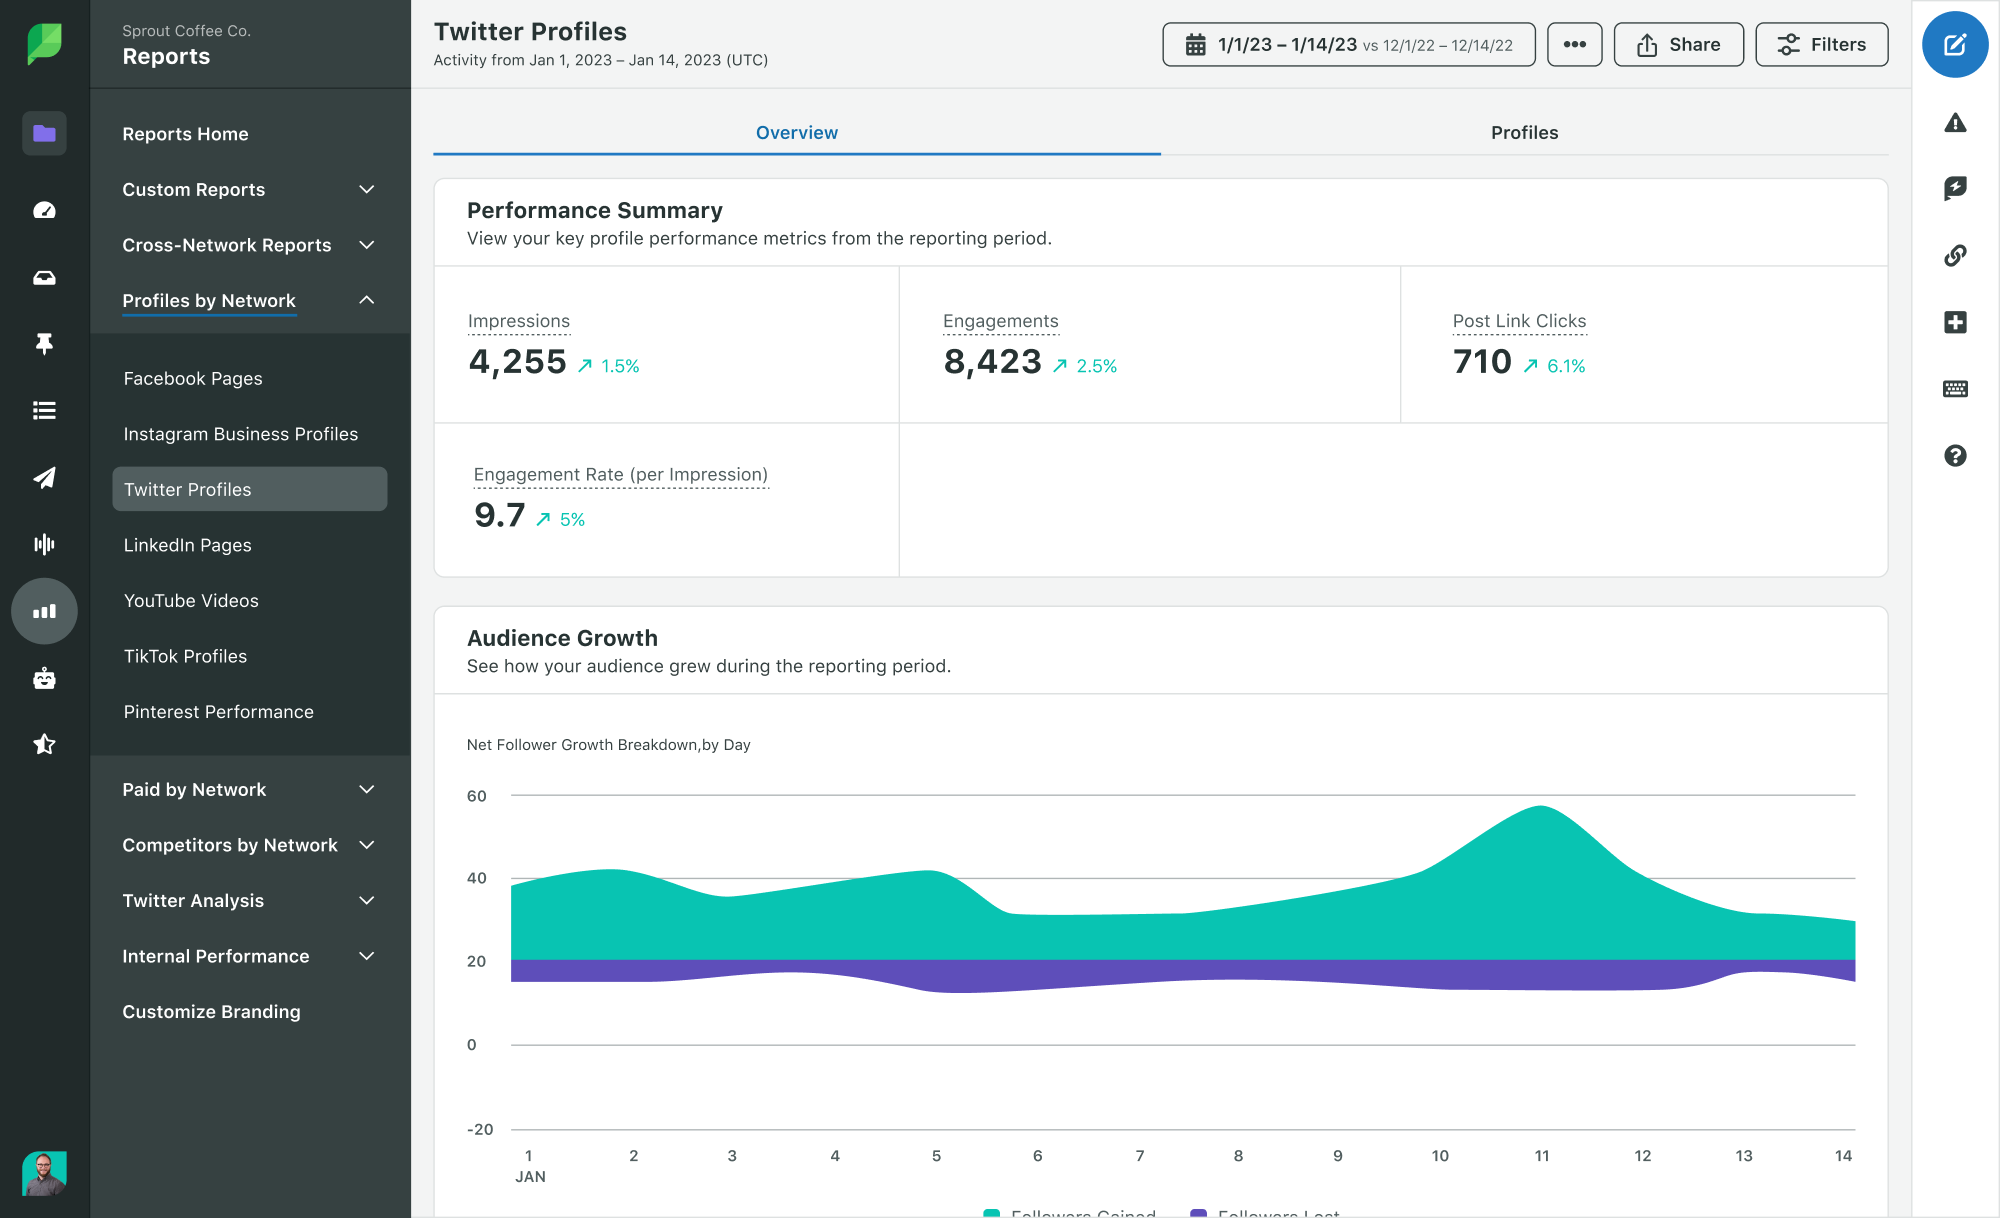
How to track: Subtract the number of followers at the beginning of a time period from the end of the time period. Another way to identify this metric is to call it net follower growth, as seen in the Sprout report above.
Top follower
What it measures: The Twitter account with the largest amount of followers that followed you in that month.

Why track? It’s good to know which of your newest followers are the ones with potentially the highest reach impact. Some accounts use this metric to thank the new follower with an @mention. They might also be a good candidate for future influencer campaigns.
How to track: The top follower is identified on your Twitter Dashboard’s home page.
Top mentions
What it measures: These are the Tweets that mentioned you that also received the most engagements. This metric covers other profiles’ Tweets that mention you.
Why track? If you haven’t already engaged with the Tweet, it’s time to do so. This Tweet – positive or negative – increased your brand’s visibility with that account’s audience.
How to track: Similar to top follower, the top mention is available on your Twitter Dashboard’s home page.
Impressions
What it measures: Impressions are the number of times your Tweets have been organically seen by other users during a reporting period. This includes Retweets and Quote Tweets when they’re performed by others. Impressions can be tracked at both the individual Tweet level and at the overall account level.
Why track? Impressions tell you how popular a Tweet has the potential to be. While it doesn’t tell you the unique account numbers (reach) that saw the Tweet, it does identify Tweets that have gone far across multiple feeds. It’s one of the metrics that’s often used to measure brand awareness.

How to track: Open up a Tweet to view the individual stats. This is available natively in your regular post stream or in your Twitter Dashboard. Total Tweet impressions are available in this dashboard and in Sprout’s Twitter Profiles Report.
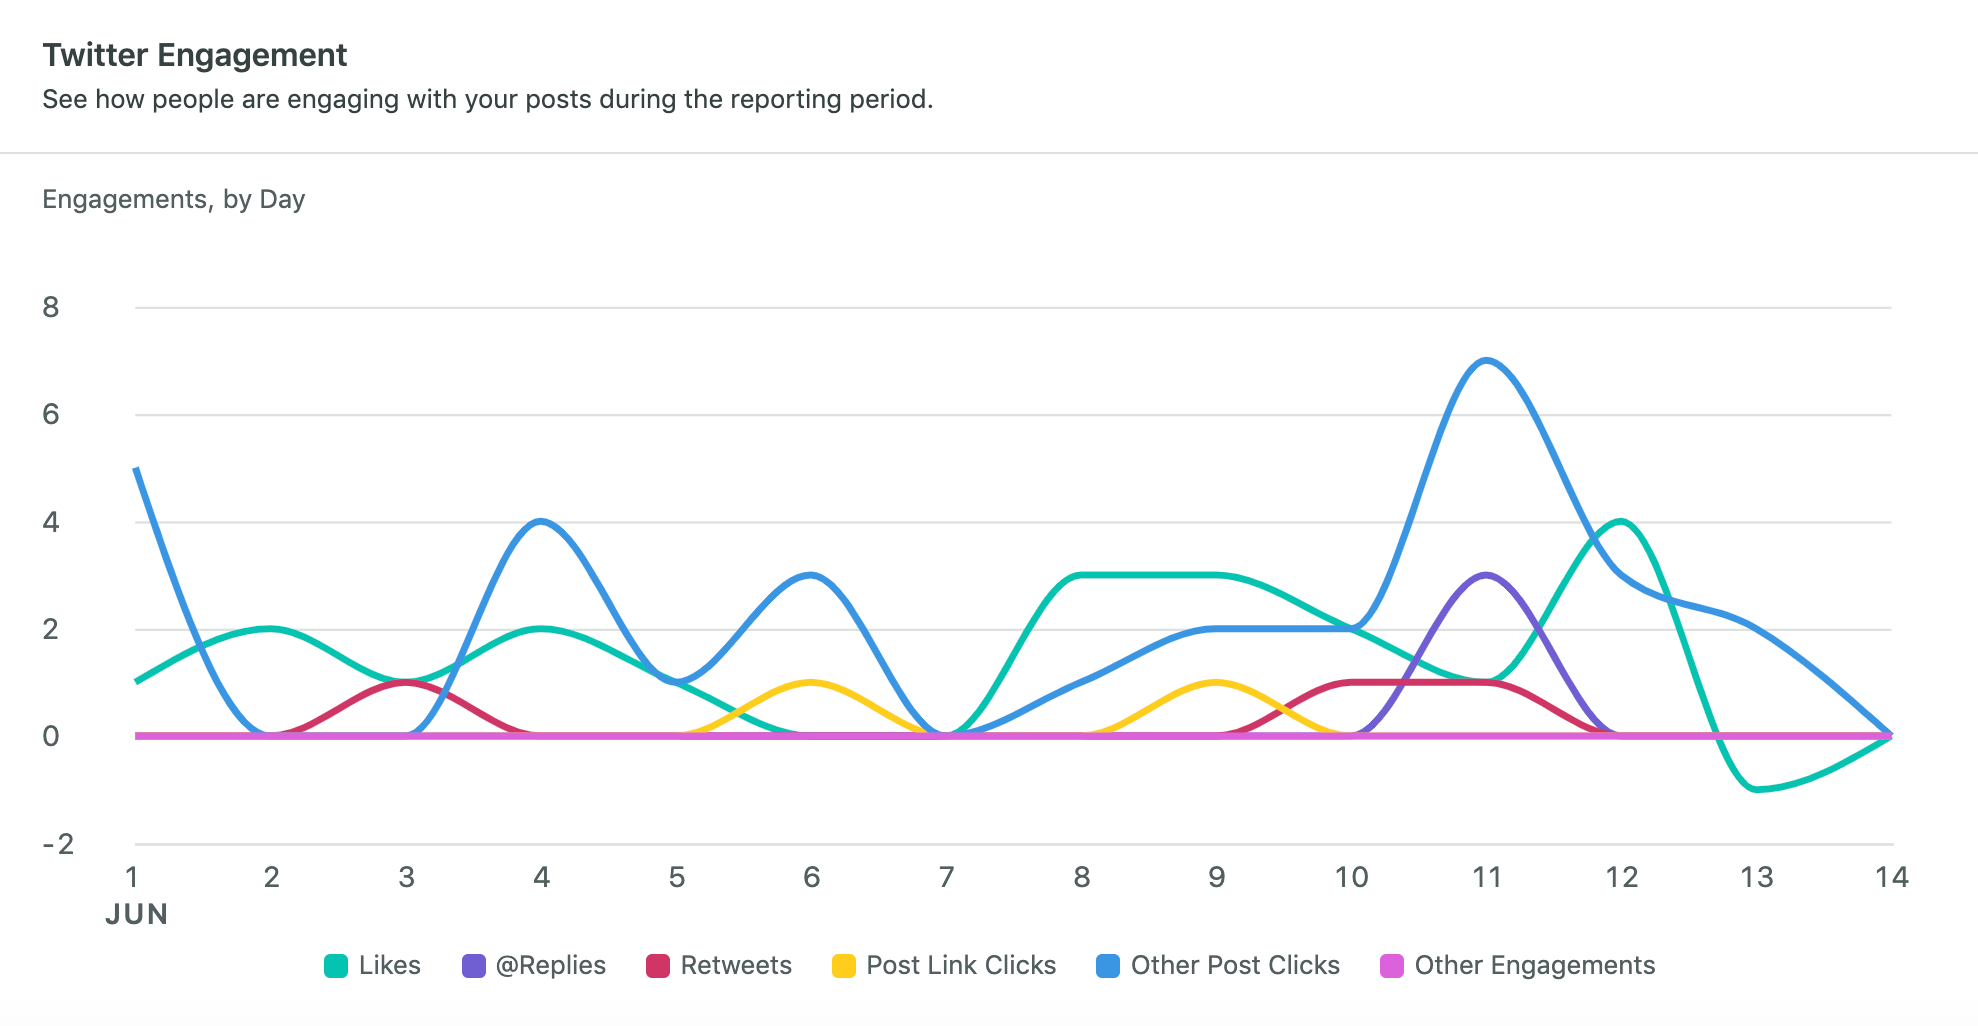
Engagements
What it measures: Engagements measure the number of interactions made with a Tweet. This is given at both the single Tweet level and the total activity level of all Tweets. Engagement includes all the ways that someone could interact with your Tweet, including: media expands, likes, @replies, retweets, follows from a Tweet, link clicks and more. Twitter provides a list of the different engagements they track and their definitions.

Why track? When someone pauses for even the briefest moment to interact with your Tweet, it’s because they found something about it interesting. And while not all engagements are good (for example, you went viral but for the wrong reasons), it’s helpful to know what kind of Tweets are working out for you. The metric is used for goals like brand engagement and community engagement.
How to track: Like impressions, Tweet-level engagements are found through your native Tweet stream and totaled numbers are found in both the Twitter Dashboard and your Sprout reports.
Engagement rate
What it measures: The average number of engagements per impression or follower, depending on how you define it.
Why track? Engagement rate gives you a better picture of how a Tweet or general account is performing than either impressions or engagements alone. A high engagement rate means the Tweet sparked conversation or opinion. But a low one doesn’t mean it was terrible, either. If it was an informative news article with high impressions and a low engagement rate, it means it was information worth sharing, no commentary needed.
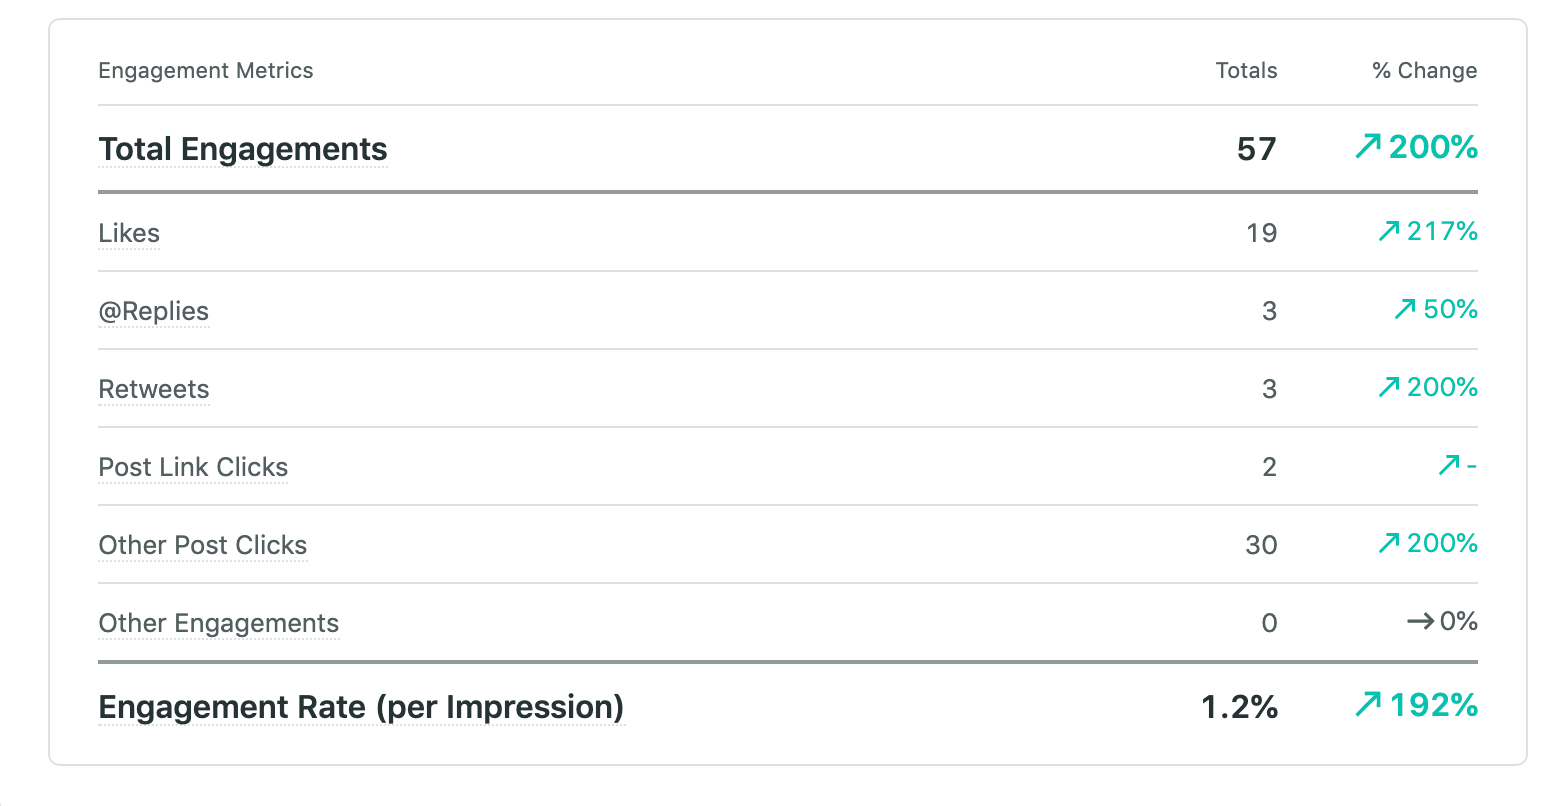
How to track: Divide the number of engagements by the number of impressions to get this metric. This is readily available in your Sprout Twitter Profiles Report, which lists the engagement rate per post as well as across Tweets within a time period.
Link clicks
What it measures: The number of times someone clicked on a link inside your post.
Why track? Demonstrates how interesting your audience finds your links. You can also use it as a measure of different caption or headline styles if you’re sharing the same link but switching up the copy.
How to track: This is listed in your Tweet dashboard at both the Tweet level as an engagement type and the total level. It’s also available in the Sprout Twitter Profiles Report.
Profile clicks
What it measures: The number of times someone clicked on an account’s name, username or profile photo.
Why track? Profile clicks indicate someone’s interest in learning more about you, which is usually a good thing. If they like what they see, they become a new follower.
How to track: In your Twitter Dashboard, you can see profile clicks at the Tweet level if you view individual post activity or as a totaled amount on the homepage.
Cost per result (CPR)
What it measures: The average cost of each relevant action that a user takes on one of your ads. This is a metric specific to Twitter advertising.
Why track? Whenever you set up a Twitter advertising campaign, it’s necessary to know what metrics define campaign success. A high CPR for an ad that should not have one means you can tweak the campaign in real-time instead of sinking more money into it.
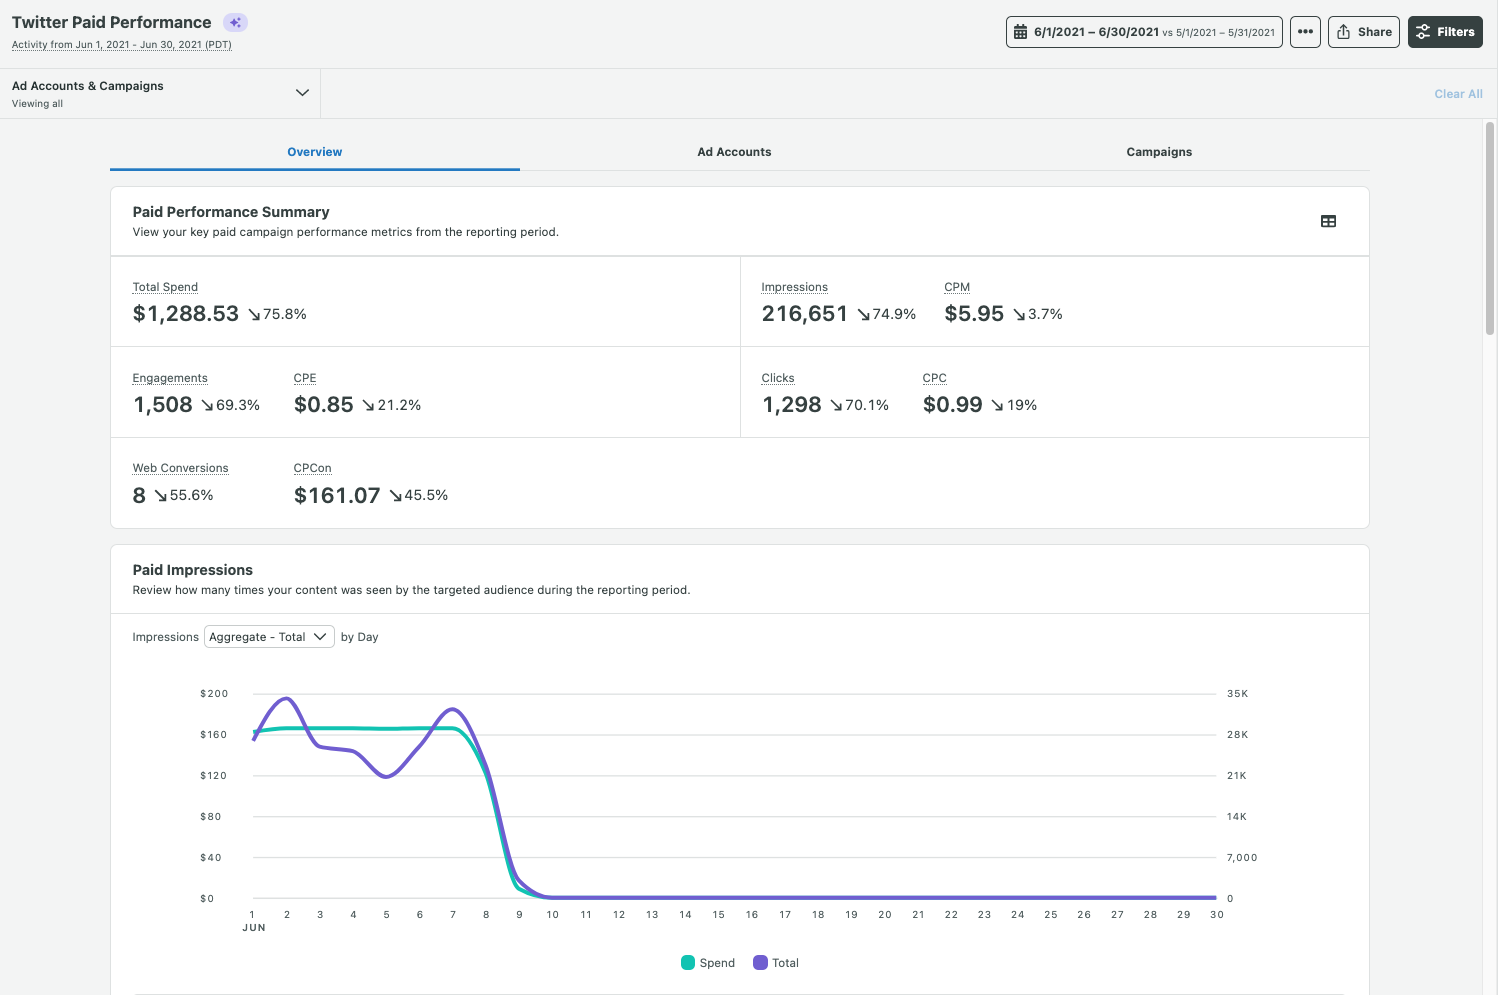
How to track: CPR is available in your Twitter Ads center per campaign and in your Sprout Twitter Paid Performance Report.
Using Sprout Social & other tools to track Twitter metrics
Sprout Social offers robust reporting for Twitter profiles. Besides tracking most of the important metrics listed above, you also receive the reports in a presentation-ready format. Use Sprout’s Report Builder (available as a part of Premium Analytics) to build custom reports to compare paid and owned media, add context to a campaign report and include additional metrics to showcase ROI.
In addition to your overall profile report, Sprout also offers Twitter reports to analyze trends, your competitors, brand keywords and bots you created. These reports help you better understand what’s capturing your audience’s interest and refine your strategies for the future.
Using time-saving features like the all-in-one Smart Inbox, Inbox Activity Report and calendar scheduling in Sprout can serve as a detailed Twitter dashboard that provides all the insight and analytics you need.
While it offers fewer all-in-one features, the native Twitter Dashboard is free and available to anyone with a Twitter account. It gives limited data and graphs but is a good place to start if you’re just dipping your toes into the Twitter analytics waters. In addition to these two options, other Twitter analytics tools are available to support your data needs.
Start tracking your Twitter metrics today
By now, you should understand how important it is to track your Twitter metrics. Metrics have a wide variety of uses and span across company departments. They help you understand if you’re reaching company goals or if your brand is performing well.
We listed the most important Twitter metrics to track here but there are always more to include, especially if you are using Twitter Ads as part of your Twitter marketing strategy. There are many benefits that Twitter offers to businesses.
Set up your own Twitter dashboard today with a free Sprout Social trial.
Use of Twitter nomenclature across Sprout refers to newly rebranded X platform and related terminology.

Share