
X (Twitter) Analytics
X (Twitter) analytics: How to view insights and improve your data
Want to make the most of X (formerly Twitter)? This guide shows you how to turn platform analytics into actionable insights that boost reach and engagement. Learn which metrics matter, how to interpret them, and get a free template to track your performance with ease.
Reading time 11 minutes
Published on March 10, 2026
Table of Contents
Summary
- X analytics offers valuable insights into post performance, engagement and profile growth. Users can assess and refine their marketing strategies.
- Accessible via the native X analytics dashboard on desktop, users can track key metrics including impressions, engagements, link clicks and follower growth. You can view individual post performance via mobile.
- For a range of professionals including social practitioners, managers and agencies, X analytics is vital for optimizing content and understanding audience behavior. Tools like Sprout Social can enhance X data interpretation and strategic planning.
When X (formerly Twitter) rebranded, the platform kept its role as one of the internet’s fastest-moving conversation hubs. News, trends and brand moments often unfold on X first, making it a critical network for real-time engagement.
X is still where people talk trends, rally around brands and shape future thinking. For marketers, it’s a powerful space to reach and engage an active audience.
If X is part of your marketing strategy, you need to know how it works. That’s where social media analytics come in—specifically X analytics. From tweet impressions to new followers, X’s native analytics dashboard measures performance and guides smarter, more data-driven decisions.
Here’s how to get the most out of your analytics.
What is X (Twitter) analytics?
X Analytics is X’s native analytics dashboard. It shows you key metrics that help you determine how your posts perform and how your audience responds. You can use X Analytics to track and measure follower count, impressions, engagement, reposts, replies and more. Your native X Analytics dashboard also shows you these key metrics so you can visualize patterns in performance.
X’s analytics data gives you concrete evidence of how people interact with your content. When you use this data to figure out which posts spark engagement and for whom, you remove the guesswork from your Twitter strategy. Instead, you can fine-tune each post to encourage meaningful actions that directly impact your bottom line.
Ready to turn these insights into powerful strategies and boost your performance?
How to check X (Twitter) analytics
Access to X analytics depends on your account type and the features available in your region. In most cases, you can access post-level analytics directly from your posts, while broader account analytics may require upgraded account features.
Because X continues to evolve its feature set, analytics access and dashboard functionality may change over time.
You can access the dashboard directly from https://x.com/i/account_analytics. Or follow these steps to see your X analytics.
How to check Twitter analytics on desktop
1. From your homepage, click the Premium button on the left-hand panel. Click Analytics in the Quick Access section.
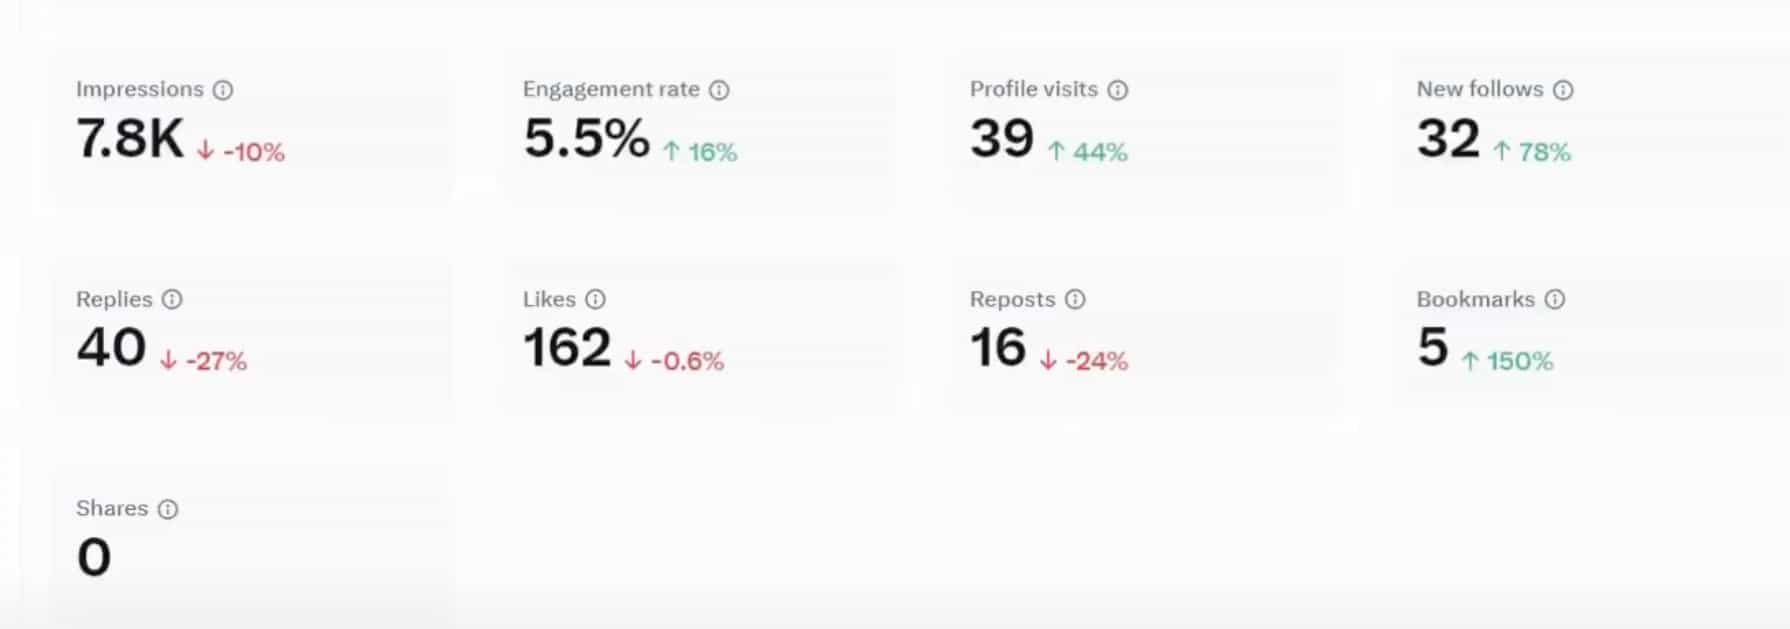
2. From here, you’ll see an account overview featuring key metrics including impressions, engagement rate, profile visits, new followers and other metrics. You can view data from the past seven days, 28 days, three months or year.
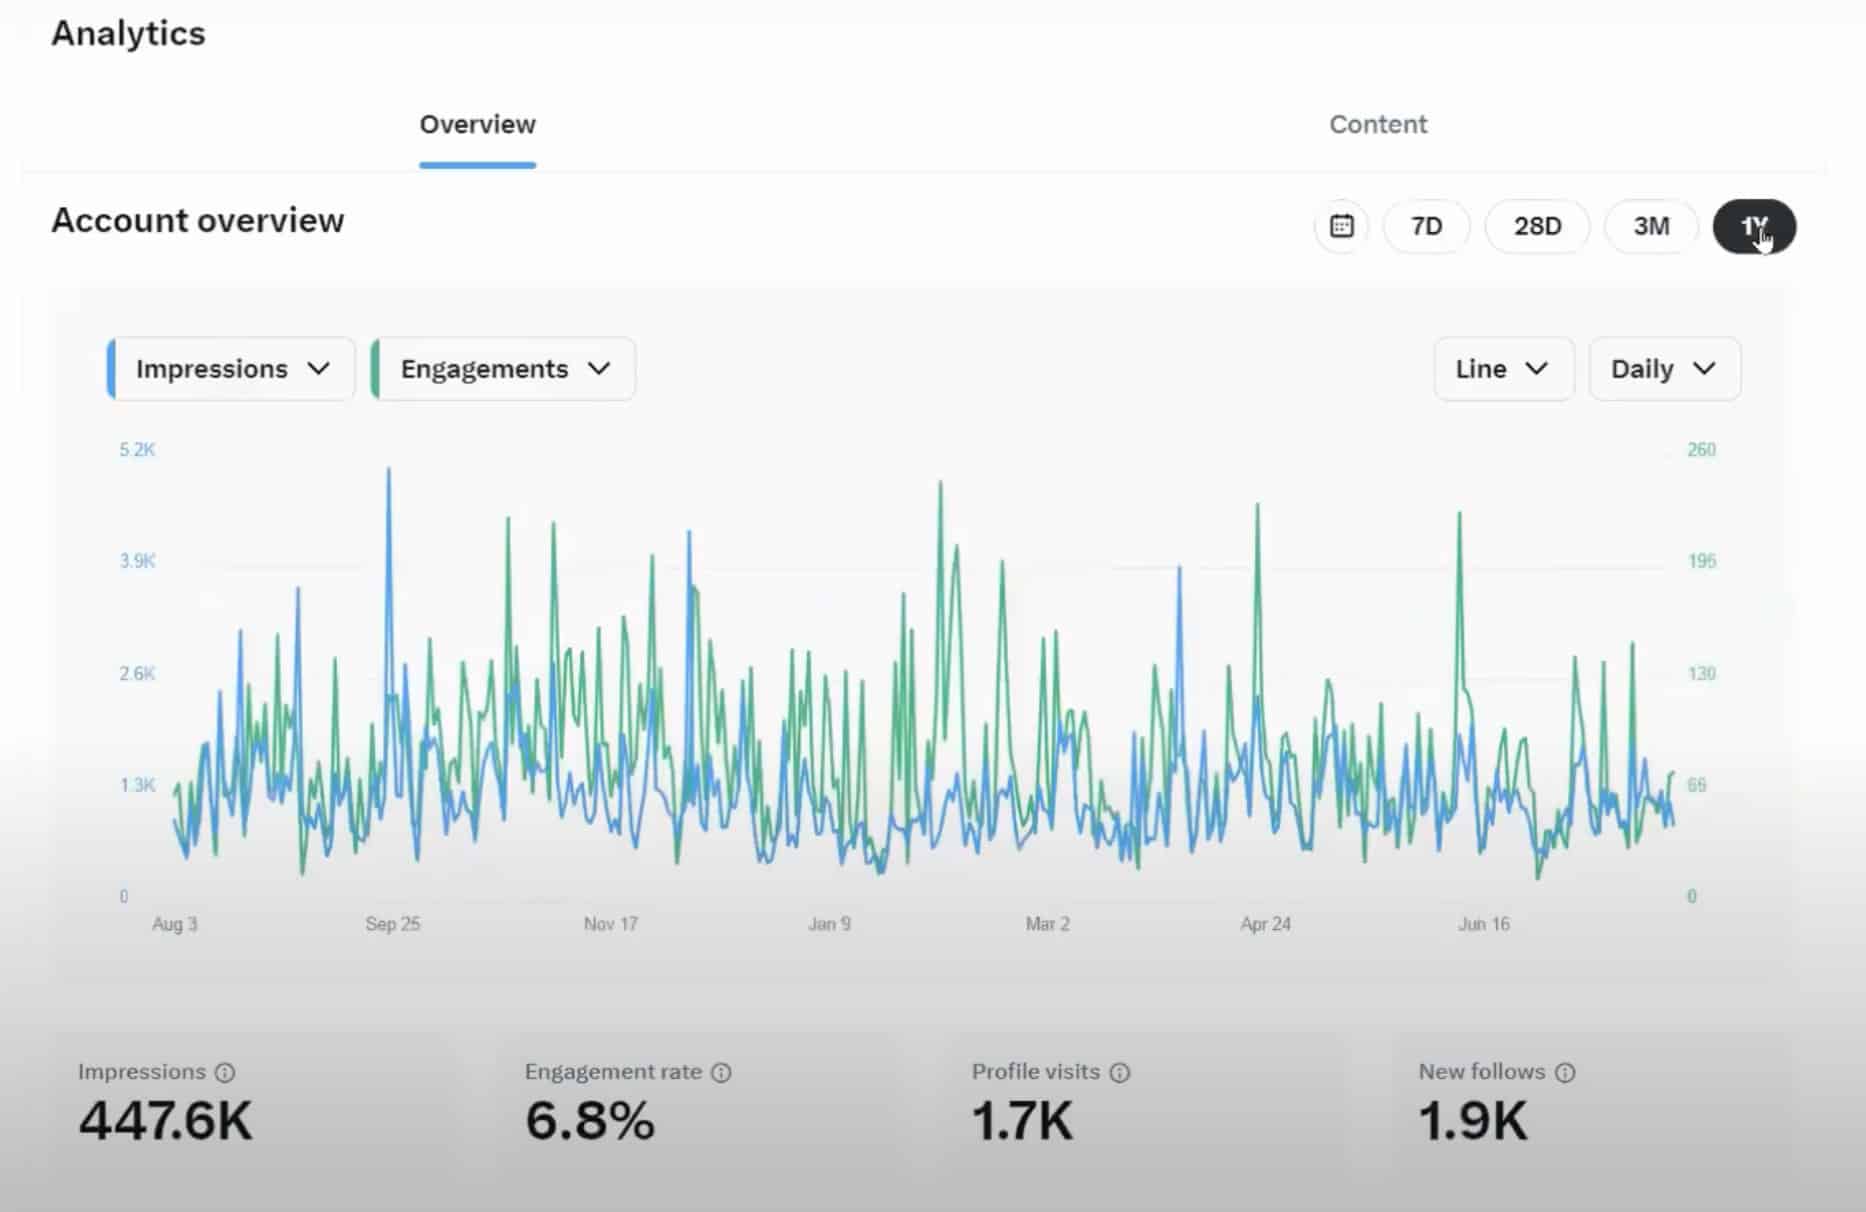
If you scroll down, you’ll see specific data points for various metrics.
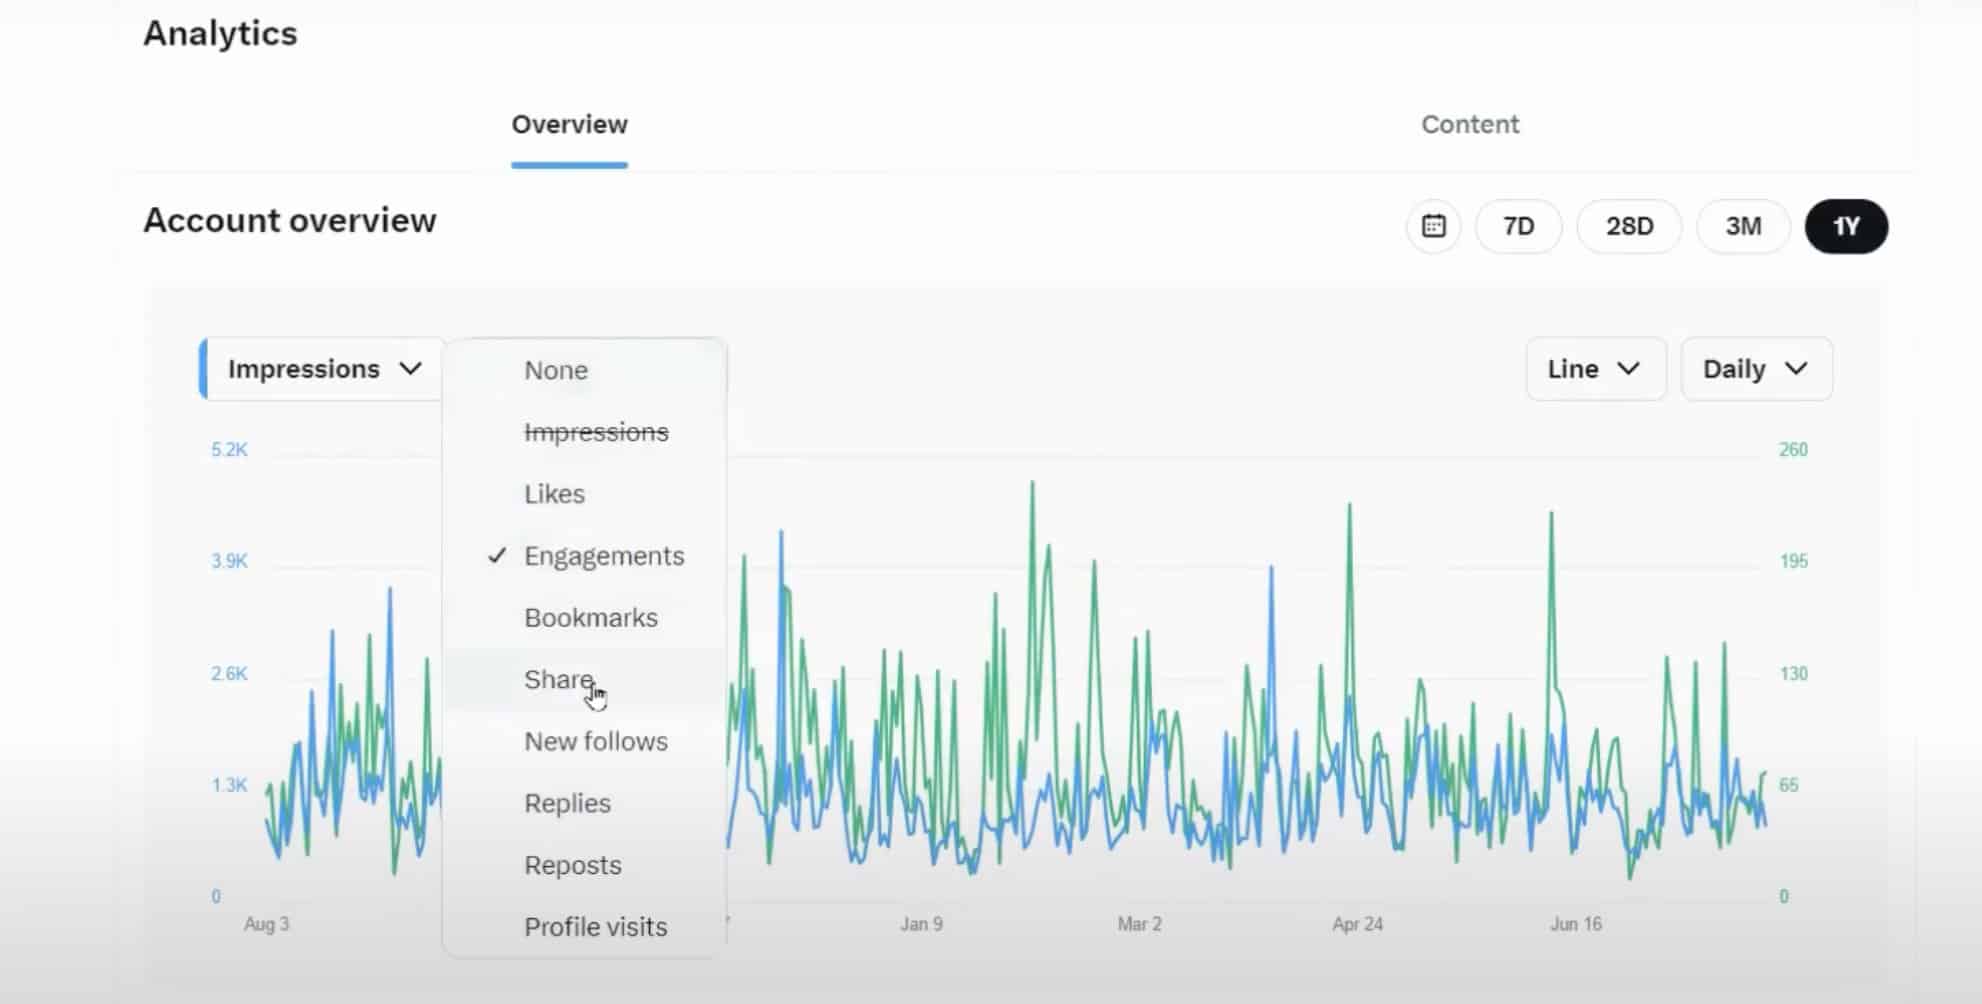
3. Use the green and blue drop-down menus on the left under Account Overview to toggle between different metrics such as likes, bookmarks and replies. You’ll see a line graph comparing these metrics over a chosen time period.
4. Use the dropdown menus on the right to toggle to a bar graph.
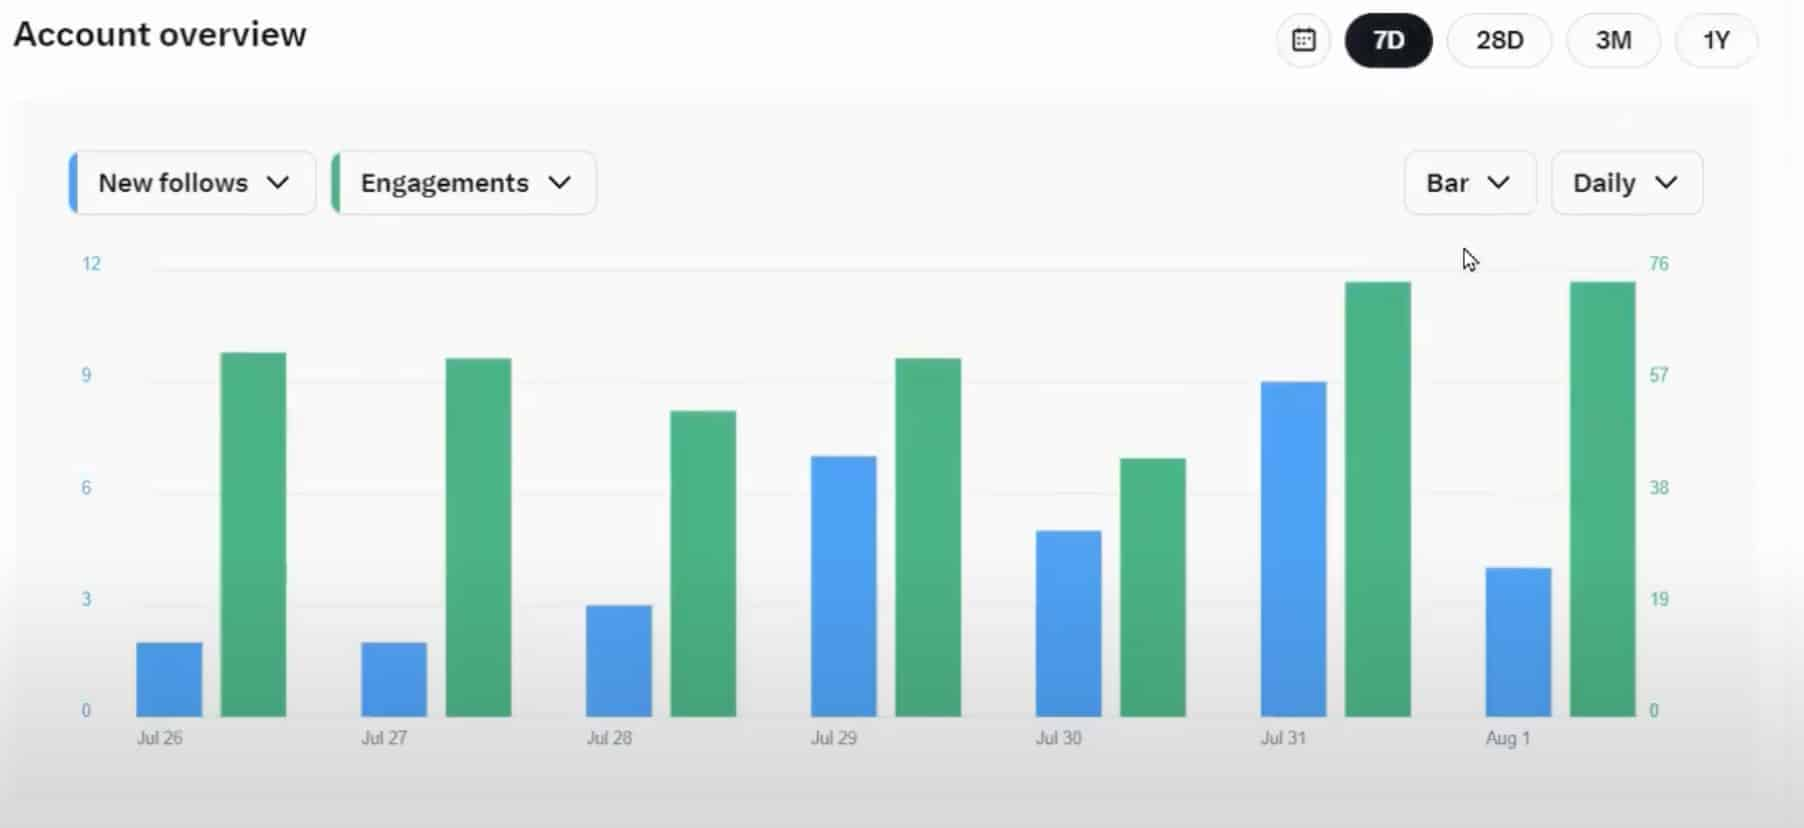
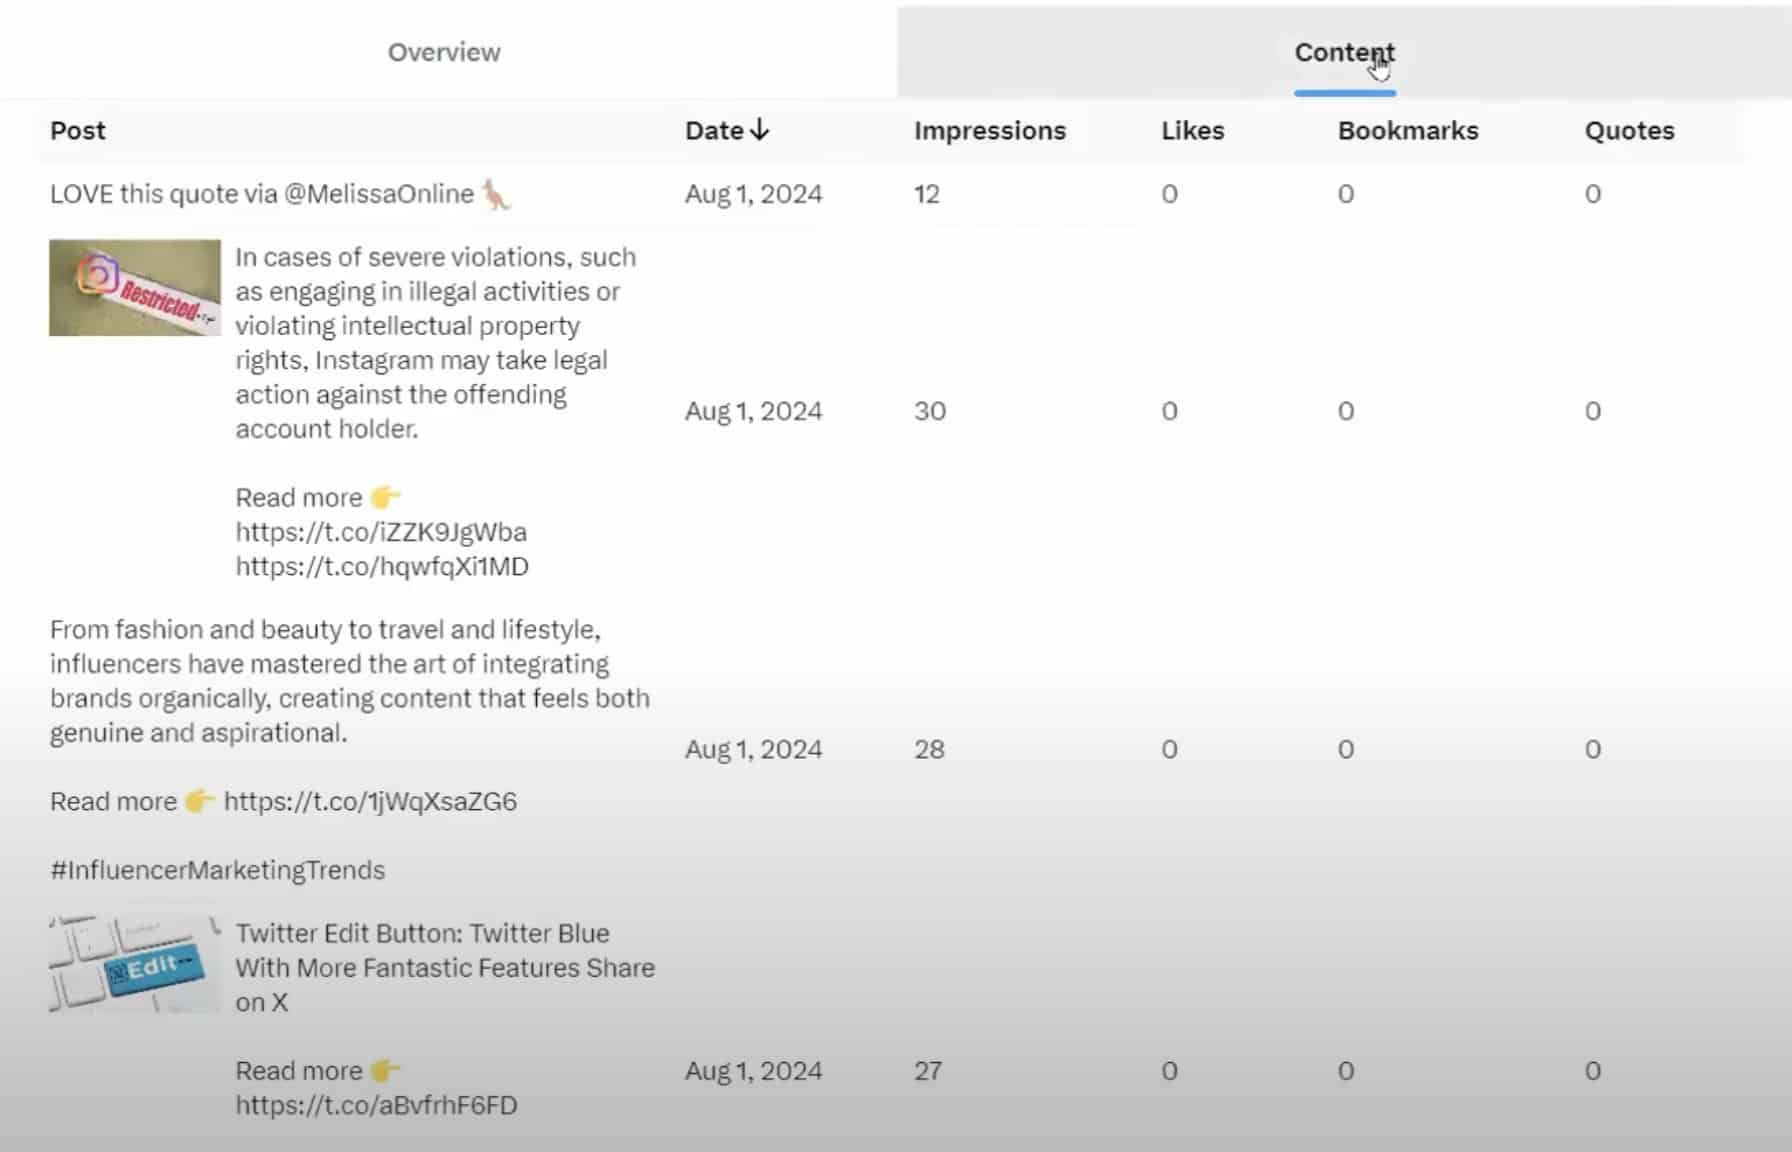
5. Click the Content tab to view metrics for individual posts.
How to view X (Twitter) analytics from mobile
If you have access to analytics through your X account, you can view limited post-level insights on the mobile app. While the full analytics dashboard is primarily accessed on desktop, the mobile app allows you to quickly review how individual posts perform.
Keep in mind the full analytics dashboard is still easier to access on desktop, where you can review broader account performance trends.
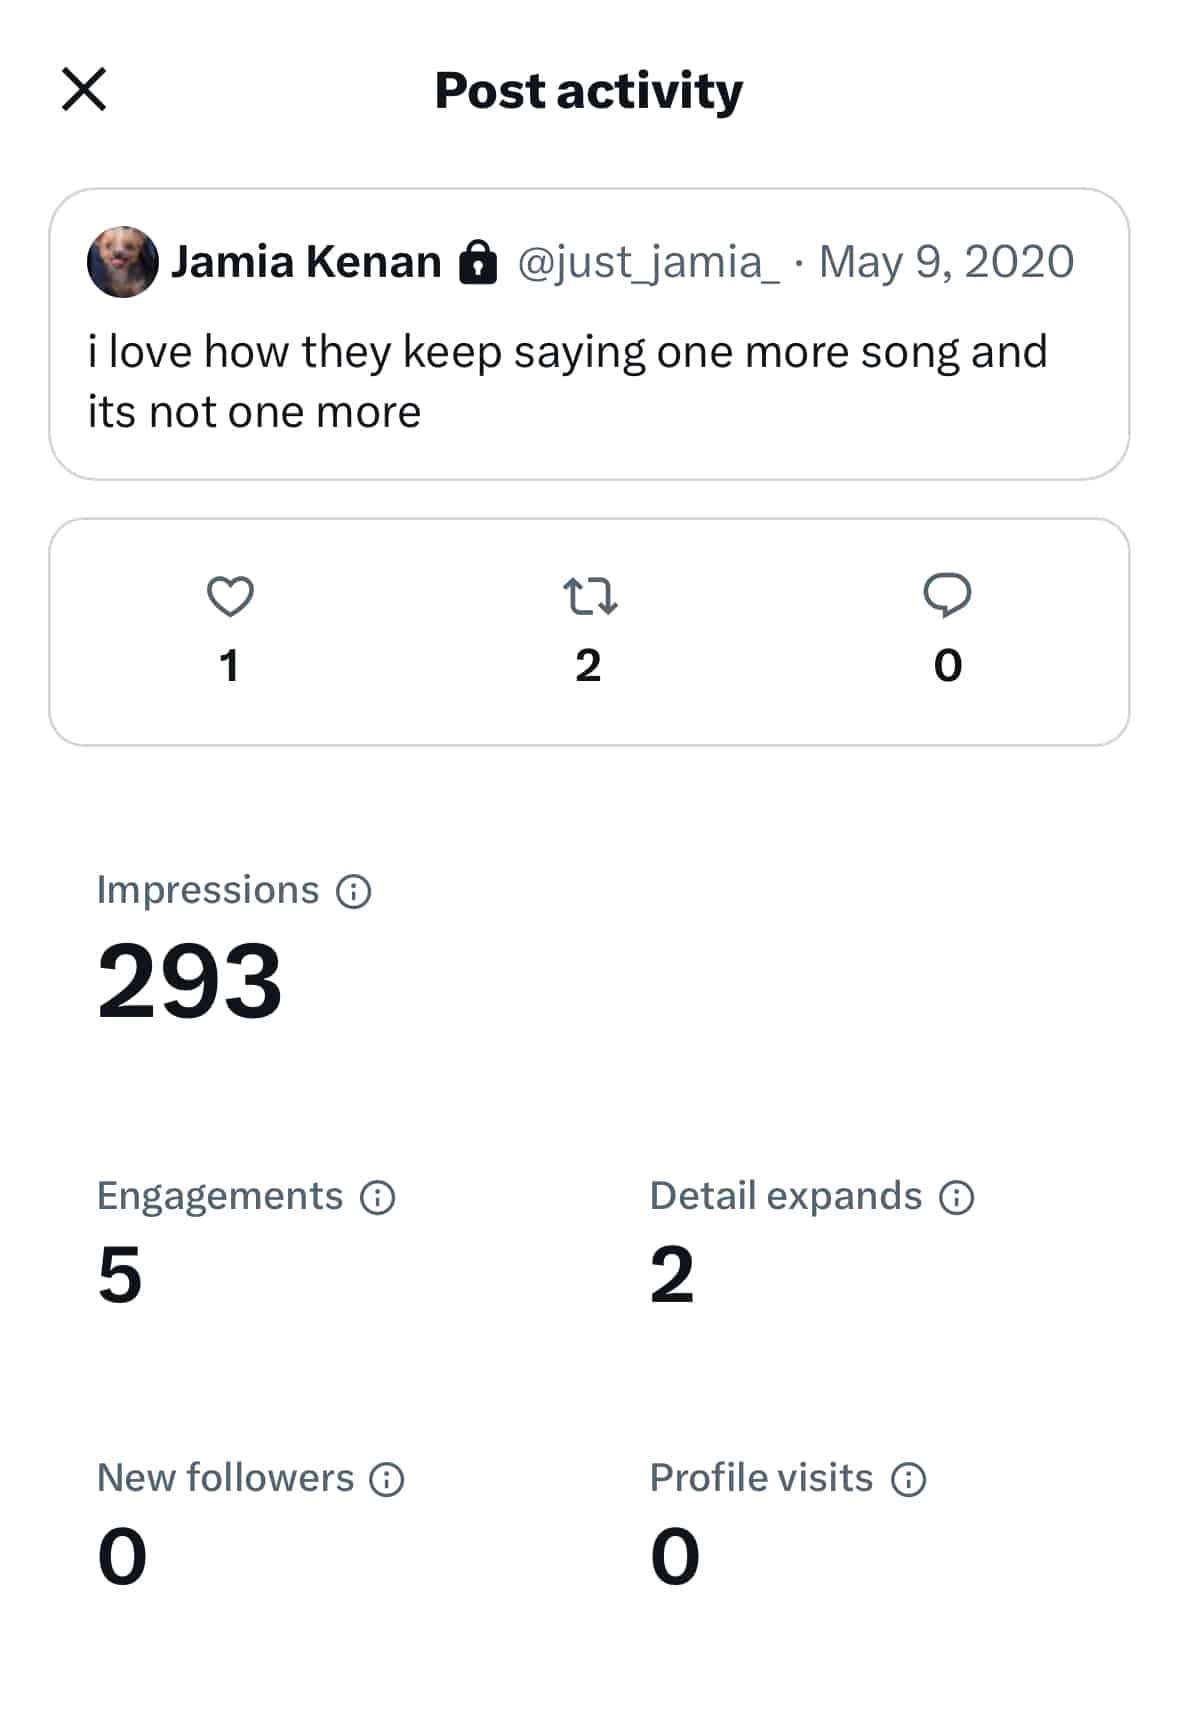
1. To view your X analytics on mobile, tap the post you want to analyze.
2. Tap the graph icon located at the bottom right of the post.

This will give you an overview of impressions, engagements, detail expands, new followers and profile visits from the post.
Who is X (Twitter) analytics for?
Anyone interested in how their X account is performing should use them. This includes creators, social practitioners, marketing leaders, agencies and businesses who have goals based on key performance indicators (KPIs).
X analytics will help you find the types of posts that are most interesting to your followers, no matter what you do or what title you have. These insights are crucial for optimizing your Twitter (X) marketing strategies to maximize results.
Here’s how different roles use X Analytics to track what matters, improve performance and grow with purpose:
X (Twitter) analytics for practitioners
If you’re a practitioner, X Analytics shows you which posts drive engagement and why. It does this by tracking user interactions, which signal what’s working.
Key metrics like reposts, replies and link clicks reveal the messaging, tone and formats that resonate most with your audience—aka the building blocks of content that influences them to take action. With that understanding, you can optimize future posts based on what actually works.
By sharpening your content strategy based on real user interactions, you can give your audience what they want and stay on track to meet your social media goals.
X (Twitter) analytics for marketing leaders
X Analytics offers the following insights that guide your audience down your sales funnel, from first touch to final conversion:
Strengthening brand awareness
Metrics like reach, impressions, mentions and new followers show you how visible your content is and who’s interacting with it. When you track these metrics over time, you learn which topics, formats and timings influence Twitter’s algorithm and expand your reach. You’ll also see whether you’re connecting with the right audience.
Comparing these engagement patterns against other players in your industry through a Twitter competitor analysis helps you determine if your reach is truly expanding relative to the rest of the market.
Offering a place to nurture your audience and build trust
Metrics like replies, engagement rates and reposts show you how your audience interacts with your content. This understanding helps you craft tailored campaigns that encourage deeper interaction with your brand and turn awareness into loyalty.
Driving conversions
While many conversions still happen off-platform, you can track referral traffic and link clicks to understand which posts drive people to your website, product pages or landing pages.
This data is useful for increasing sales since it connects content to business outcomes. That way, you can see what converts and then ramp up those tactics.
In this sense, X is more than a social network for marketing leaders. With a keen eye on the right metrics, it becomes a full-funnel powerhouse to drive brand growth.
What metrics can you track with X (Twitter) analytics?
Social media has its own language, so it’s important to understand how X (Twitter) metrics work.
Here are some of the key metrics you’ll find within the native X (Twitter) Analytics dashboard (along with other metrics to track using third-party Twitter analytics tools):
- Impressions: Total number of times users saw a post
- Reach:An estimate of the number of unique users who saw your content. While native X analytics focuses primarily on impressions, many third-party analytics tools estimate reach by analyzing impressions, audience behavior and engagement patterns.
- Engagement: Total number of times a user interacted with a post. This can include likes, reposts, replies, followers, mentions and link clicks.
- Engagement rate: Percentage of users who saw your post and took action. This can be a like, comment, share or another interaction like a repost. Engagement rates are calculated by the number of engagements divided by the sum of impressions.
- Link clicks: Total number of times people clicked on a link in a post during a set timeframe
- Mentions: Total number of instances where a user talks directly to your brand account or about your brand in a post
- Followers: Number of X users that subscribe to your updates at any given time
- Response rate: Percent of inbound messages you respond to. This is a common metric used by social customer care teams who want to determine how long it takes to respond to relevant messages.
- Response time: Amount of time it takes your business to respond to inbound messages
- Profile visits: Number of users who visited your profile within a given timeframe
- Top posts: Posts that earned the most impressions during a given month
- Top mention: Mention that earned the greatest number of engagements during a given month
- New followers: Net new people who followed you directly from a post
- Follower count: Number of new followers you’ve gained minus how many people have unfollowed your account
- Reposts without comments: Number of people who’ve reposted a post without adding a comment
- Likes: Number of likes that your posts received during a specified time frame. It’s the small heart icon below every post
- Replies: Number of replies that your posts received during a specified time frame
How to maximize X (Twitter) analytics with Sprout Social
X analytics give you a wealth of information to create better content and reach new audiences. Here’s how you can use Sprout Social to maximize your Twitter analytics insights and inform your broader social strategy.
Identify your best content
Look at all the posts you’ve sent and identify which content has performed best. Use those insights to create similar content, as this is more likely to resonate with your audience.
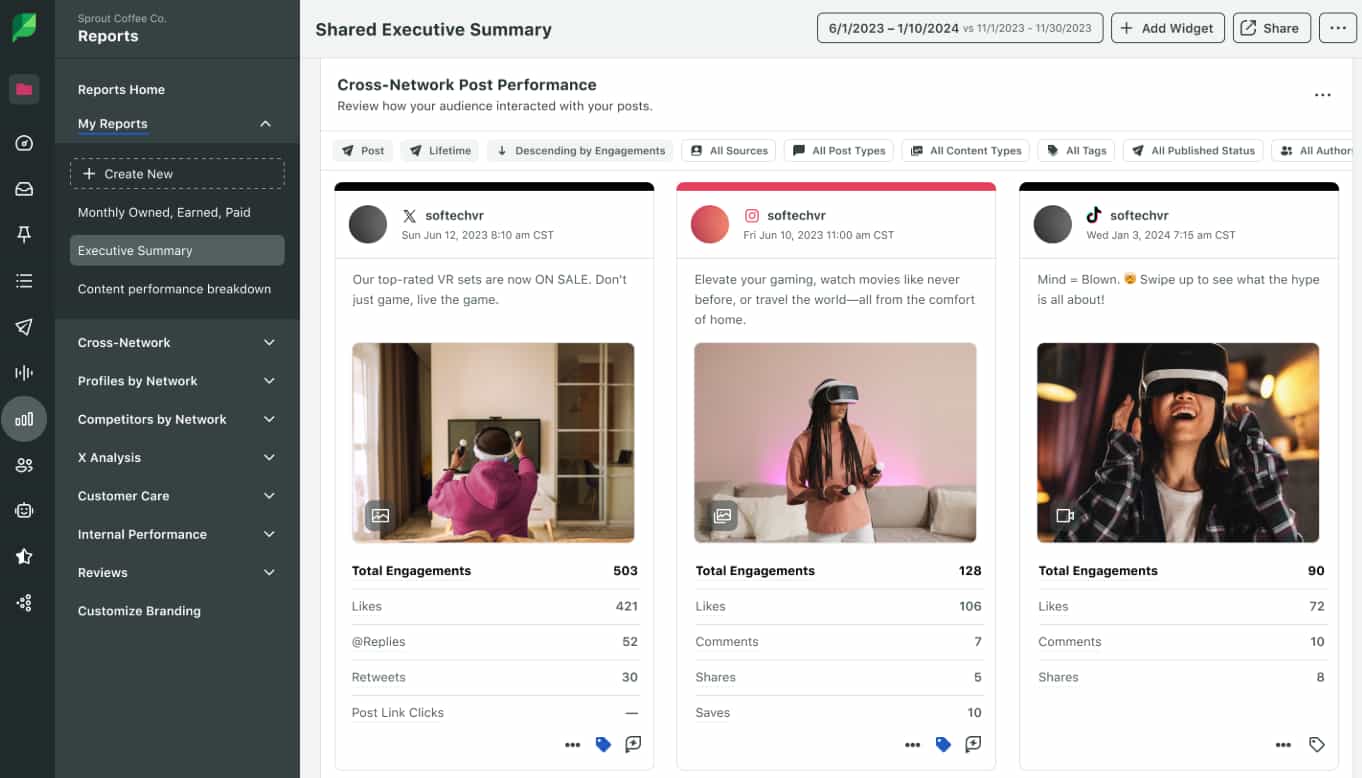
Access this data from the Post Performance Report in Sprout. This gives you an overview of post-level performance across all your profiles. You can filter the report to only show the X profile you want to review or compare across networks.
You’ll see metrics like impressions and potential reach. In this report, you’ll also see the engagements and engagement rate per impression for each post.
With this data, you can identify why these posts were so successful. Here’s how:
- Find common themes in those top posts: Did it contain a hashtag, mention or question? If so, think about including those in the future.
- Identify the best posting times: Were there particular days or times that seemed to work best with your audience? If so, schedule around those times in the future—or use Sprout’s Optimal Send Times™ to automate the best times for you to post on X. This AI-powered feature takes all the guesswork out of scheduling.
- Understand conversation drivers: Export your top posts and create a word cloud to more easily visualize messages that resonate.
Uncover trends in performance and audience insights
The native X analytics dashboard focuses primarily on post and account performance rather than deep audience insights.
Fortunately, Sprout offers a robust toolset to help you better understand your followers. For instance, Sprout Social Listening provides a range of X (Twitter) tools that you can use to learn about your audience, identify trends and discover which topics appeal to your audience. With Listening, you get a detailed breakdown of how people interact with a specific topic, even if they don’t mention your brand or hashtag.
But Listening goes beyond audience insights and trendspotting. It doesn’t just reveal what users say—it also shows you who’s saying it, how they feel and what it means for your brand.
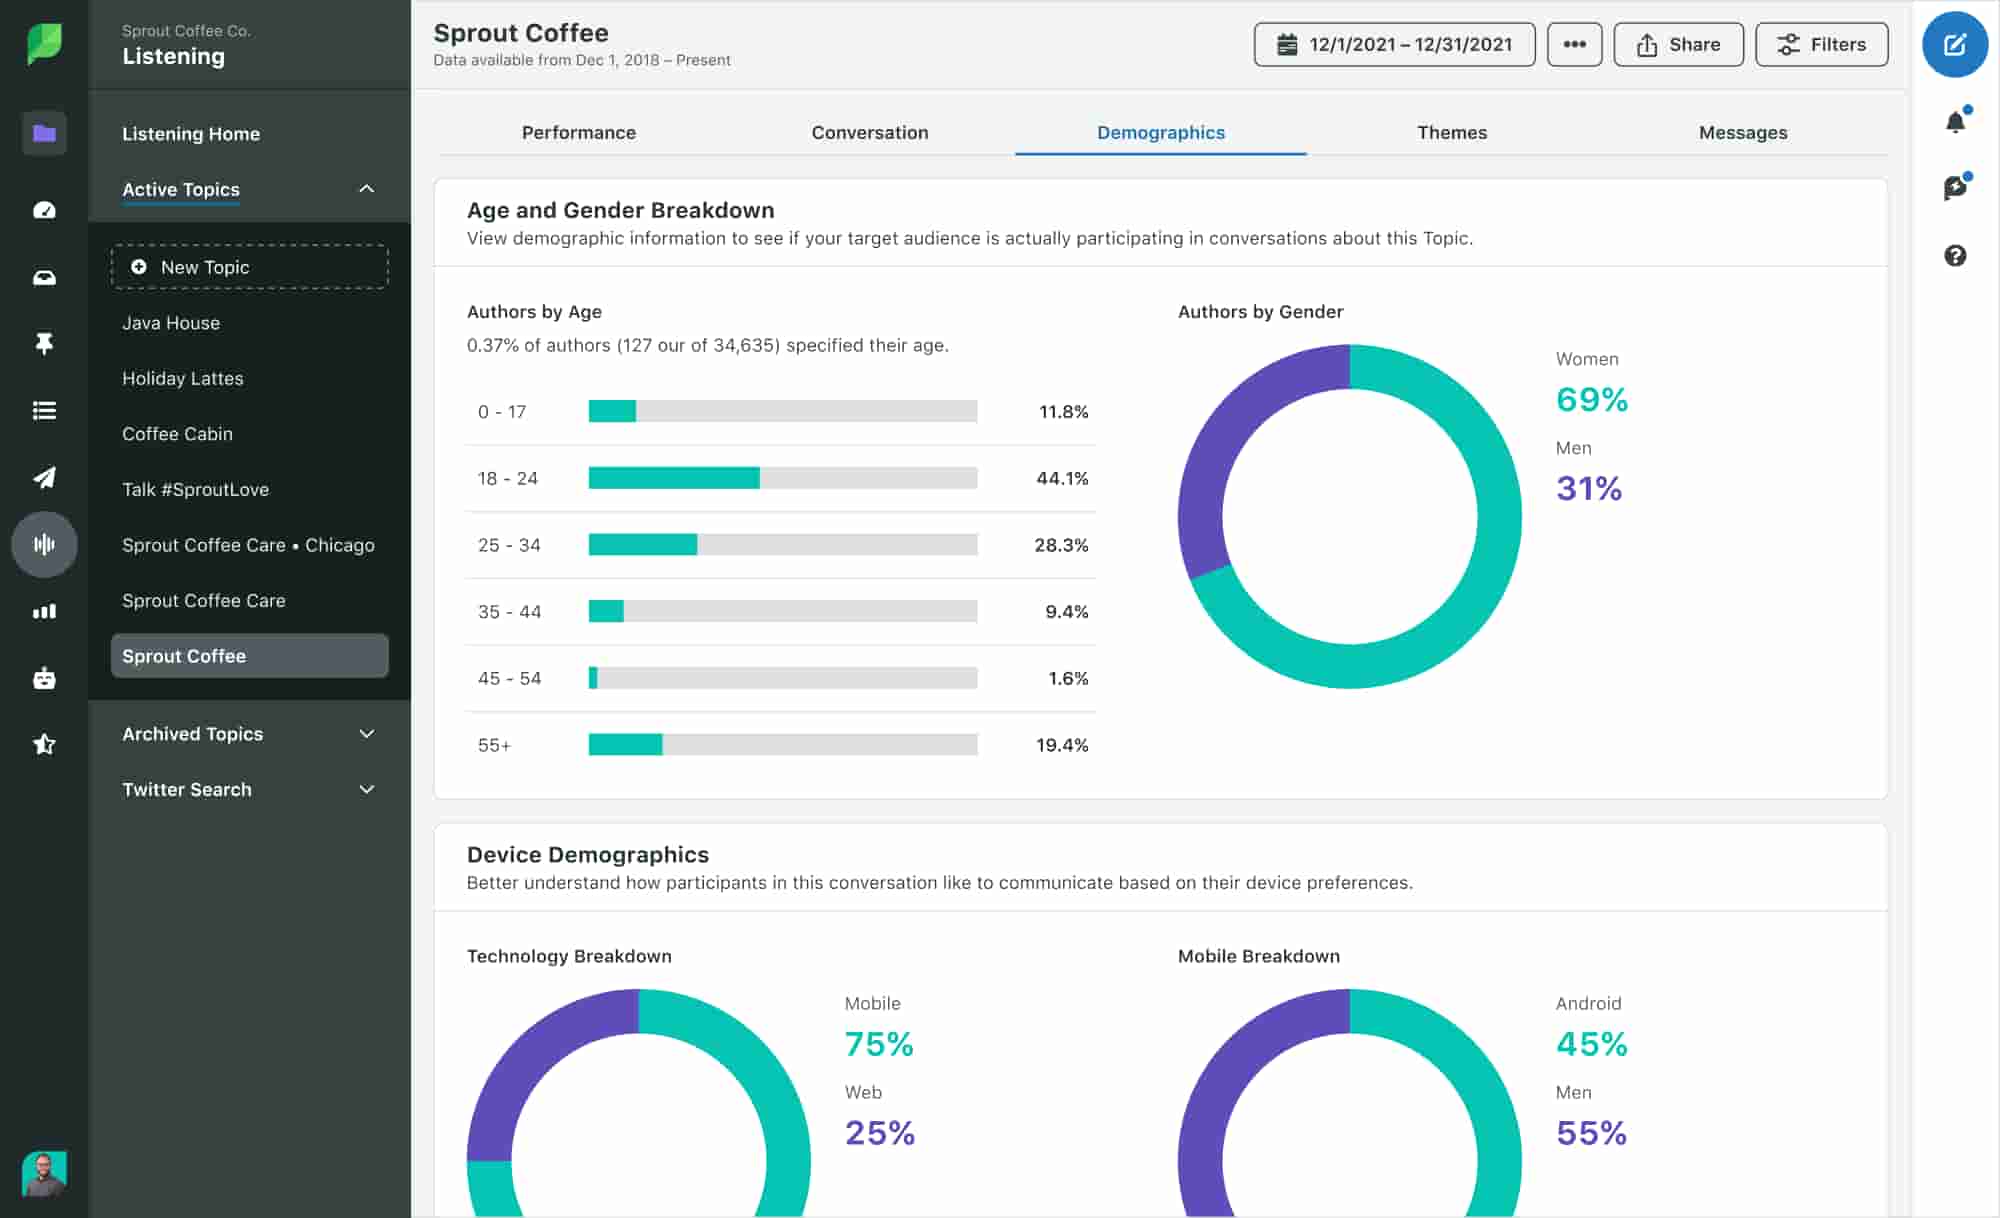
With this feature, you can monitor audience sentiment, pinpoint emerging topics and break down conversations by demographics, location and device type. This shows you how different audience segments discuss key issues so you know how they like to engage.
Additionally, you’ll discover what your target audience says about your competitors. With a real-time view of the broader industry conversation, you can shape messaging to tap into emerging topics—and craft strategies that position you more favorably than your rivals.
Identify advocates and X (Twitter) influencers
Want to find the voices that your audience trusts? With Sprout, you can find advocates to shape your influencer marketing strategy.
The Profile Overview Chart within Listening Demographics shows you the key influencers that drive conversations around any topic. It doesn’t matter whether they’ve mentioned your brand or not—Sprout still shows you who’s dominating your industry.
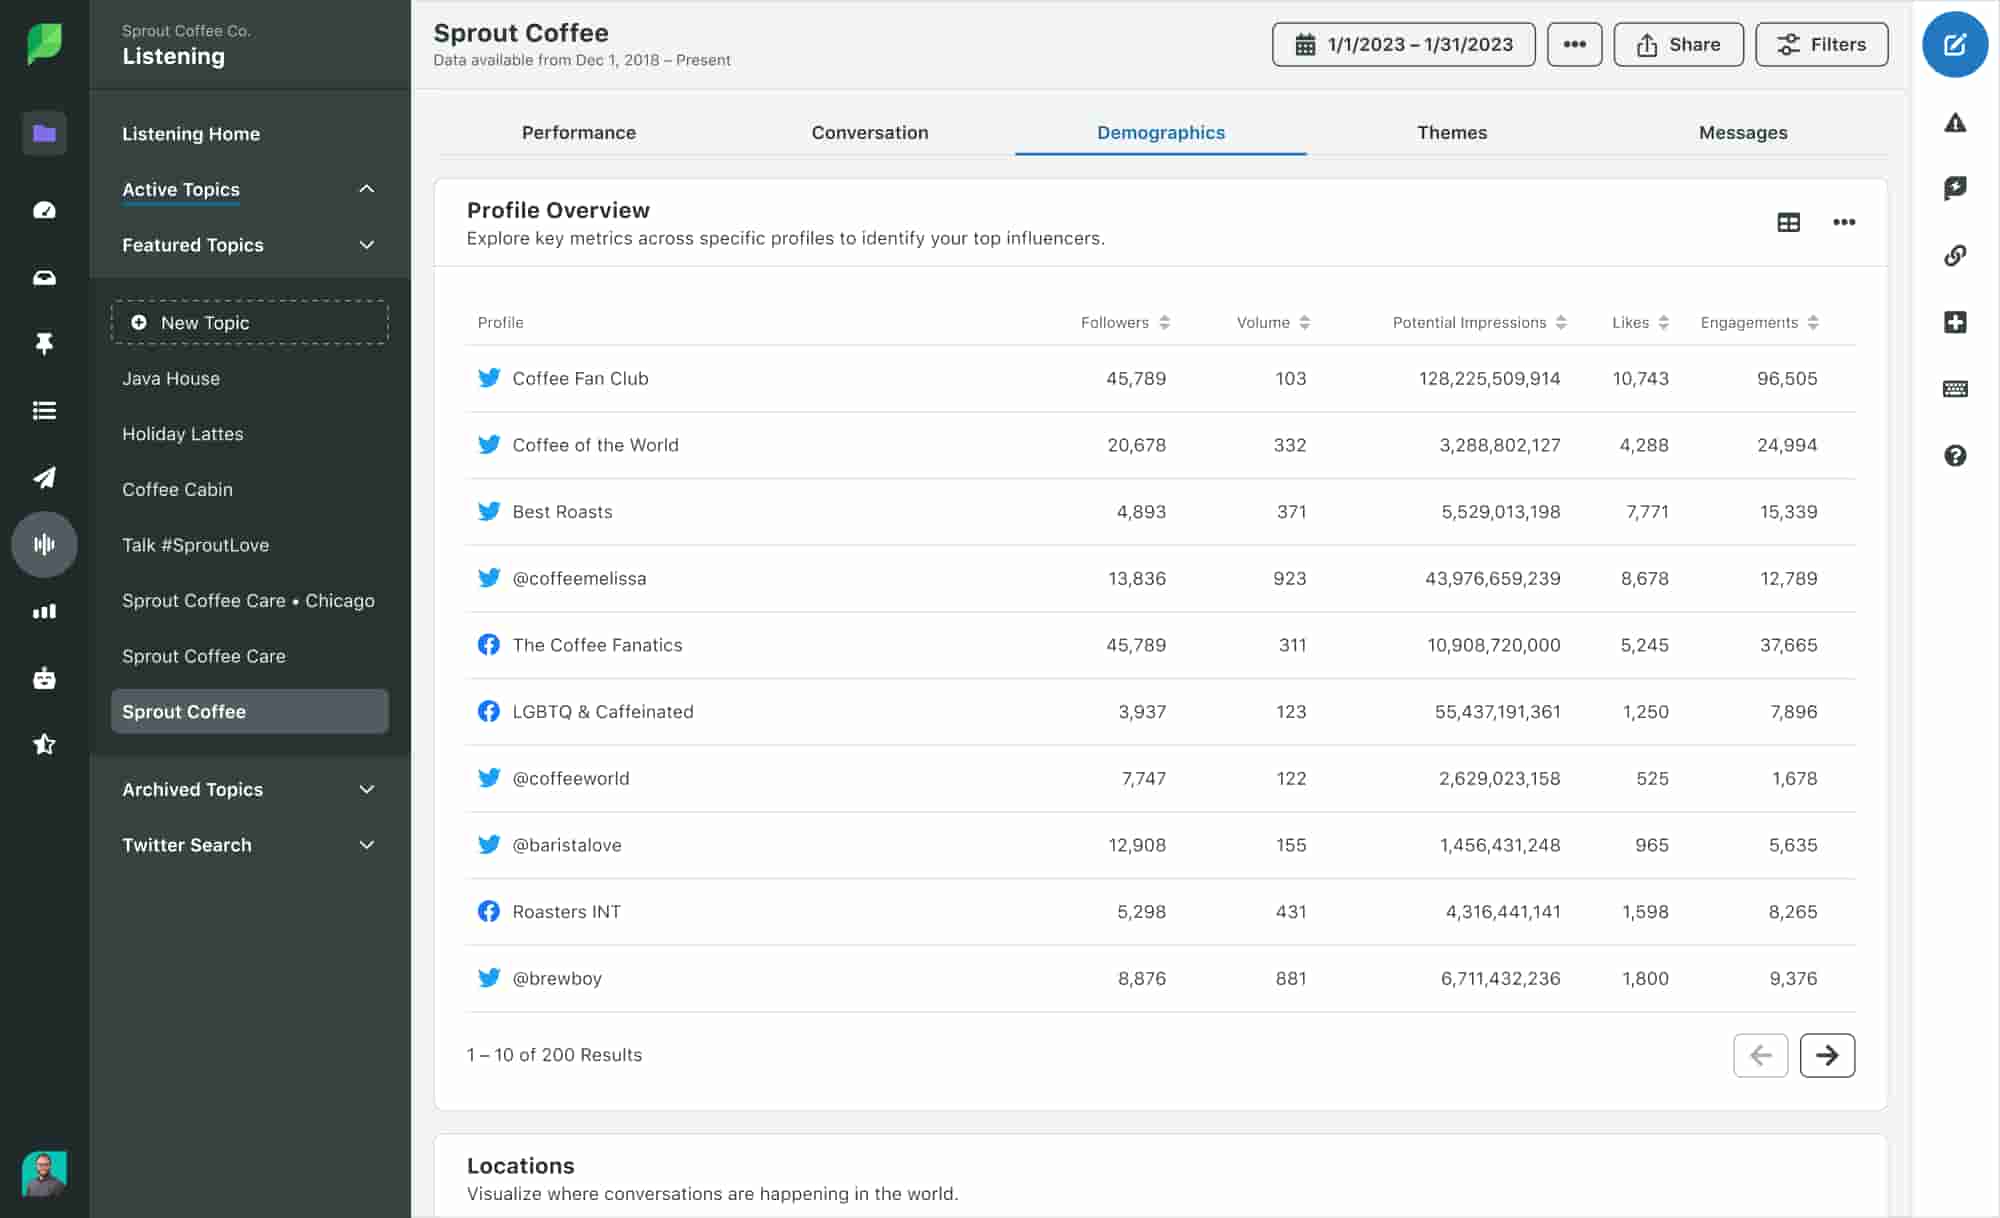
You can view influencers by age, gender, engagement volume and more to pick those that match your brand voice and target audience. Additionally, you can sort these advocates by interactions or volume to identify standout profiles that offer the most value as potential partners.
But why not dig deeper to find influencers that align with your audience’s values and interests too?
For a more strategic view, try Sprout’s Influencer Marketing Platform. It uses AI to help you find brand-safe creators based on the topics your audience cares about. With it, you can sort influencers by content quality, brand fit and past performance to discover which are driving the conversations that spur your customers into action.
Visualize X (Twitter) campaigns with real-time results
Are you and your team creating campaigns? Sprout lets you track both organic and paid campaigns on X through Tagging. Tag each outbound or inbound social media message with dedicated campaign designations. See the following example for “Iced Coffee,” “Lemonade” and “Sunny Sale.”
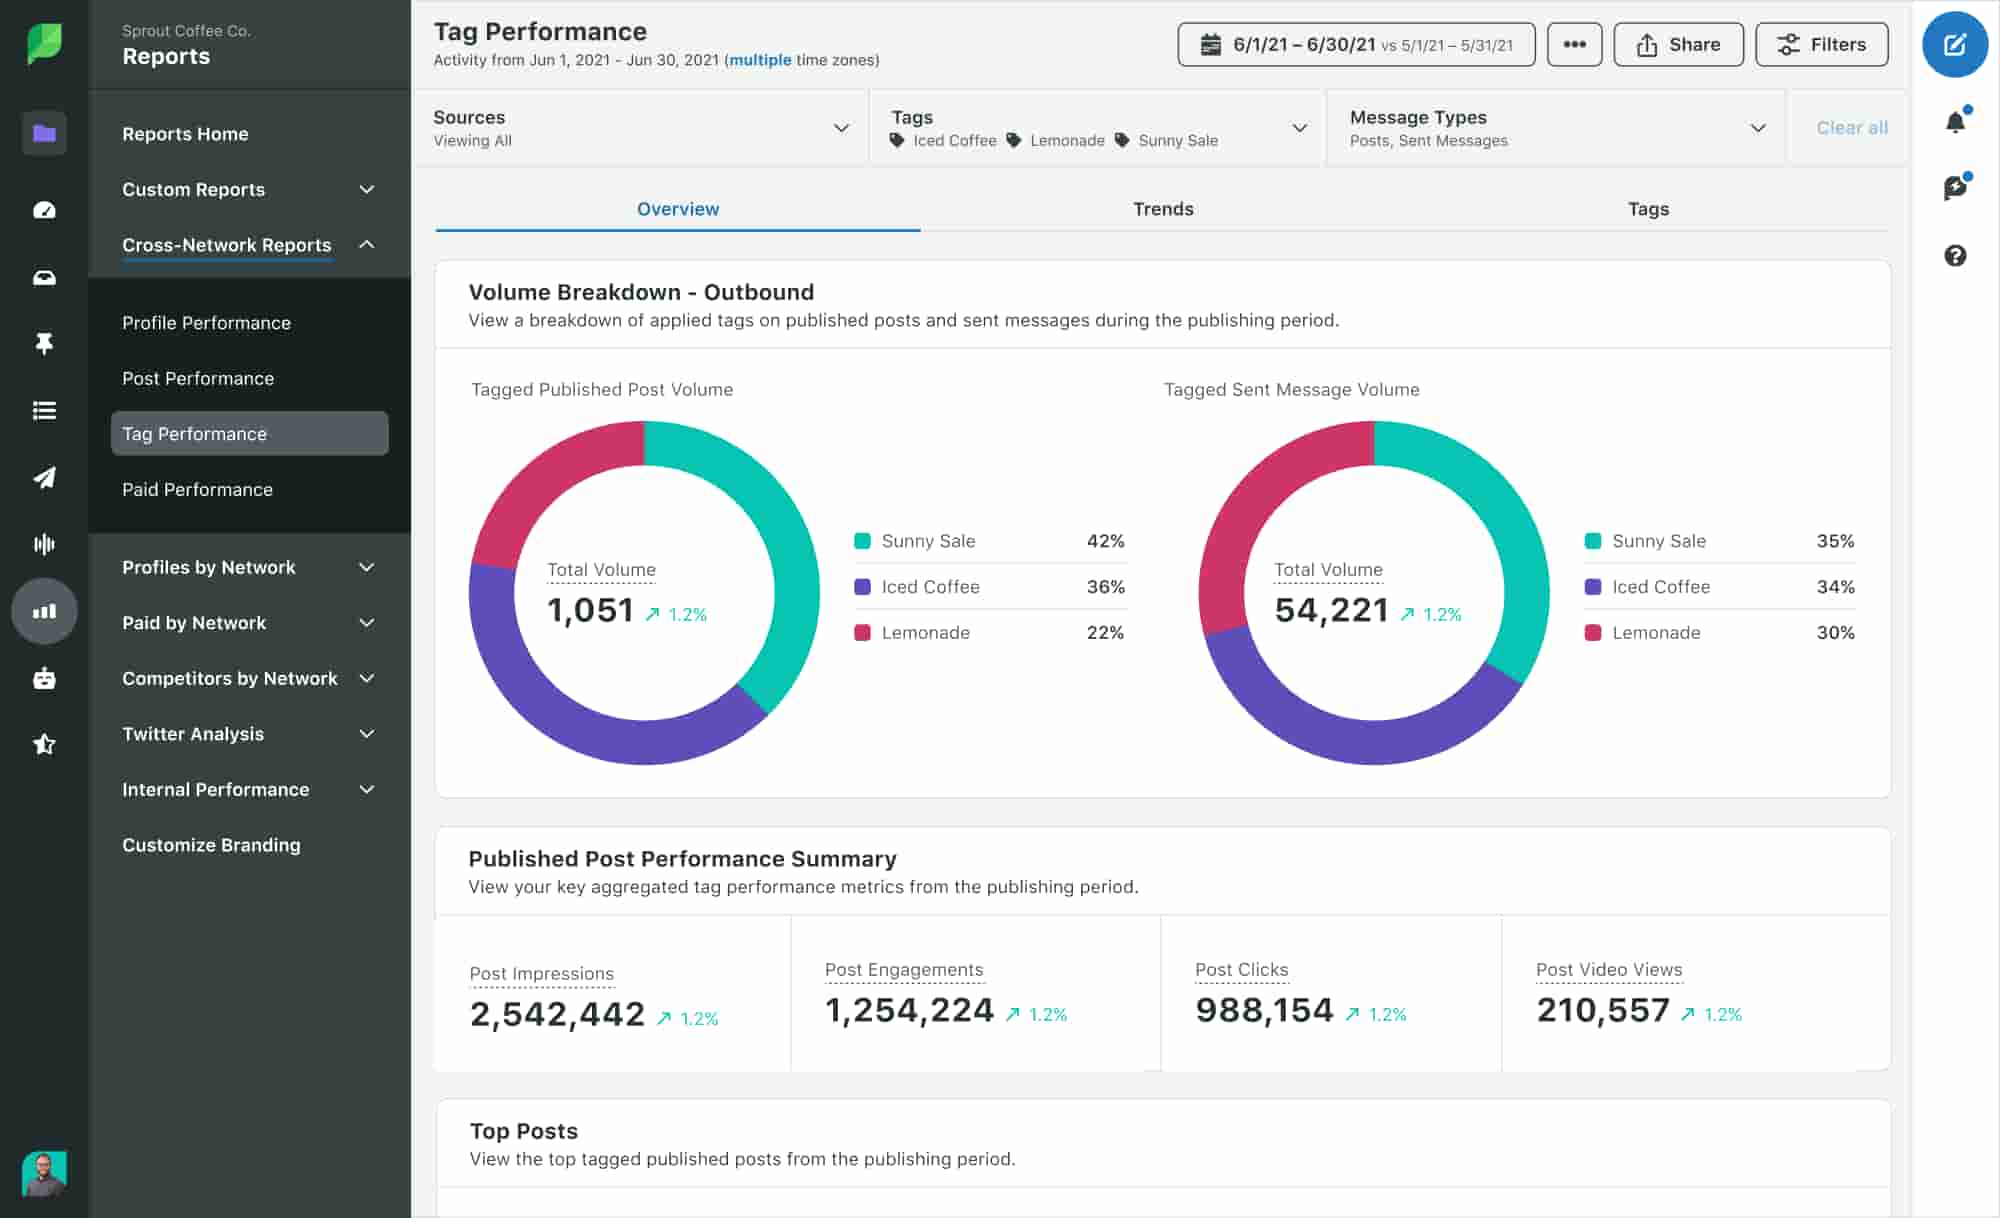
Then track the entire campaign’s success within a single dashboard using metrics like:
- Impressions
- Engagements
- Clicks
- Average messages sent per day
- Total sent
- Average messages received per day
- Total received
- Growth trends
How X (Twitter) Analytics drives business results
If you use X Analytics correctly, you’ll see more than just the surface numbers—you’ll also uncover patterns, performance gaps and audience signals that show you the path to business growth.
From the best posting days to the most valuable content types, here’s how X Analytics powers your success:
Gain a holistic perspective of your target audience
In order for your marketing strategies to succeed, you need to know who you’re talking to.
X Analytics shows you who your followers are, what they like to engage with and how they behave. Metrics like follower growth, top tweet activity, profile visits and engagement rates highlight your top demographics and behavioral trends.
But how is this useful?
Let’s say you notice that the highest spikes in engagement come from Gen Z audiences reacting to meme-style posts about your products. These content insights don’t just show you what to post and who to post to—they’re also a window into what your most active buyers care about.
These demographic insights help you shape everything from campaign tone to product development and partnership choices. It also drives higher ROI because you’re reaching the right people for your brand.
Inform content strategy with performance data
Once you know your most active audience, you need to deliver content that drives them to act. But how do you figure out what makes them convert?
Your Twitter analytics dashboard holds the answer. Metrics like reposts, link clicks and engagement rate per post show you the types of content that land. But beyond the surface data, the patterns behind those numbers reveal much more. These trends show you the best times to post, which formats your audience prefers at different times and how post frequency impacts Twitter performance.
Let’s imagine you’re testing memes vs. videos vs. infographics. X Analytics may show that infographics earn double the clicks and shares during business hours. On the weekends, though, memes may dominate engagement, but only if you post three or four memes per day. That’s your signal to refine not just what you post but also when and how often you post. These insights help you optimize your publishing cadence and brand messaging to build a content strategy that meets your audience where—and when—they’re most active.
The result? Better engagement, stronger brand affinity and more conversion opportunities across your digital channels.
Measure the impact of social media marketing campaigns
When you run data-driven campaigns, you use results from both past and current efforts to see what’s effective and what’s not. Instead of guessing what works, you can use campaign insights to shape new strategies or pivot in real time.
Metrics like engagement, new followers, reposts and mentions show how people interact with your content. But these measurable actions are just a starting point. To truly understand how well a campaign is really performing, you need to combine those signals and interpret what they mean as a whole.
For example, say you’re running a product promo. If your analytics show high tweet impressions but low conversions, your message is out there, but your audience isn’t compelled to act. This shows that the issue isn’t reach—it’s resonance. To fix this, you should consider testing different CTAs or adjusting your offer to inspire action.
This kind of benchmarking and optimization helps you turn data into profitable decisions. When you use performance data to cut what’s not working and double down on what is, you’ll be able to build campaigns that convert. This turns X from a place to build awareness into a channel that drives sales.
Use X (Twitter) analytics to back your strategy with data
Monitoring your social media analytics regularly enables you to find out what works and what doesn’t so you can make informed business decisions.
With proper preparation and finding the right tools, like Sprout, you’ll uncover the exact insights you need from X analytics. See for yourself and sign up for a demo.
Disclaimer: This article uses legacy terms such as “Twitter” to refer to the platform now known as X. All related features follow the former naming convention
X (Twitter) analytics FAQs
How do I check my X (Twitter) analytics?
You can check your X analytics directly from https://analytics.twitter.com or https://x.com/i/account_analytics. From your homepage, you can also go to Premium > Quick Access > Analytics.
What does X (Twitter) analytics measure?
X analytics measure post and profile performance over time. It lets you track metrics such as impressions, engagements, profile visits, mentions and follower growth.
Why can’t I see my Twitter post analytics?
To see your X analytics, you need to be logged in and have analytics turned on. If you still can’t see your analytics after this, it’s likely because of the following reasons:
- You don’t have a Premium account. You must have a subscription to view analytics for multiple posts.
- You’re not primarily posting in one of the supported languages.
- Your account is younger than 14 days.
- You’ve violated Twitter policy.
- Your account is deleted, restricted or suspended.
Additional resources for X (Twitter) Analytics

Twitter mentions: How to find, track & get more
X (Twitter) analytics: How to view insights and improve your data

How the Twitter algorithm works in 2026 [6 strategies]

16 X (Twitter) analytics tools to amplify your strategy in 2026

How to analyze Twitter (X) followers effectively

How to analyze Twitter data for actionable insights

The top 13 Twitter (X) monitoring tools you need to know about in 2026

Twitter metrics: How & why you should track them

What are Twitter impressions & why are they so important to Twitter?
How to View & Measure Your Tweet Activity

Share