15 business intelligence tools (BI tools) to use in 2025


Written by Mahnoor Sheikh
Published on August 2, 2023
Reading time 9 minutes


You want to make informed decisions for your business.
But with so much data available, it’s easier said than done. There’s sales trends, revenue, marketing performance, web traffic — the list goes on.
It’s no surprise then that 95% of businesses see unstructured data as a problem.
Thankfully, with the right business intelligence (BI) tools in your arsenal, you can transform raw data into actionable insights.
In this guide, we’ll break down why business intelligence tools (BI tools) should be a top priority and which tools can level up your business’ decision-making.
Let’s get started.
Table of contents:
- What are business intelligence tools (BI tools)?
- Benefits of business intelligence tools
- Business intelligence tools to try today
What are business intelligence tools (BI tools)?
Business intelligence tools are responsible for gathering, organizing and presenting business intelligence in a way that makes sense to employees. Some of the key data points analyzed by such tools include:
- Financial information (revenue, quarterly sales, best-selling products)
- Customer interactions (marketing engagement, lead sources, traffic)
- Productivity (time or money spent on a task, employee engagement)
When you’re juggling a massive tech stack and tons of customers, analyzing all of the above manually is a tall order. Uniting your company data via BI software gives you a complete, holistic view of your business minus the legwork of crunching numbers yourself.
Benefits of business intelligence tools
The concept of business intelligence isn’t just reserved for the enterprise: we’re seeing businesses both big and small invest in business intelligence tools.
Consider these three key benefits of business intelligence software:
Eliminate data silos once and for all
This is the big one. No department or higher-up should be solely responsible for your company data.
That said, data silos are an unfortunate phenomenon that many companies deal with. According to the Zendesk CX Trends report, just 22% of business leaders say their teams share data well.
This means nearly 80% of teams rarely collaborate, and operate in complete silos — causing a significant barrier to efficiency and growth.
Business intelligence tools encourage a sense of unity and transparency, whether it’s marketing teams dealing with social media data or IT, HR and sales departments.
This puts a stop to informational bottlenecks that otherwise slow workers down or keeps them in the dark.
Visualize data for stakeholders and team members
Getting rid of data silos results in companies sharing their data around.
But doing so means minding how that data is presented. Making sense of complex metrics and KPIs is easier said than done, especially for cross-team collaboration.
Most modern business intelligence tools have features that make it a cinch to present and share BI reports. This includes a variety of data visualizations, chart types and built-in sharing options (think: email, Slack and so on).
Make informed decisions and accurate projections
Beyond assessing your company data, business intelligence tools are also capable of identifying trends and opportunities related to marketing and sales.
For example, which factors contributed to your highest-earning month? What are your top-performing marketing channels and best-selling products? Social media analytics — a type of BI tool — can also tell you which campaigns are lagging.
The ability to understand these trends gives you a sense of confidence and encourages more informed decision-making. Additionally, some BI tools are powered by machine learning and can come up with projections and sales forecasts for you.
15 business intelligence tools to try today
Below is our list of 15 top business intelligence tools to wrangle your company data and translate it into action.
From enterprise software to free tools, there’s something on this list that can help regardless of your company’s size, scope or goals.
1. Sprout Social
Sprout Social can highlight business trends and opportunities with ease. Features such as social listening and sentiment analysis highlight how well your company engages customers and which interactions are resulting in revenue.
Plus, our social media reporting capabilities make it easy to understand and share data among teams.
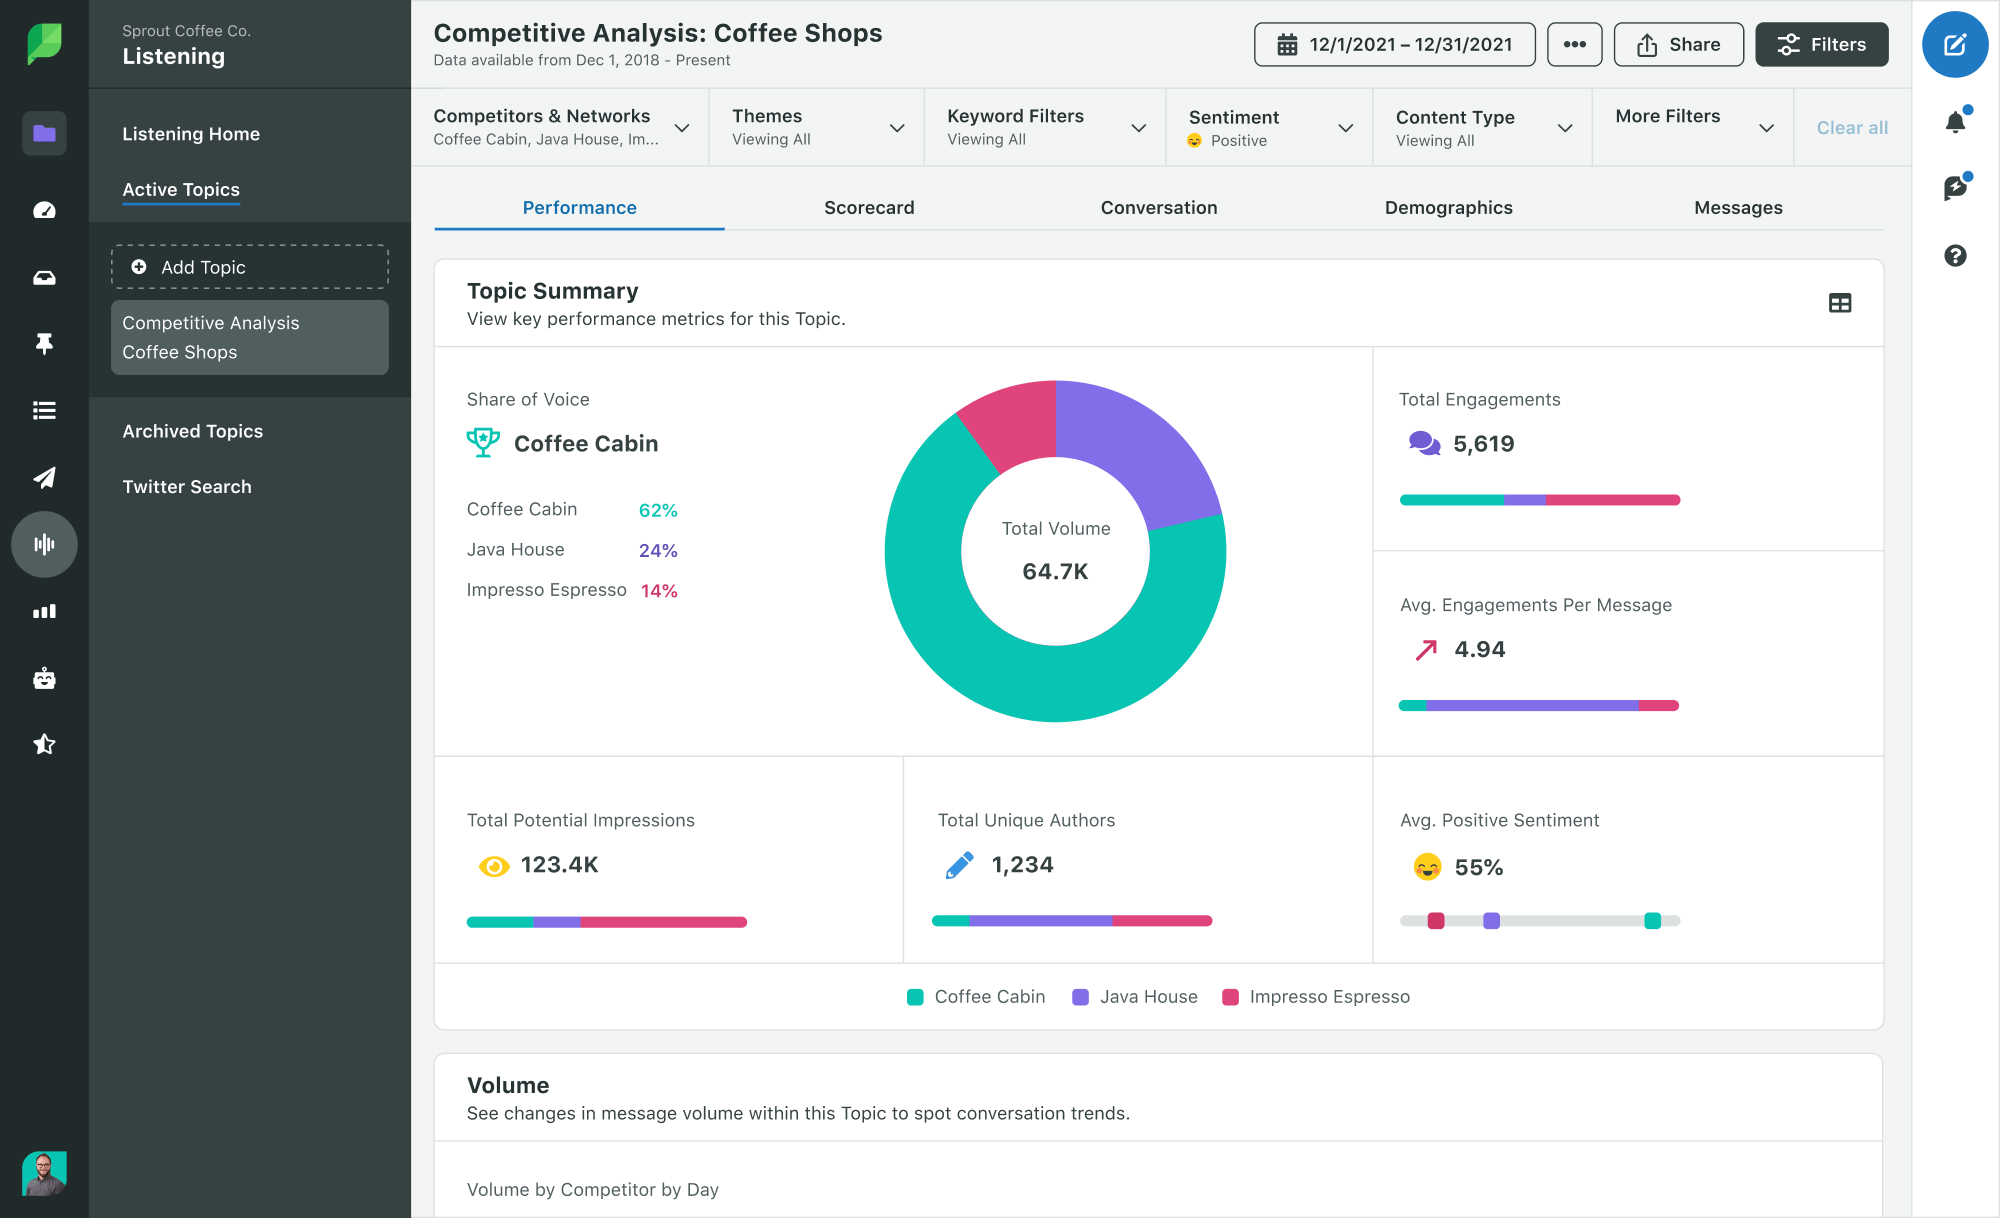

Sprout Social also highlights how your social media efforts contribute to company-wide marketing campaigns. Given that social is such an invaluable source of leads, tracking your performance is a key piece of social business intelligence at large.


2. Databox
Databox is an awesome, all-in-one tool for connecting your company’s data sources and visualizing your business’ data.
The platform boasts 70+ native integrations including your CRM major digital marketing tools, payment processors and more. Databox keeps you from bouncing between tools by consolidating your key metrics into a single dashboard.
Selecting data sources and metrics to watch is a cinch, too. The drag-and-drop functionality of Databox means you can customize your dashboards and reports based on your specific priorities.


Speaking of customization, the platform also boasts 200+ pre-built templates and visualization options. These charts, graphs and tables are a far cry from old-school spreadsheets and are perfect for presenting to your team.


Oh, and the fact that Databox has a forever-free plan is a huge point in their favor. If you’re totally new to business intelligence tools, this is a great place to start.
3. HubSpot
HubSpot is a holistic CRM platform that seamlessly integrates marketing, sales, content management and customer service.
As a BI tool, HubSpot provides a centralized location where all customer data is stored and organized. This allows businesses to gain a 360-degree view of their customers, tracking every interaction from the first point of contact through to sales and post-sales support.
The platform’s analytics tools allow businesses to transform this data into actionable insights. Users can create custom reports and dashboards to visualize their data, making it easier to identify trends, monitor performance and make data-driven decisions.
Furthermore, HubSpot’s marketing, sales, and service hubs each offer their own analytics capabilities, providing detailed insights into specific areas of a business. For example, the marketing hub includes tools for analyzing website traffic, social media engagement and email campaign performance.
4. Domo
Domo’s suite of BI tools is tailor-made for enterprise companies with serious revenue and big customer bases.
The tool shines when it comes to looking at financial interactions and company-wide trends. Domo encourages you to put each of your metrics under the microscope while also hooking users up with 150+ chart types to choose from.


Predictive analytics via advanced AI and machine learning is ideal for large companies looking to project revenue and dig into margins. Additional features such as goal-setting and alerts mean that companies can intervene before problems have a chance to snowball.


5. Audiense
The importance of social listening tools can’t be overstated.
Tools like Audiense dig deep into ad campaigns and audience-specific data for social media. Identifying and segmenting audiences automatically, the platform identifies demographics, customer traits and other information to inform your overall business strategy.
Remember: the “intelligence” in BI is only as smart as the data you’re able to gather. The more in-depth and granular that data is, the more targeted your campaigns can be.


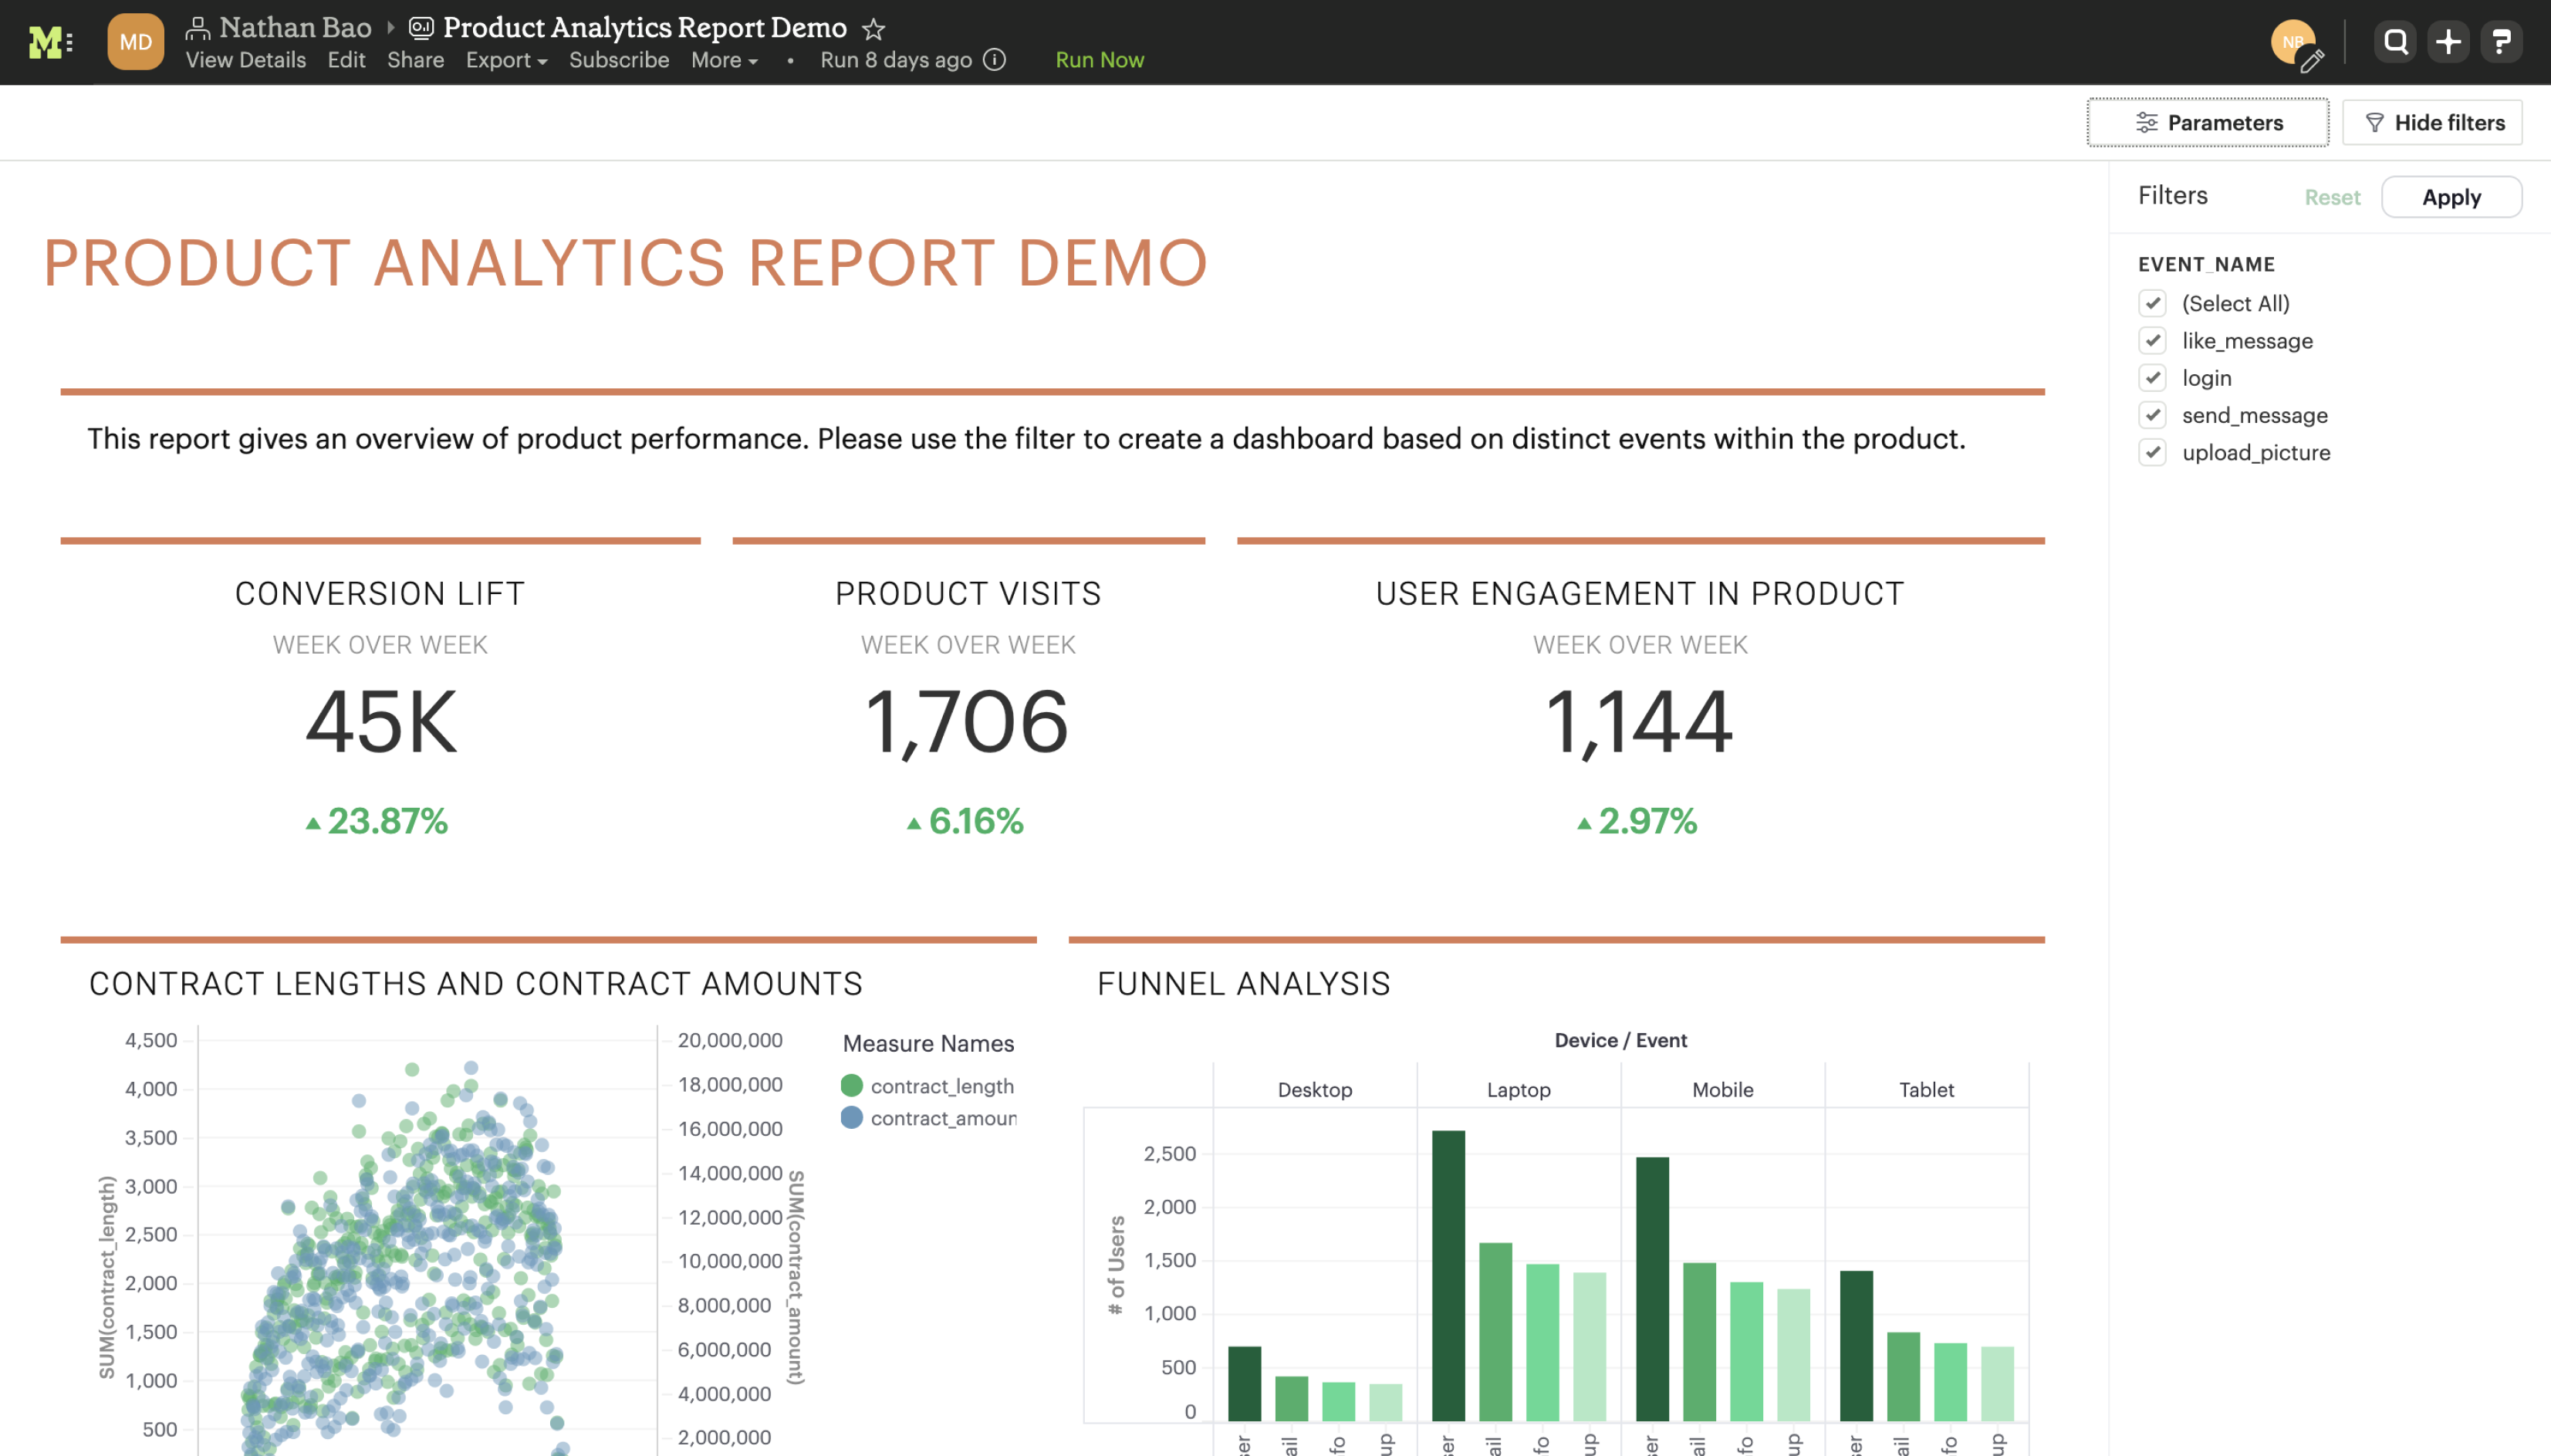
6. Grow.com
A self-proclaimed no-code business analytics software, Grow.com is a powerful BI tool with a serious sense of style.
The platform connects with tools including Salesforce, Google Analytics or your ecommerce platform of choice (think: WooCommerce or Shopify) to pull data directly and generate customizable dashboards. Features such as roles and permissions make collaboration a breeze, as does the ability to share metrics directly in Slack.
You can build your dashboards from scratch or start from one of their own role-specific templates. To highlight the diversity of business intelligence tools and what Grow.com can do, some sample dashboards include:
- Company health
- Sales projection
- Ecommerce sales
- Clinical effectiveness


Figuring out which metrics to focus on is overwhelming by itself. Thanks to Grow.com’s templates and pre-build dashboards, newbies to analysis can get started with BI without analysis paralysis.
7. Holistics
Holistics’ self-service platform is ideal for BI-savvy companies that want to tear down data silos. One of the tool’s main goals is to reduce the need for data requests, empowering users to access their data directly.
Although the platform might be a bit much if you don’t work with SQL, Holistics offers users easy-to-build data visualizations. Affordable pricing and quick setup are also two major points in the platform’s favor.


8. Looker
Looker is part of the Google Cloud Platform. The tool stands out because of its data modeling capabilities — and it’s free to use.
Looker has a user-friendly interface and comes with advanced analytics, including predictive analytics, to help businesses forecast trends and make proactive decisions.
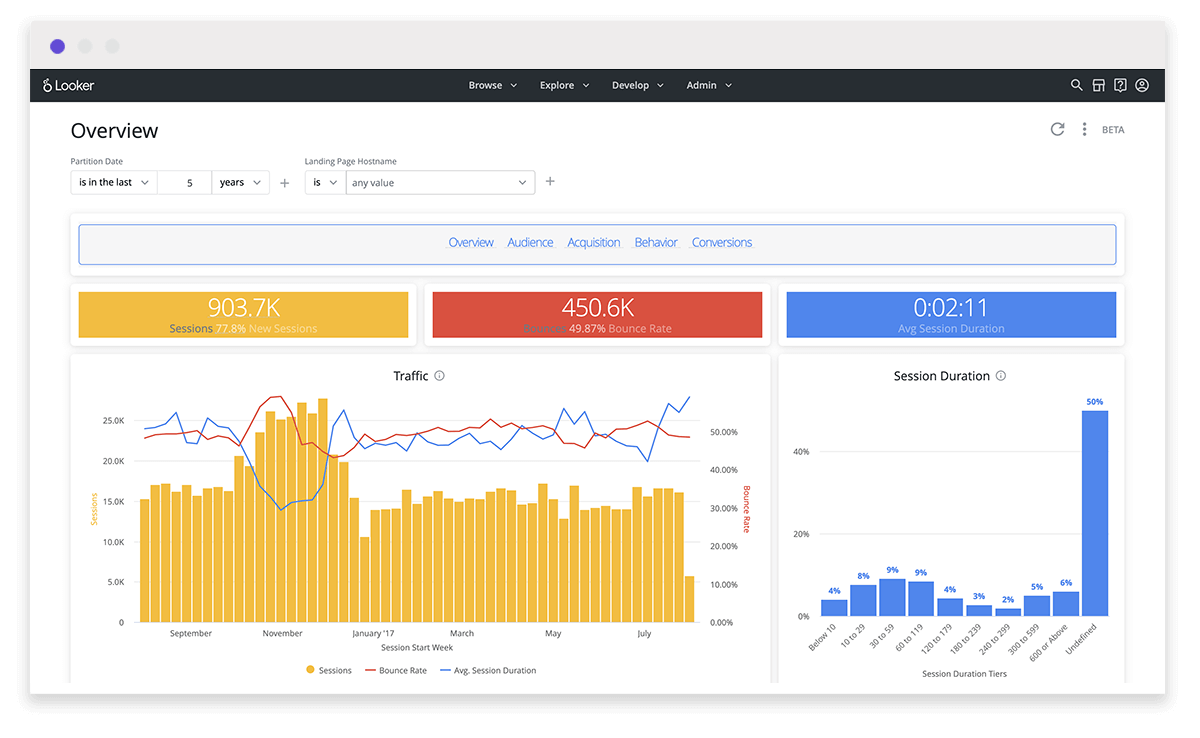

LookML, Looker’s powerful modeling language, enables users to navigate complex data structures, create new metrics and build data models without extensive coding knowledge.
The platform also integrates seamlessly with Looker Studio to help businesses build interactive reports and dashboards.
9. ActivTrak
ActivTrak is unique among our business intelligence solutions because it focuses heavily on individual employee data.
That said, the performance and productivity of individual employees have massive implications for your company at large.
The platform is capable of spotting trends and bottlenecks alike, including inefficiencies, time-consuming tasks and attention shifts. This highlights how BI goes hand in hand with not only doing better business but building a more proactive, healthy company culture.


Another notable feature of ActivTrak is SaaS license management. For example, the platform identifies which apps are most important to your team and how they impact productivity. These insights can be eye-opening in terms of which tools are actually worth their investment and what’s bogging your employees down.
10. Zoho Analytics
Zoho Analytics is a self-service business intelligence software that lets you organize, visualize and analyze large amounts of data. You can easily create custom dashboards, connect to various apps and databases, and collaborate with your team to share data stories.

The platform’s AI-powered assistant, Zia, can answer questions about your data, predict future trends, do cognitive and what-if analysis, and create personalized reports.
Zoho also offers white-label solutions for embedded analytics so you can fully brand your analytics to match your business identity — customize the entire interface with your own logo, colors, images and URLs to deliver a consistent brand experience.
11. Tableau
Tableau is a popular business intelligence tool that specializes in data visualization and analysis. Its drag-and-drop interface allows businesses to create complex visualizations, interactive dashboards and detailed reports without needing to write code.
You can easily manipulate data, change visualization types, add filters and drill down into specific data points to make better business decisions.

Tableau also supports real-time data analysis and can connect to a wide variety of data sources, from spreadsheets and databases to cloud services. It also offers strong collaboration features that enable teams to share dashboards and insights.
12. Sisense
Sisense is an enterprise BI tool that enables businesses to embed analytics into any application or workflow — with or without code. The platform uses unique technology to process data faster than other BI tools. This means you’re able to analyze data from multiple sources in real time and quickly react to any changes.
Here are some other features of Sisense:
- Drag-and-drop user interface
- Custom, interactive data visualizations
- Embeddable white-label analytics
- Ad hoc analysis, queries and reports


13. Mode Analytics
Mode Analytics is a modern BI tool that’s bridging the gap between data experts and decision-makers by providing a collaborative environment for data analysis.
It combines SQL, R, Python and data visualization in one place, and enables data scientists to share their analysis with non-technical teams in the programming language of their choice.

Mode also offers ad hoc analysis, self-service reporting, interactive dashboards, advanced analytics and custom data apps that make it a flexible and powerful full-stack BI platform.
14. Klipfolio
Klipfolio is a business intelligence tool that focuses primarily on dashboard data visualization. Businesses can easily create, visualize and monitor custom metrics in real time.
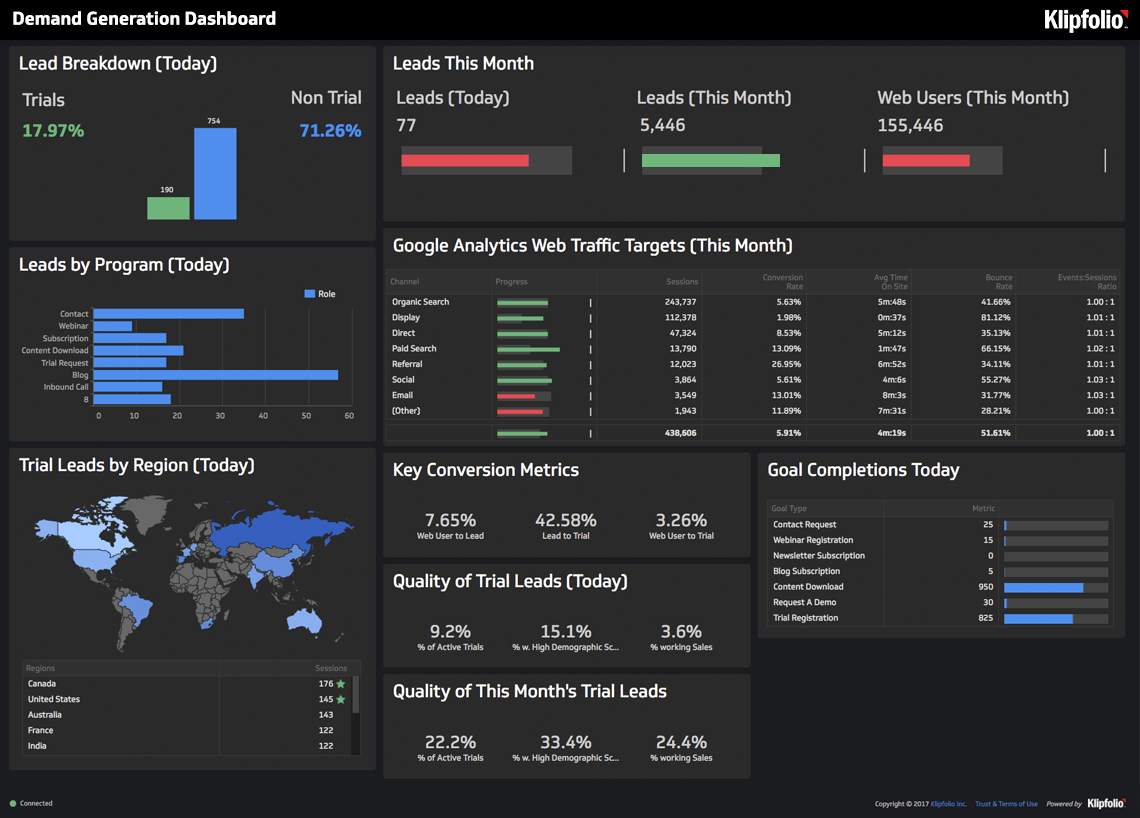

The platform lets you combine data from various sources like spreadsheets, SQL, REST, pre-built metrics and more so you can quickly filter and analyze your data. The software also offers a mobile app to help you track KPIs on the go.
Klipfolio offers a robust free plan with unlimited metrics and multiple users. However, you’d need to upgrade to a paid plan to download PDF reports.
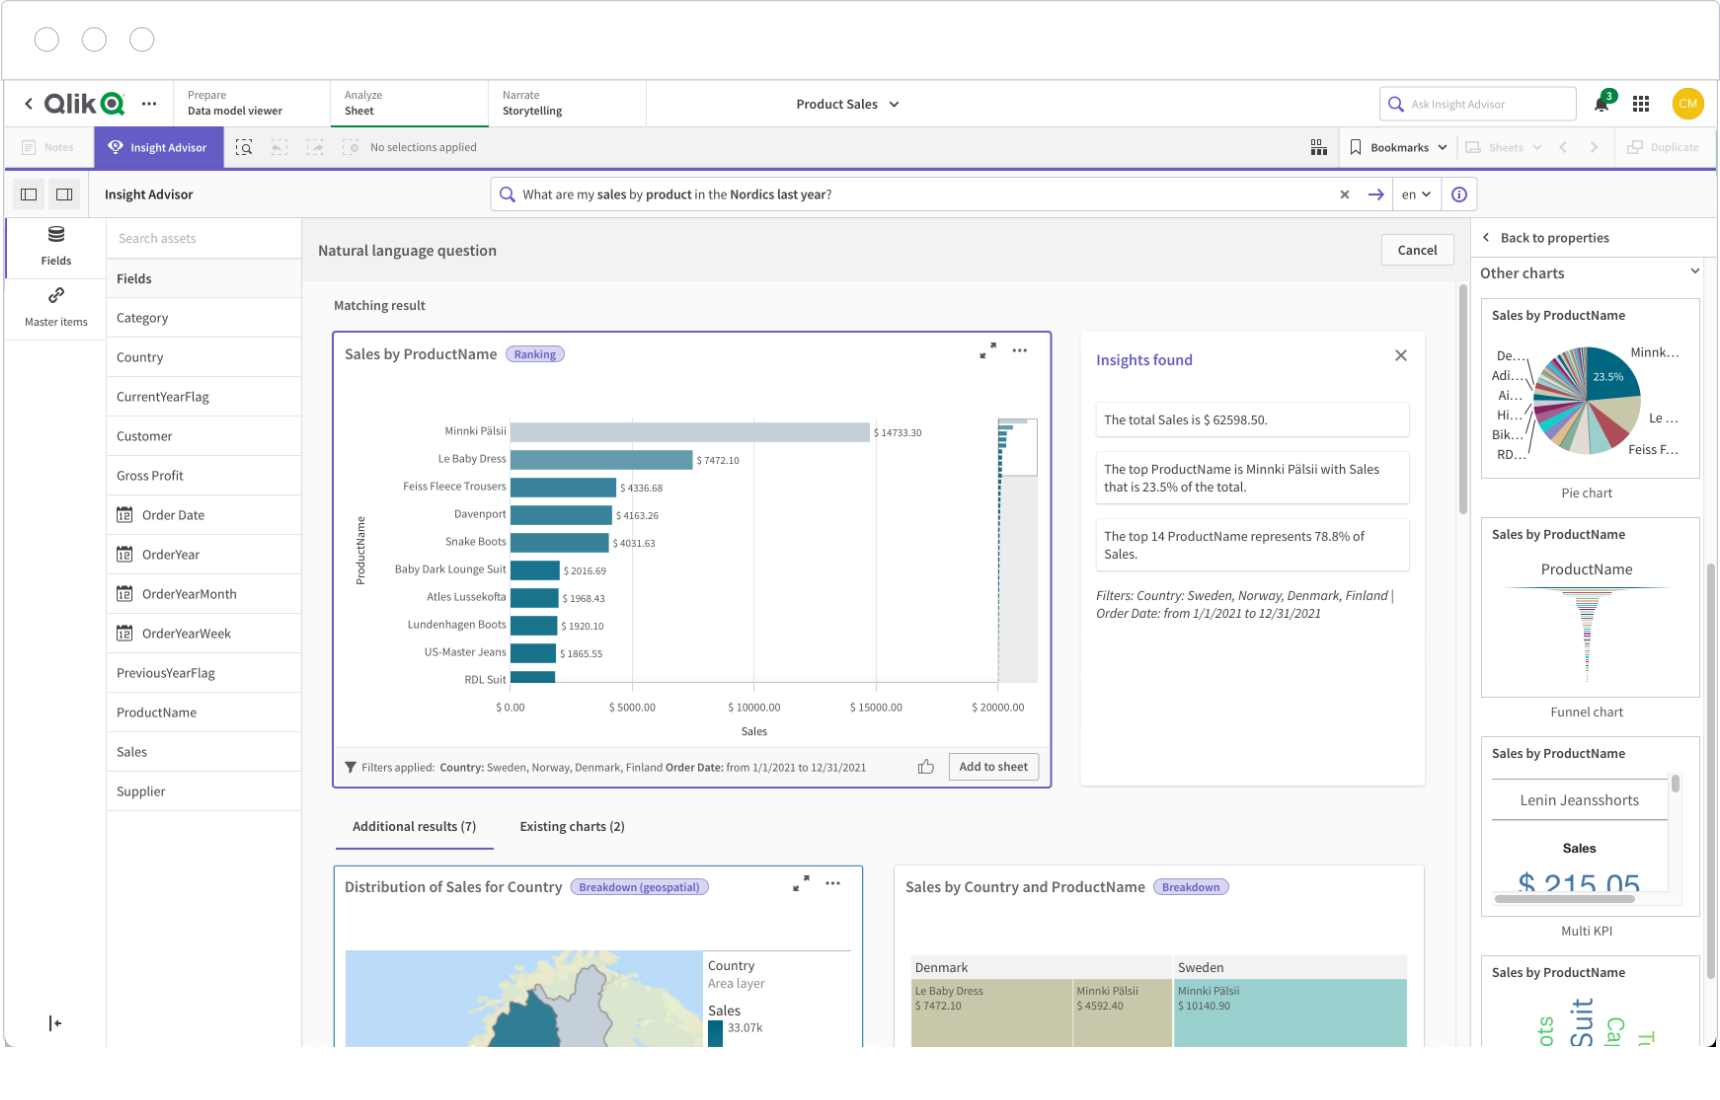
15. Qlik Sense
Qlik Sense is an AI-powered analytics solution known for its one-of-a-kind associative technology. Unlike with traditional BI tools, users can freely explore data from various angles and uncover insights that might be missed in linear analyses.
Create and share interactive dashboards, and enable real-time, data-driven alerts that automatically notify you when there are any changes in data so you can take timely action.
The platform also offers AI-generated insights, search and conversational analytics, no-code reporting and more to help businesses analyze data more effectively and make better decisions.

Which business intelligence tools are on your radar?
Investing in BI can be a game-changer for any given business.
That’s because they identify trends and opportunities that would otherwise be impossible to spot yourself.
If you want a more comprehensive understanding of how your business actually works, business intelligence tools can do the trick. They should be a top priority for companies moving forward.
And if you haven’t already, make sure to test-drive a trial of Sprout Social to understand how your social media metrics can support your company’s growth and big-picture business goals.
Share