38 Instagram statistics you need to know for 2026 [Updated]


Written by Mahnoor Sheikh
Published on April 2, 2026
Reading time 13 minutes


Table of Contents
Instagram in 2026 is a very different platform than the one most marketers built their strategies around. It’s faster, more video-focused and more commercially powerful than ever.
Whether you’re planning your content calendar, making a case for ad budget or rethinking your approach to the platform, you need current Instagram stats to back up your decisions.
These social media statistics cover everything from demographics and engagement to ad benchmarks and influencer trends, so you know exactly where Instagram stands right now.
Instagram demographics
Understanding who uses Instagram is the foundation of any good strategy on the platform. These demographic stats will help you sharpen your target audience on Instagram and make better decisions about who you’re creating content for.
1. There are around 182 million Instagram users in the United States
With roughly 182 million users, the US remains one of Instagram’s largest and most valuable markets, but it represents a surprisingly small slice (6%) of the platform’s global audience.
If your brand operates internationally, this is a reminder to think beyond a US-centric strategy. Localized content, region-specific campaigns and an understanding of cultural nuance across markets can help you tap into the other 94% of Instagram’s user base.
2. Instagram’s biggest audience is aged between 25-34
According to Statista, Instagram’s largest demographic worldwide falls in the 25–34 age range, followed closely by the 18–24 age group.
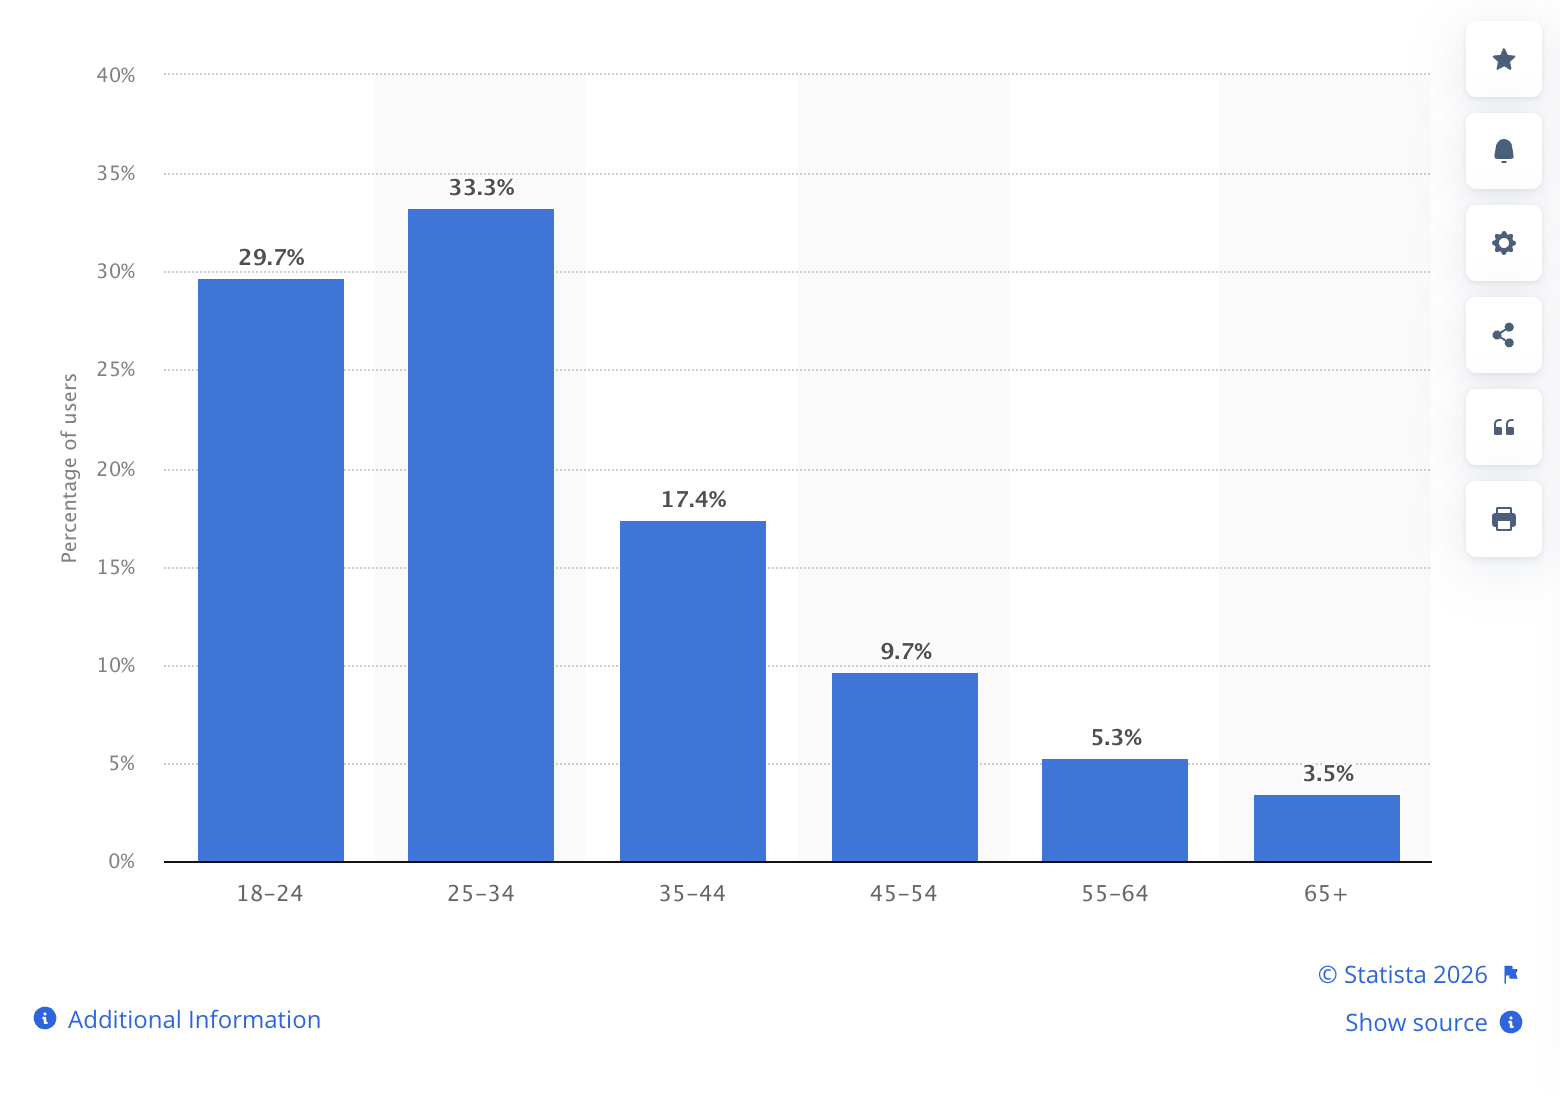

These two age groups alone account for roughly 63% of Instagram’s global audience. That’s a massive concentration of millennials and older Gen Z users in their prime spending years. If your brand targets this demographic, Instagram should be near the top of your priority list.
3. Instagram’s global audience skews slightly male
Around 52.5% of Instagram’s worldwide audience identifies as male, while 46.4% identify as female. However, in the US, this number actually skews the other way. DataReportal shows 54.5% of Instagram’s adult ad audience in the US was female, while 44.6% was male.
The gender split on Instagram varies by region. For global brands, that means your audience strategy should be localized. And for US brands, Instagram may be especially useful for campaigns aimed at women, depending on your category.
4. India has the most Instagram users, followed by the United States
India leads the world in Instagram users with about 480.55 million users. The US is next with nearly 182 million, followed by Brazil with 147 million.
This stat matters most for brands with international ambitions. If you’re building a global brand, planning regional campaigns or thinking about creator partnerships in emerging markets, Instagram gives you a strong case for market-specific strategy instead of a broad approach.
5. Instagram’s US audience tends to be affluent and well-educated
According to Pew Research Center, 58% of Instagram users in the US have a college degree and 60% live in households earning $100,000 or more per year.
Even though Instagram is not only for premium brands, the data shows marketers in categories like software, finance, travel, wellness, higher education and upscale retail may find a particularly attractive audience there.
6. Instagram reaches a balanced mix of urban and suburban US users
Pew also found that Instagram’s US audience is split almost evenly between urban users (55%) and suburban users (54%). Rural usage trails behind at 37%.
This stat provides useful context for regional campaigns, local targeting and businesses that rely on dense metro-area audiences. If rural markets matter more to your brand, Instagram may still play a role. But it probably shouldn’t carry the full strategy.
7. Instagram is the #1 platform for Gen Z audiences
According to the 2025 Sprout Social Index™, 89% of Gen Z say Instagram is their favorite social platform.
If Gen Z is part of your growth strategy, Instagram deserves serious attention. This is where brand storytelling, creator partnerships and product discovery all come together. But it also means expectations are high. Gen Z wants brands that feel relevant, authentic and worth engaging with.
Instagram user and usage statistics
User counts only tell part of the story. What really matters is how people are using Instagram: how often they open it, how long they stay and what they’re doing while they’re there.
These statistics paint a picture of user behavior and perception of the platform so you can implement Instagram best practices the right way.
8. There are 3 billion monthly active users on Instagram
Instagram now has 3 billion monthly active users globally. Even with growing competition, Instagram has kept its place as one of the biggest social networks in the world.
That scale gives marketers room to build both broad campaigns and niche communities. But it also means more noise. Brands need stronger strategies, consistency and a willingness to experiment with new formats to stand out.
9. Around 65% of consumers are on Instagram
According to Sprout Social’s 2026 Social Media Content Strategy Report, around 65% of consumers have an Instagram profile, making it one of the most widely adopted social platforms across generations.
When that many consumers maintain a presence on one platform, it becomes a core part of your visibility strategy. Even if Instagram is not your top conversion channel, it likely plays a major role in discovery, familiarity and brand perception.
10. Nearly one-third of users plan to use Instagram more in 2026
According to Sprout’s data, 32% of Instagram users plan to spend more time on the platform in 2026. Among Gen Z, that rises to 41%—the highest of any social platform for that generation.
Users are not just staying; they’re planning to lean in more. For marketers, that supports continued investment in content, paid campaigns and creator programs.
11. Users love to find purchase inspiration on Instagram
From viral Reels to influencer sponsorships, there’s an abundance of content on Instagram to drive product discovery.
Our 2026 Social Media Content Strategy Report supports this, showing that over a quarter of social users from every generation turn to Instagram to find their next purchase.
12. Instagram drives higher engagement than most other platforms
Instagram’s average engagement rate sits at 0.50%, higher than both Facebook and X, and second only to TikTok, according to Social Insider.
Socialinsider also notes that public likes are declining because Instagram increasingly rewards watch time, saves, shares and private interactions like DMs.
In other words, the engagement is still there; it’s just shifted elsewhere. Make sure you’re tracking those metrics for an accurate picture of performance.
13. Carousels are the most engaging format on Instagram
Socialinsider’s Instagram benchmarks reveal that carousels lead Instagram engagement at 0.55%, with Reels close behind at 0.52%.
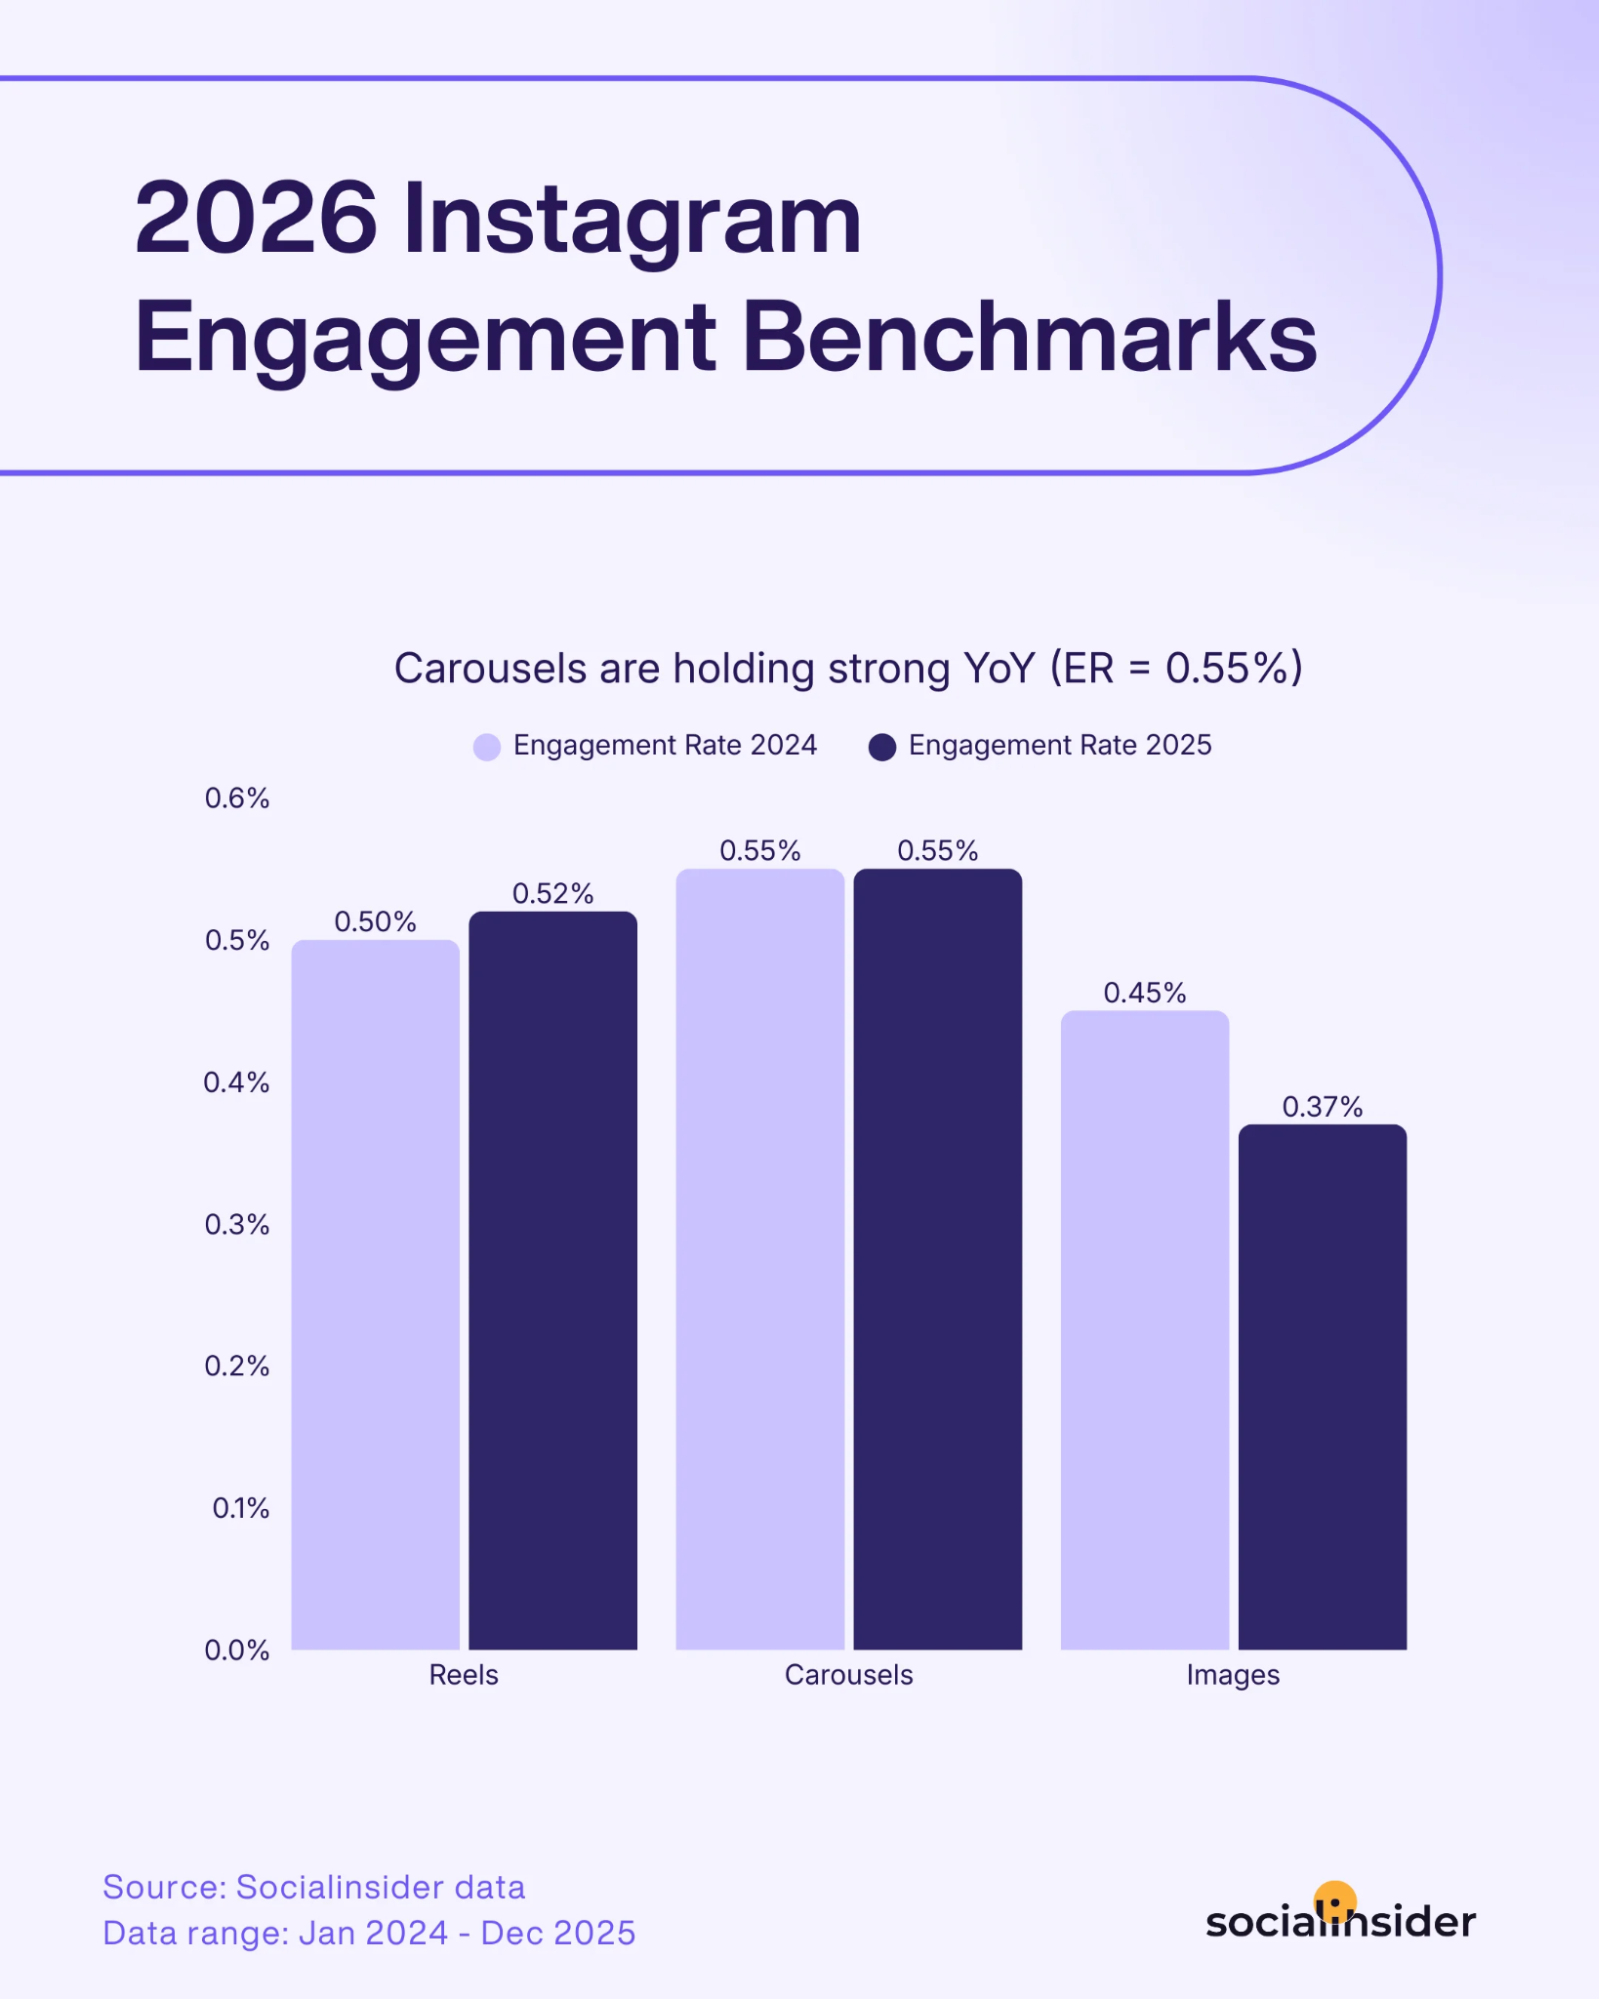

Here’s why: carousels invite users to pause, swipe and spend more time with the content. If your content team defaults to Reels for everything, this stat is a good reminder to diversify and include formats that hold attention for longer.
14. The average Instagram users spends 73 minutes on the platform daily
Instagram users typically spend 1 hour and 13 minutes per day scrolling through the app. That’s a lot of attention, and it shows Instagram is not just a quick-check app. For many users, it’s a daily habit. And the more time people spend there, the more opportunities brands have to show up across formats like Reels, Stories, ads and influencer content.
15. The typical Instagram user opens the app more than 12 times a day
Twelve daily sessions is higher than Facebook, TikTok and X. It means users are checking in throughout the day; during a commute, a lunch break or before bed.
This gives your content multiple chances to surface in someone’s feed or Stories tray on any given day. It also makes a strong case for posting consistently and throughout the day to maintain a presence during those frequent check-ins.
16. Almost every Instagram user uses the app alongside other platforms
According to data from GWI, only 0.1% of Instagram users are unique to the platform. A large number of users use it alongside other social media platforms such as Facebook (80.5%), YouTube (76.8%) and TikTok (54.5%). That means having a solid cross-platform marketing strategy is crucial for your brand to succeed.
Instagram advertising statistics
Instagram’s ad business says a lot about how valuable the platform has become. These Instagram advertising stats show how big its paid ecosystem is, how it performs and why marketers continue to put budget behind it.
17. Instagram offers a total potential ad reach of 1.91 billion users
According to DataReportal, the platform’s advertising tools can reach approximately 1.91 billion users worldwide. Nearly 2 billion users reachable through ads is an enormous canvas. Lean into detailed audience segmentation, lookalike audiences and retargeting to make sure your ad spend isn’t wasted on broad, unfocused campaigns.
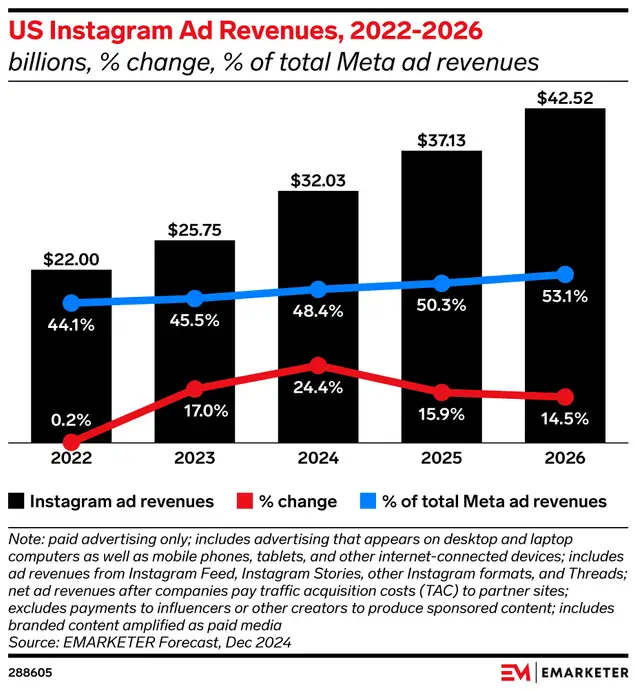
18. Instagram will generate over $42 billion in US ad revenue in 2026
In 2026, Instagram is projected to generate $42.52 billion in US ad revenue, putting its share of Meta’s total US ad revenue at 53.1%, according to Emarketer.

If you’re running ads on Instagram, staying on top of creative quality, bidding strategies and audience refinement is critical to maintaining strong ROAS as competition intensifies.
19. Instagram Story ads are cheaper than Instagram feed ads
According to WebFX, the average cost-per-click for Instagram feed ads is around $3.35, compared with about $1.83 for Story ads. Story clicks are often cheaper because the format is immersive, full-screen and built for quick interaction. While lower CPC does not automatically mean better performance, it does make Stories a smart format to consider when you want cost efficiency and mobile-native placement.
20. Instagram offers a lower click-through rate than other social platforms
WebFX data also shows the average CTR on Instagram ranges from 0.22% to 0.88% for feed ads and 0.33% to 0.54% for Story ads. If your only goal is to drive clicks as cheaply and directly as possible, Instagram might not be the best platform.
Its visual-first nature makes it stronger for awareness, interest and product discovery. Your creative and landing page strategy matter more if you’re optimizing for traffic or direct response.
21. Instagram delivers the highest ROI for most marketers
According to HubSpot, 48% of marketers say Instagram delivers the highest ROI of any social platform in 2026. For marketers, this is one of the strongest arguments for keeping Instagram in the mix. The combination of strong engagement, effective ads, shopping features and influencer partnerships creates multiple pathways to revenue.
Instagram Reels and Stories statistics
Reels and Stories now shape the Instagram experience. They’re central to how people watch, share, react and discover content. These Instagram Reels and Instagram Stories stats help explain why short-form video keeps pulling more attention (and more ad dollars).
22. The average Reel generates over 90 shares and 475 likes
According to Statista, the average Instagram Reel in 2025 generated more than 90 shares and 475 likes. Reels also typically received 18 comments and just under 39 saves.
Social media shares matter because they show your content is worth passing along. If your brand wants more reach and stronger viral potential, Reels are still one of the best ways to get there.
Check out our Instagram Reel ideas guide to create captivating Reels and keep up with the competition.
23. Reels make up for over 50% of the daily time spent on Instagram
According to Meta’s internal data, Reels account for more than half of the total time users spend on Instagram each day. If your brand isn’t creating Reels consistently, you’re almost invisible for over half of users’ Instagram sessions. This doesn’t mean every piece of content needs to be a Reel, but it does mean your content calendar should prioritize the format.
24. Reels attract more comments than carousels or static images
Based on Socialinsider’s data, Reels generate about 45% more comments than carousels and nearly twice as many comments as static image posts.
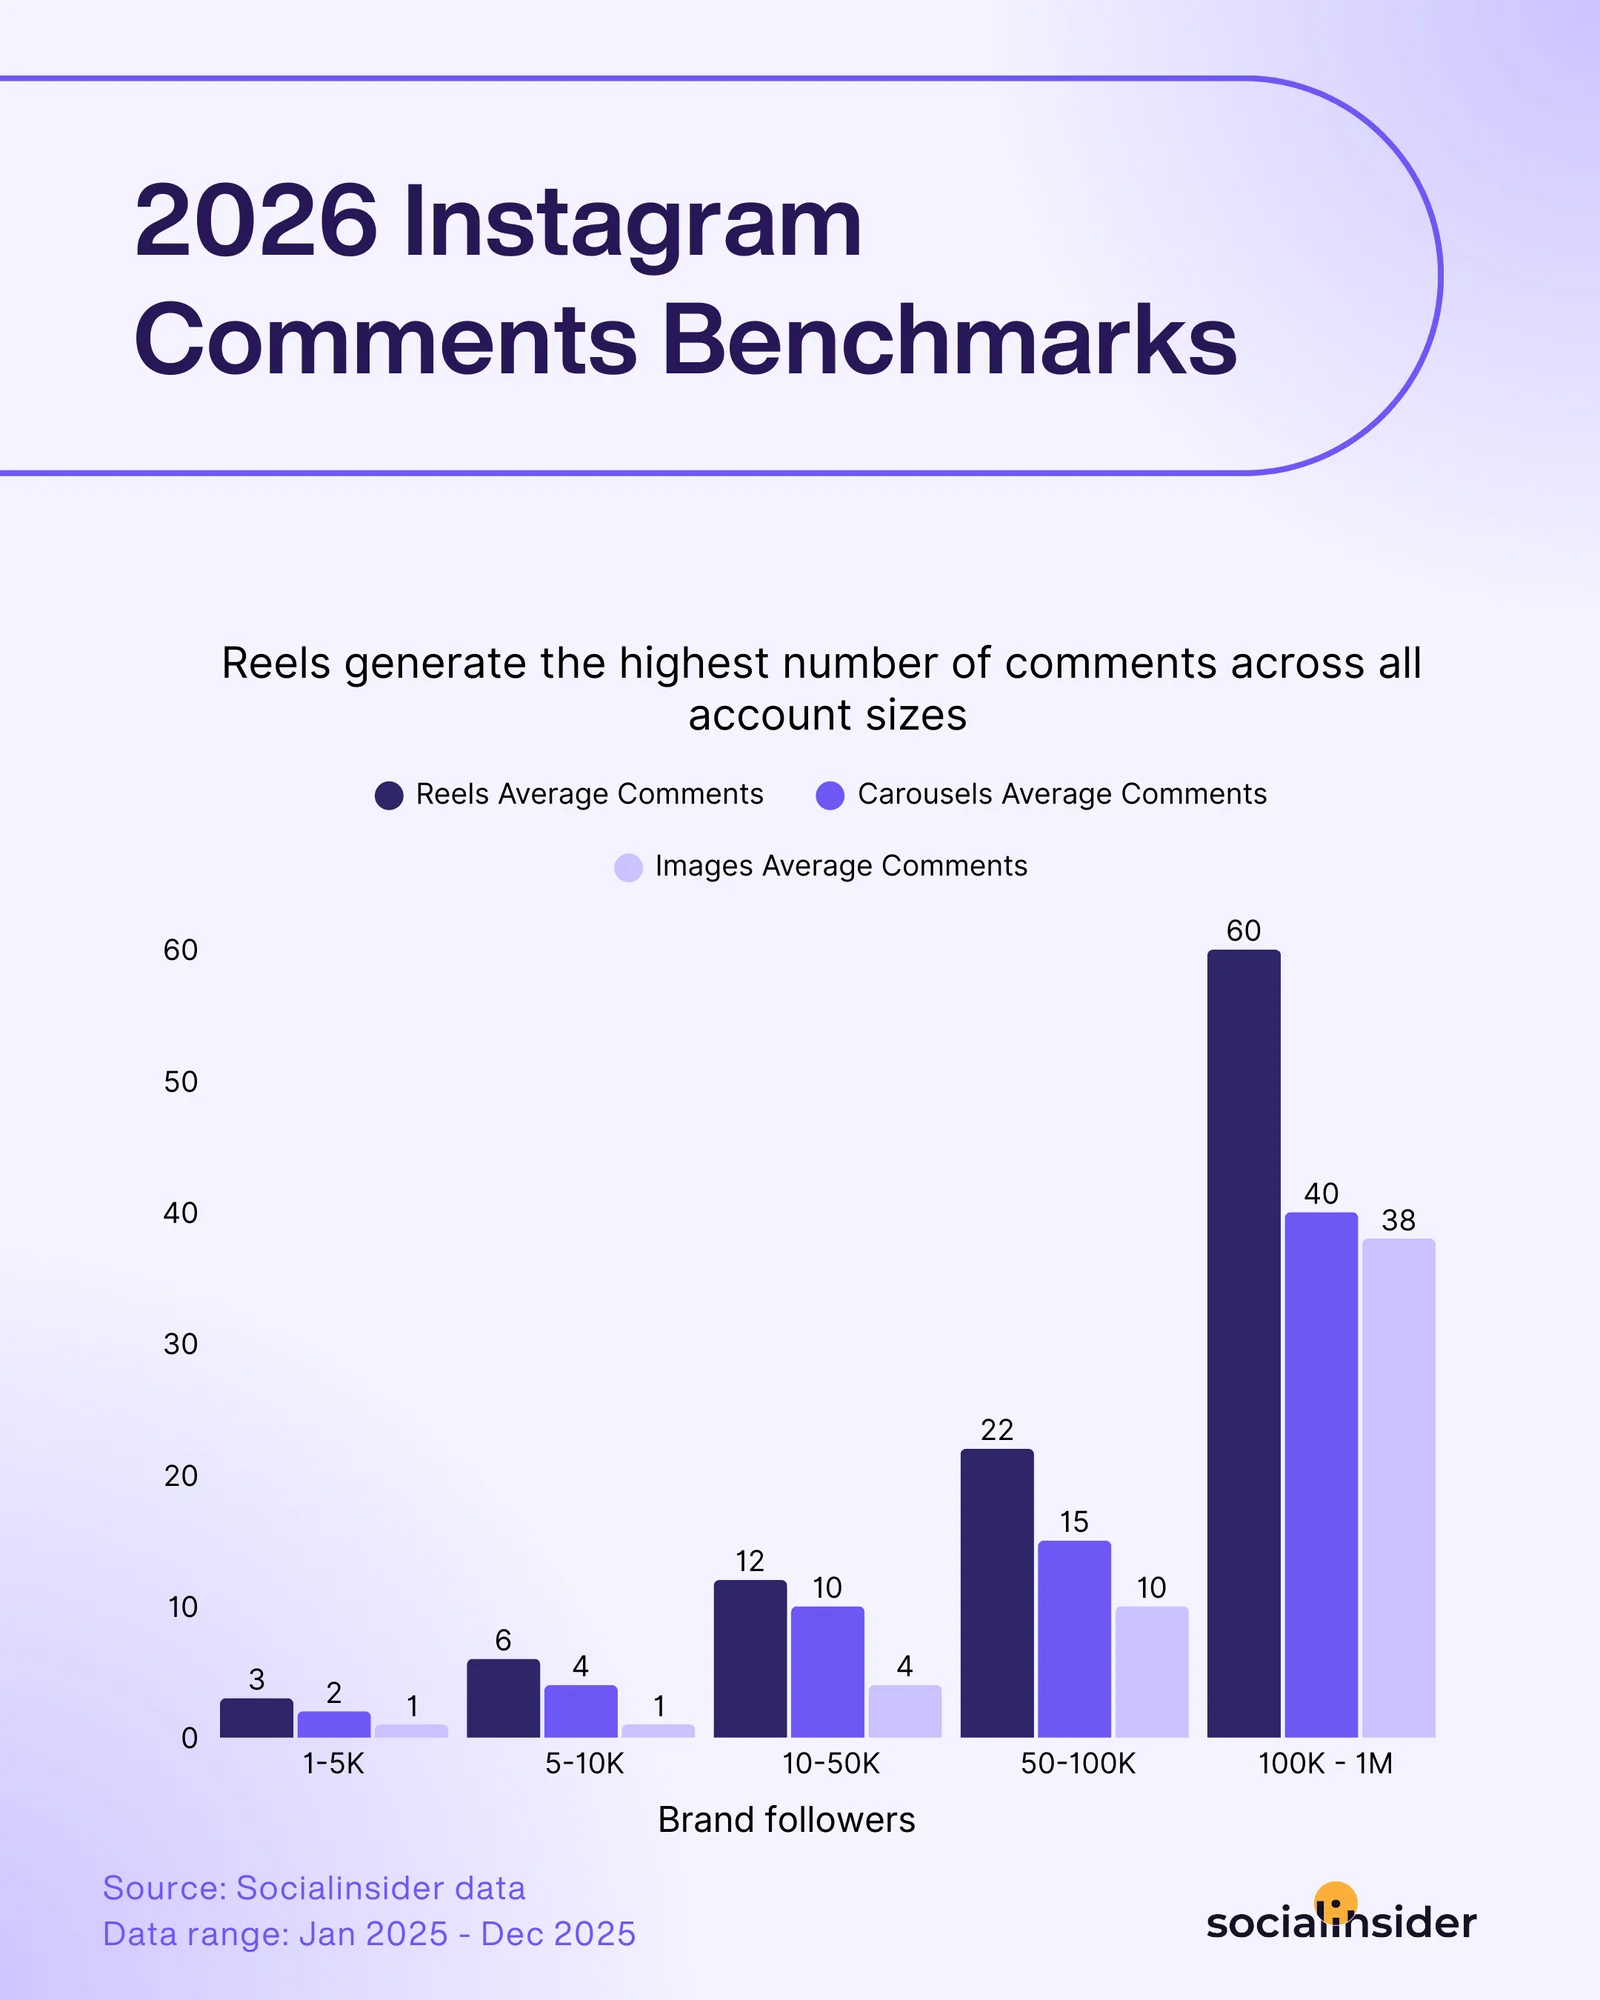
If your goal is to spark conversation, Reels offer an obvious advantage. They’re especially useful for opinion-led content, trend participation and creator-style storytelling.
25. Over half of Instagram ads now run on Reels
In Q4 2025, 53% of all Instagram ad placements ran on Reels, according to Emarketer. That means marketers need to get comfortable building creative that feels native to vertical video, because this format is becoming central to both attention and monetization on Instagram.
26. More than 500 million people use Instagram Stories each day
Meta says more than half a billion people use Instagram Stories daily. They may not get the same hype as Reels, but they remain one of the best formats for timely updates, behind-the-scenes glimpses, links, polls, reminders and casual content.
Check out our Instagram Story ideas for brands and creators.
Instagram for business statistics
These Instagram for business stats highlight how brands are using the platform, how consumers are engaging with their content and why Instagram is central to modern marketing, sales and customer service.
27. Over half of all Instagram users interact with brands regularly
According to Sprout’s 2026 Social Media Content Strategy Report, 60% of consumers interact with brand content on Instagram at least multiple times a week.
More than a sporadic occurrence, brand engagement on Instagram is a consistent behavior for the majority of users. This also means your content is competing against other brands for attention. Consistency, quality and relevance are the differentiators.
28. Instagram is one of the top social platforms for making purchases
The 2025 Sprout Social Index™ found that 29% of users make purchases on Instagram. This makes it the third-most-used social platform for making a purchase. For Gen Z specifically, it is the second most popular shopping destination after TikTok.
Instagram doesn’t just inspire buying decisions; it supports purchase actions. Thanks to Instagram Shopping features, users quickly go from discovering products to buying them, all within the same platform.
29. Around 78% of social media marketers use Instagram
Statista reports that 78% of social media marketers use Instagram. That rises to 85% for B2C marketers, while 71% of B2B marketerss also use the platform.
Yes, Instagram is especially popular with consumer brands. But B2B marketers are also using the platform for thought leadership, employer branding and influencer partnerships.
30. Around 70% of marketers plan to invest more in Instagram in 2026
Sprout’s research shows around 70% of marketers plan to increase their investment in Instagram in 2026. Brands are not pulling back from Instagram; they’re doubling down. That means competition for attention will keep rising, and marketers will need stronger creative, sharper positioning and granular measurement to stay on top.
31. Short-form video is the most popular brand content on Instagram
According to Sprout Social’s data, 52% of social users prefer short-form video (i.e., Reels) over any other brand content type on Instagram.
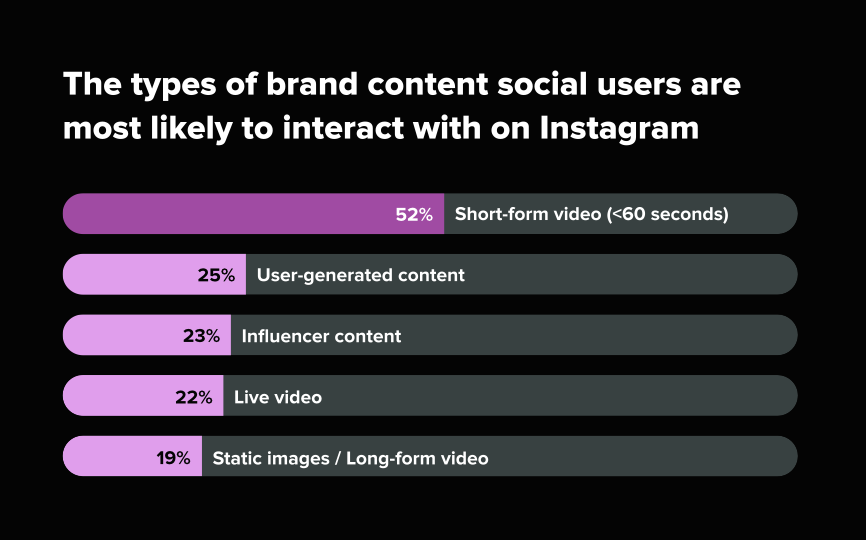

But the second and third preferences—user-generated content (25%) and influencer content (23%)—are equally telling. The best Instagram strategies in 2026 will combine all three: Reels that showcase your product or story, UGC that builds trust and social proof, and influencer partnerships that extend your reach to new audiences.
Check out these ideas for engaging Instagram content.
32. About 25% of users turn to Instagram for customer care
Instagram usage among consumers goes beyond finding and buying products. People are also turning to the platform for their customer support needs.
Based on The 2026 Social Media Content Strategy Report, about a quarter are most likely to use Instagram for customer care over any other channel. This highlights the need to ramp up your social media customer service efforts with Instagram as a key channel.
Instagram influencer statistics
Influencer marketing and Instagram have been inseparable for years, and that relationship is only deepening. As brands shift more budget toward influencer partnerships, it’s important to understand where influencer activity is concentrated and how it’s evolving.
Here are some influencer marketing statistics to know for Instagram.
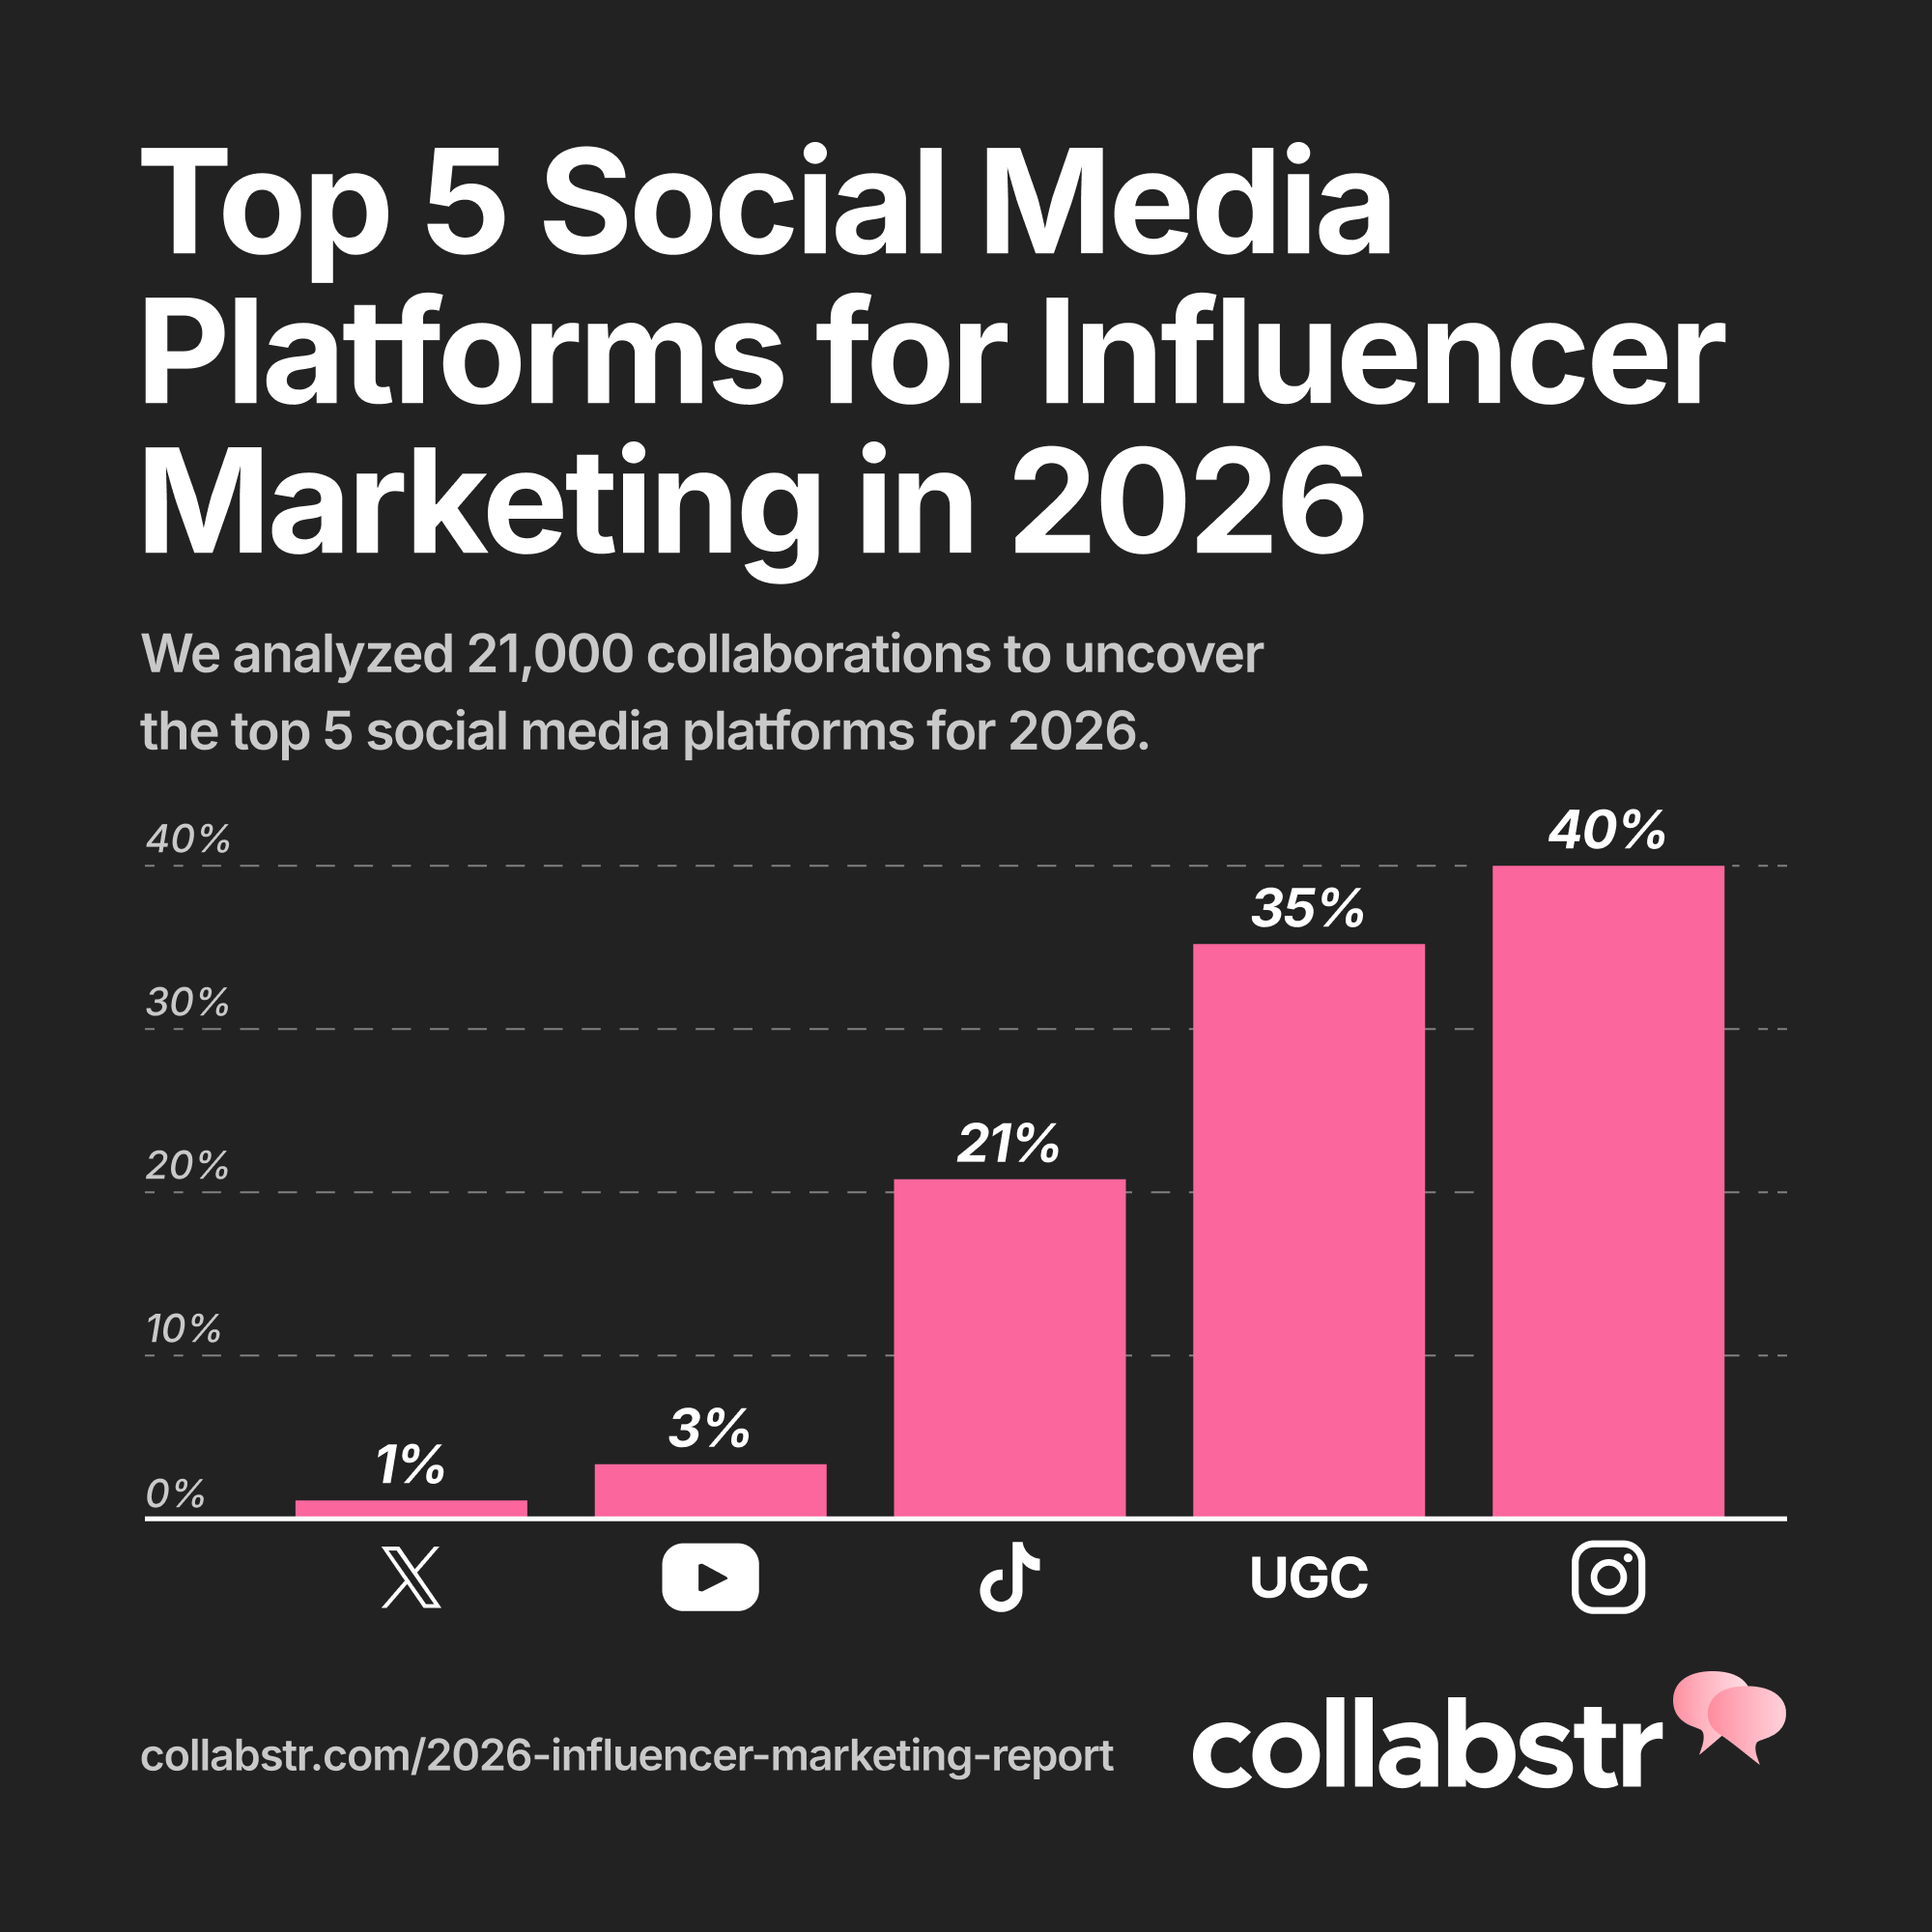
33. Instagram is the #1 platform for influencer marketing
According to Collabstr, 40% of all influencer collaborations in 2025 happened on Instagram, making it the top platform for influencer marketing.

For brands, that makes Instagram a flexible platform for everything from awareness campaigns and affiliate-style partnerships to product launches and UGC-style creatives.
34. Most Instagram influencers’ audiences are between 25-34 years old
Understanding audience demographics helps brands align influencer partnerships with their target customers. According to our 2025 Sprout Social Influencer Marketing data:
- 43.6% of Instagram influencers’ audiences are between the ages of 25 and 34, making this the largest segment.
- 28.92% fall into the 18-24 age bracket, showing Instagram influencers’ popularity among younger users.
- Only 5.48% of Instagram influencers’ audiences are 45+. This shows that the platform is generally less effective at targeting older demographics for influencer marketing.
35. Carousels drive the highest engagement of Instagram influencer posts
Engagement rate is a critical metric when assessing an influencer’s impact, as it reflects audience interaction and authenticity. Data from Sprout Social Influencer Marketing shows:
- The average engagement rate per post from an Instagram influencer in 2025 was 1.36%.
- Carousel posts had the highest engagement rate of 1.36%. In contrast, photo posts were at 1.04%.
- Reels from Instagram influencers saw the second highest engagement rate at 1.24%.
- Traditional video posts from influencers on the platform had the lowest engagement rate at 0.71%.
36. Nano-influencers on Instagram offer the highest engagement rate
According to Emarketer, Instagram nano-influencers with fewer than 10,000 followers have the highest engagement rate on the platform at 6.23%. Bigger reach does not always mean better results. On Instagram, nano-influencers can be especially valuable when you want stronger audience trust, more active communities and better engagement per post.
37. Nano- and micro-influencers provide cost-effective Instagram collaboration opportunities
Budgeting for influencer collaborations requires understanding the cost structures for different influencer tiers. According to our Sprout Social Influencer Marketing’s platform data, here’s what brands can expect to pay per Reel on average to Instagram influencers:
- Nano-influencers (1K-10K followers): $55
- Micro-influencers (10K-100K followers): $300
- Mid-tier influencers (100K-500K followers): $2,750
- Macro-influencers (500K-1M followers): $7,500
- Mega-influencers (1M+ followers): $75,000
- Celebrities: $150,000
Collaborating with nano- and micro-influencers is a no-brainer. Doing so has several benefits. Not only are they much more common to find and work with, but they’re also more affordable and tend to yield higher engagement as they target more niche audiences.
38. The US, Brazil and India lead in Instagram influencer engagement
Instagram influencers’ engagement varies by region, with some countries standing out in influencer interactions. According to our Sprout Social Influencer Marketing data, these were the top-performing countries by total Instagram influencer engagements in 2025:
- United States: 439 million engagements
- Brazil: 309 million engagements
- India: 220 million engagements
- United Kingdom: 74.1 million engagements
- South Korea: 68.4 million engagements
After the United States, Brazil and India are the next most popular audiences among influencers on Instagram. Brands with goals around reaching these countries should consider Instagram influencers to reach target audiences that are local to these areas.
The impact of not just meeting a buyer’s interest but also relating to their local culture plays a key role in building brand trust and loyalty.
Use these Instagram statistics to shape your strategy
Instagram keeps proving it’s more than a place to post pretty content. It’s where people discover brands, engage with creators, research products, get support and make buying decisions.
For marketers, that makes it one of the most important platforms to watch and invest in. Use these Instagram stats to build better content and stronger campaigns that people engage with.
Ready to put those insights into action? Try Sprout Social free for 30 days to plan, publish, analyze and optimize your Instagram strategy all in one place.
Instagram stats FAQs
How to see Instagram stats?
To see Instagram stats, switch to a professional Instagram account and open Insights. There, you can track reach, engagement, audience growth and content performance. You can also use a third-party tool like Sprout Social for deeper Instagram analytics and cross-platform reports.
How effective are Instagram Reels for marketing?
Instagram Reels are highly effective for marketing because they drive strong reach and engagement. Reels account for more than 50% of time spent on Instagram and average 0.52% engagement, just behind carousels.
How has Instagram influenced social media?
Instagram has shaped social media by making it more visual, creator-led and video-first. It also helped make short-form content central to how people discover brands and products. With 3 billion monthly active users, Instagram’s influence is still massive.
What generation uses Instagram the most?
Gen Z and younger Millennials use Instagram the most. Globally, the biggest age group is 25–34, followed closely by 18–24 year olds.
What is the breakdown of Instagram users?
Instagram’s global audience skews slightly male, with about 52.5% men and 46.4% women. In the US, it skews slightly female. The biggest audience segment is between the ages 25–34.
What do the navigation stats mean on Instagram?
Instagram navigation stats show what people did next after viewing your content. They help you understand whether people moved forward, went back, exited or kept engaging with your Story or post.
Who is the most followed person on Instagram?
Cristiano Ronaldo is the most-followed person on Instagram. As of March 2026, the account has 672 million followers.

Share