How to mine your social media data for a better ROI


Written by Brent Barnhart
Published on August 28, 2018
Reading time 8 minutes


Modern social media is a far cry from the “shiny new toy” it was a decade ago.
From customer service to social selling, there’s a reason why brands both big and small are upping their investments in social media at large. According to our recent survey of 250 business executives, 72% are currently using social media as a source of data and insights to inform their company’s business decisions.
That said, there’s still plenty of skepticism and struggle among brands when it comes to their ROI.
Maybe your boss wants proof that this whole “social” thing is paying off. Perhaps you find yourself pouring more and more time into social without stepping back and asking “Why?”
The good news? Nailing down your ROI doesn’t have to mean going down some sort of endless rabbit hole.
Instead, you just need to dig into your social media data.
In this guide, we break down how to make sense of your social media data and most important metrics. No matter what platform is your main focus, a data-driven approach to social media can translate your valuable time into actual results.
What is Social Media Data, Anyway?
Metrics. Statistics. Ups and downs.
In short, social media data is the collected information from social networks that show how users share, view or engage with your content or profiles.


These numbers, percentages and statistics provide actionable insights concerning your social media strategy.
Some examples of raw social media data can include:
- Shares
- Likes
- Mentions
- Impressions
- Hashtag usage
- URL clicks
- Keyword analysis
- New followers
- Comments
And while this list only scratches the surface, these sort of data points are critical to defining your social strategy.
Meaningful Social Media Data vs. Vanity Metrics
Before we get too into the weeds, let’s quickly break down the distinction between meaningful social data versus vanity metrics.
In the heyday of social media, marketers were obsessed with vanity metrics such as follower counts and likes. These sort of data points might look impressive at a glance but mean very little on their own.
What do your thousands of followers mean if they aren’t translating into dollars and cents? What’s the point of publishing content if nobody’s engaging with it?
On the flip side, a holistic approach to your social media data makes your presence actionable.
For example, if you have a post that reaches near-viral popularity, perhaps you should focus your energy or creating similar sorts of content.
Or if you get an influx of clicks from a certain hashtag, maybe you should start using it more often.
The takeaway here is that it’s easy to get carried away with your social media data with points without really understanding what they mean in context. That’s why not only does your data matter, but so does how you analyze it.
How Does Analyzing Social Media Data Work?
Once social media data is collected, it’s measured or analyzed to see what is and isn’t working.
Brands are gathering data around the clock, by the way.
Every time someone likes a post or engaging your brand, that’s a data point.
Social media data is the raw source you get when you mine or analyze your social networks. With this data, you can then use social media analytics to make sense of all that raw information.


Think of social media data as the ingredients of your meal and the analysis as your recipe. Without the recipe, you wouldn’t know what to make or how to cook it. The more data you’re able to collect, the more informed decisions you can make, all leading to a better result.
Marketers and advertisers sometimes approach social media by throwing ideas against the wall, hoping that something sticks.
But collecting and measuring social data gives you insights to social shares and engagement. This is especially important for accountability and providing proof to higher-ups on what you need to be doing via social.
Now, let’s get to the bread and butter of this piece: how to successfully mine your social media data and measure your ROI.
Find Your Core Social Media KPIs
Based on the previously noted Social Index, 60% of marketers aren’t having regular conversations about social ROI with their higher-ups.
But before you can define your social ROI, you need to first define your key performance indicators (KPIs). These are the various business metrics used to measure and define success for your business. Social media KPIs are the metrics that can clue you in on what’s producing results and what isn’t.
Simply put, you have to know what social media KPIs you need to track and analyze. Only then can you understand how your social strategy is performing by the numbers.
For example, some core KPIs for brands include audience reach, customer engagement and response times.

Tracking Unique Metrics from Each Platform
No matter the platform, you want to have a solid understanding of how well each network performs. Social networks return the favor by offering their own native analytics.
Let’s take a look at the most popular native tools below.
Facebook Insights
For those who own a Facebook business page, you can analyze some KPIs within the social network. The most essential Facebook metrics include:
- Engagement: This metric shows you the number of post clicks, Likes, comments and shares within the last seven days. Additionally, the data is compared to the previous week.
- Impressions: The number of times your Facebook Page is displayed, including those who click and do not click your content or Page.
- Organic Likes: The number of people who Like your Page without coming from an ad campaign.
- Page Likes: This metric shows the total amount of Page Likes and new Page Likes with weekly data comparisons as well.


- Paid Likes: The number of people who Like your page directly from a paid ad campaign.
- Post Reach: This metric shows your total reach, which is the number of people who have seen any content or ads associated with your Page. There’s also Page Reach, which is the amount of views (impressions) for your Page posts.
- Reactions: This metric shows the different reactions users posted to your post, including Like, Love, Haha, Wow, Sad and Angry.
- Unlikes: The number of people who unliked your Facebook Page.


Instagram Insights
Native Instagram Insights are broken down into two sections, with metrics focused on individual posts and data on your profile as a whole:
- Account Impressions: The number of times your posts and Stories were viewed.
- Total Reach: This metric tracks how many unique accounts viewed your posts and Stories.
- Website Clicks: This metric tracks how many clicked on your bio link.
- Profile Visits: The number of clicks to your account page.


- Post Likes: The number of likes any given post receives.
- Post Comments: The number of comments accumulated on any given post.
- Posts Saved: This metric tracks how many unique accounts saved your post
- Follows: This tracks how many accounts started following you over a period of time.
Twitter Analytics
Whether you use Twitter for business or personal use, you have access to their analytics just by having an account. The dashboard gives you a 28-day summary of your content and other key Twitter data. Here are some of the most important Twitter metrics to follow:
- Engagement Rate: Total link clicks, Retweets, favorites and replies on your Tweet divided by total impressions.
- Followers: Total number of Twitter followers.
- Link Clicks: Total number of URL and hashtag links clicked.
- Mentions: How many times your @username was mentioned by others.


- Profile Visits: Total Twitter profile visits.
- Replies: How many times people replied to your Tweets.
- Retweets: Total Retweets received by others.
- Tweet Impressions: Total of times your Tweet has been viewed whether it was clicked or not.
- Tweets: How many Tweets you’ve posted.


LinkedIn Analytics
Another popular social media platform with built-in analytics tools is LinkedIn. You can access LinkedIn Analytics through your Company Page. This shows you all the social media data going into your LinkedIn Page. Here are the top LinkedIn metrics:
- Clicks: Total clicks on a post, company name or logo.
- Engagement: Total interactions divided by the number of impressions.
- Followers: Total number of new followers through a sponsored update.
- Impressions: Total times your update was visible to other users.
- Interactions: Total number of comments, likes, comments and shares.

Google Analytics
While the other platforms provide helpful insights, Google Analytics steps up your data game. Here you can learn about product sales, leads, guide downloads, duration times and much more. When it comes to social media data, there are a few metrics to note in Google Analytics:
- Average Session Duration: Average session times users spend on your site.
- Bounce Rate: Percentage of users leaving your site after a single view.
- New Users: Total number of new users coming to your site for the first time.


- Pages / Session: Average number of pages a user views each session.
- Pageviews: Number of pages loaded or reloaded in a browser.
- Sessions: Total times when users are active on your site.


Define Your Least & Most Important Metrics
Now that you have your social media data, you need to decipher what you should consider your most important metrics.
For brands laser-focused on customer service, mentions and response times are going to be top priorities.
Meanwhile, those involved with content marketing and social selling will want to know which posts are driving the most clicks and where those clicks are coming from.
And finally, raising brand awareness means maximizing your visibility in the form of new followers and engagement.
While the social media metrics that matter varies from business to business, the end-game is the same. That is, turning your metrics into action.
Building a successful social media presence takes time. Once you have the data, though, you can then figure out how to use it.


Use Social Media Analytics Tools to Make Decisions
One of the most important things about collecting social media data is having enough information to make a confident business decision.
Customer and community insights are essential for any business objective. From figuring out what content your customers want to see to community management, you need to make your decisions by the numbers.
Sprout’s suite of social media analytics tools provides you presentation-ready reports on each and every major social network.
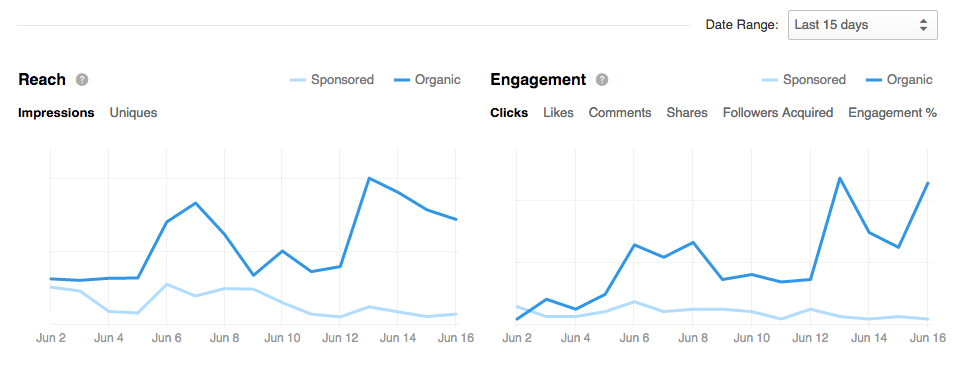
For example, the Twitter Activity Overview provides in-depth analysis into your Twitter feeds.
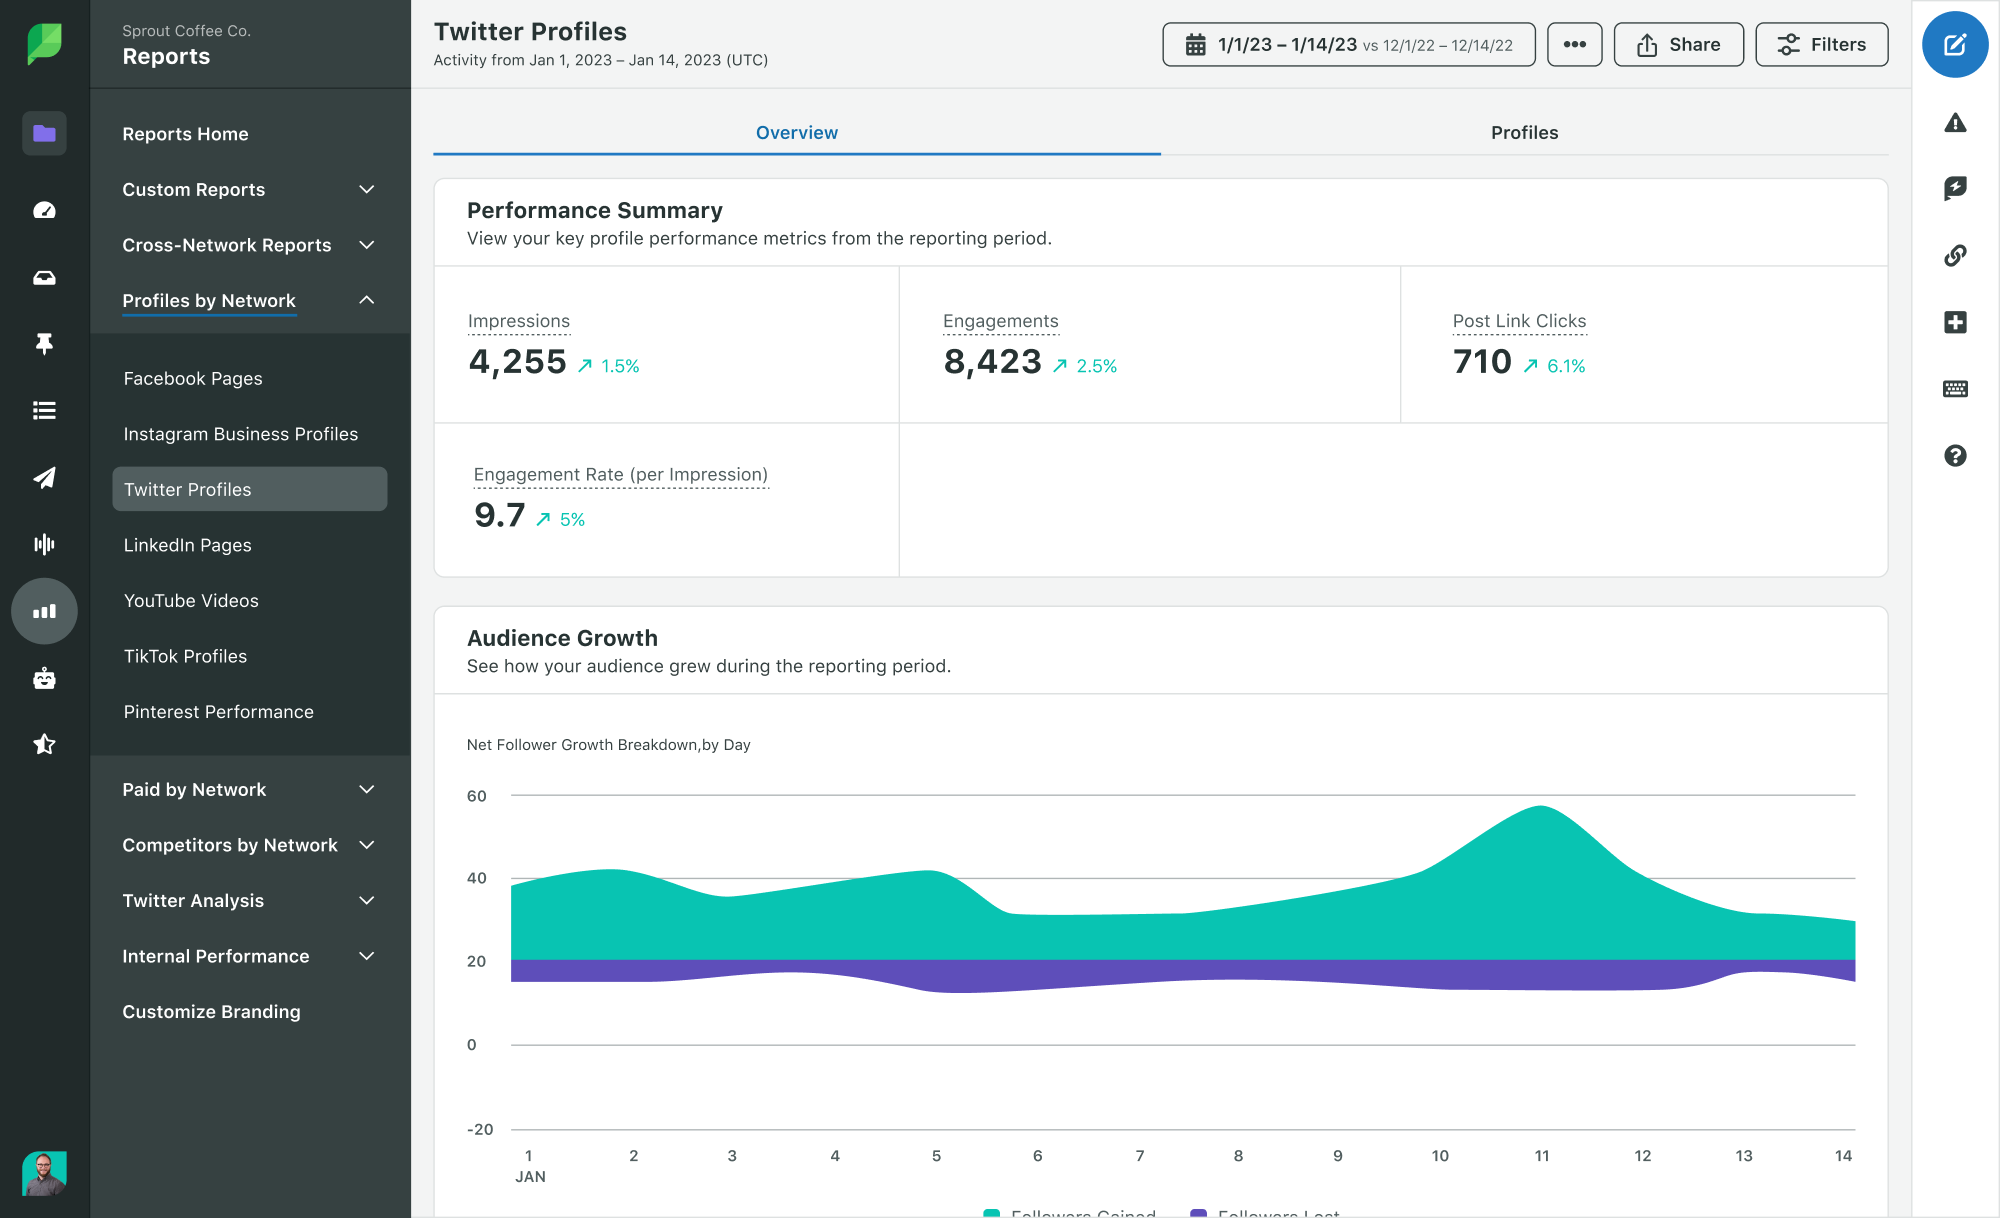
These tools give you a birds-eye-view of your Twitter profiles. They also help you understand your message-level analytics like clicks, reach and Retweets.
But it’s not just Twitter that you have to pay attention to as Instagram, Facebook and LinkedIn all have their place in your social strategy.
Want to figure out which hashtags on Instagram are going to give you the most reach? Need to know the best time of day to post to Facebook? Is your Twitter customer service speedy enough?
The data is out there regardless on which network you’re looking to dominate: it’s all a matter of doing some much-needed analysis.
Are You Making the Most of Your Social Media Data?
Data-driven marketing is an expectation, not an exception to the rule. By collecting social media data with the help of platforms like Sprout, you can make smarter business decisions without second-guessing.
If you need more tips on getting the most out of the content you post, check out our free worksheet for improving content performance.
- Categories
The social media metrics to track in 2024 (and why)
Published on April 11, 2024 Reading time 20 minutes - Categories
The journey of a data point: Turning numbers into social media intelligence
Published on April 4, 2024 Reading time 15 minutes - Categories
How to use LinkedIn hashtag analytics to boost content reach
Published on March 28, 2024 Reading time 5 minutes - Categories
Reach vs. impressions: What’s the difference in terms?
Published on February 20, 2024 Reading time 6 minutes
Share