

Twitter Analytics
Twitter analytics: How to analyze and improve your Twitter data
Reading time 11 minutes
Published on July 18, 2023
Table of Contents
A Twitter (rebranded as "X") marketing strategy gives you the opportunity to reach millions of people and build an engaged community. But how do you know if your strategy is paying off? That’s where your Twitter analytics come in, providing you with essential data to assess your performance. This helps you figure out whether your strategy is working and what improvements you need to make.
In other words, Twitter analytics will help you make informed decisions to maximize outcome. That’s the same reason why social media analytics play such a vital role in your overall social media marketing efforts.
Fortunately, the platform offers an in-app analytics dashboard to track important performance metrics. In this guide, we break down the steps to use this dashboard and make the most of your Twitter insights. Let’s dive in.
What are Twitter analytics?
Twitter analytics are a set of data points on how your Tweets are performing and how your audience is responding. Your Twitter analytics dashboard shows you your profile growth in terms of visits, follows and mentions. It lets you keep track of Tweet analytics such as engagements, impressions, link clicks, replies and Retweets.

This data is critical for understanding who’s interacting with your Tweets and how your account is performing overall. Even if you log in daily and generally understand how the account is performing, it’s essential to put numbers to those feelings. You can then use these Twitter insights to refine your strategy.
How to access Twitter analytics
Every Twitter profile comes with free access to the native Twitter analytics dashboard. You can access the dashboard directly from https://analytics.twitter.com. Or follow the steps below to see your Twitter analytics.
How to view Twitter analytics from desktop
Step 1. From your Twitter homepage, click on the “More” button on the left-hand panel. This will open a list of options to access Creator Studio, Professional Tools and Settings and Support. Click on “Creator Studio” and then select “Analytics.”

Step 2. Selecting “Analytics” will instantly bring you to your native Twitter analytics dashboard. Here, you can get an overview of how your profile and Tweets have been performing. The 28-day summary section gives you an overview of your performance. This will show you metrics related to Tweet impressions, profile visits, mentions and followers.
Step 3. Scroll down and you’ll see the monthly breakdown of your performance. For each month, you can see your top Tweet, top mention, top follower and top media Tweet. You also get a summary of the number of Tweets, Tweet impressions, profile visits, mentions and new followers.

Step 4. Click on the “View all Tweet activity” button under your “Top Tweet” section. This will open more advanced analytics on how your Tweets have performed.
You’ll see a graph comparing how your Tweet impressions changed over the chosen period. You can also manually set the period you want to analyze.

How to view Twitter analytics from mobile
Twitter users have the option to view Twitter analytics from mobile devices. But keep in mind that you won’t get access to the full analytics dashboard on mobile that you would on desktop. You can only view analytics for individual Tweets.
To view your Tweet analytics on mobile, open the Tweet you want to analyze. Then tap on the “View Tweet analytics” button at the bottom. This will give you a comprehensive look at different performance metrics for the selected Tweet, such as impressions, engagements, detail expands and profile visits. It even shows you the number of new followers you gained as a result of that Tweet.

Who are Twitter analytics for?
Anyone with an interest in how their Twitter account is performing should use Twitter analytics. To view your analytics data, make sure you turn on analytics for your account via https://analytics.twitter.com.
Analytics are most useful to those with a vested interest in Tweet performance and engagement rates. This means social practitioners, managers and agencies who have goals based on certain key performance indicators (KPIs).
Twitter analytics can help them to determine the type of posts that are most interesting to their followers. These insights are crucial for optimizing their Twitter marketing strategies to maximize results.
Twitter analytics for practitioners
Social practitioners use Twitter to increase brand awareness and follower count. The platform helps them to grow and engage the brand’s communities.
Their goals include expanding to new audiences and creating demand for products and services. As such, they’re interested in driving traffic or content consumption. These practitioners need Twitter analytics to measure post performance, engagement and follower growth. Having a robust analytics tool will give them the opportunity to spend more time creating engaging content.
If you’re a practitioner, a Twitter analysis will help you understand how your Twitter posts are performing. You can drill down to the singular Tweet level to see each Tweet’s metrics.
You can also see your top Tweets to find out which ones resonate well with your audience. These insights will help you inform and optimize your strategy.

Twitter analytics for managers
Managers want to drive adoption and retention of products and services. As such, they use Twitter as a channel to bring in leads and push them through the sales funnel.
Their goals include increasing conversion rates, repeat purchases and cross-sell opportunities. At the same time, they want to use the platform for growing brand awareness and engagement. So it’s important for them to measure customer churn and retention along with campaign performance.
Managers will find Twitter analytics helpful because it measures the social ROI of paid and organic efforts. You get a comprehensive view of areas where you need to improve and understand how well your team is performing.
Twitter analytics for agencies
The goals and needs of agencies are a mix between those of managers and practitioners. They’re the ones creating, publishing and reporting for businesses. And they need to be able to collaborate with internal team members. Agencies have to measure similar metrics to practitioners while focusing on the goals of managers.
The Twitter activity data allows them to measure important performance metrics for the brands they work with. They can easily export the data from their Twitter analytics dashboard and share it with clients.
Twitter gives you the option to export data by Tweet or by day. So, you can build reports specific to business needs and help clients visualize the impact of your work.

What metrics can you track with Twitter analytics?
Let’s be honest, social media has its own language.
It’s easy to get overwhelmed by mentions, hashtags, impressions, interactions and everything in between.
The bottom line is you can’t measure something you don’t understand. So here are some of the most important metrics that you’ll find within the native Twitter analytics dashboard. We’ve also included other metrics to track using third-party Twitter analytics tools.
Impressions
The total number of times any user could have potentially seen a brand’s name or message.
Reach
The number of users who saw an impression of your post in their timeline.
Engagement
A Twitter user’s interaction with another user. This can come in the form of mentions, Retweets, favorites and new followers.
Engagement rate
Engagement rates are metrics that track how actively involved with your content your audience is. Engaged consumers interact with brands through likes, comments and social sharing.
The engagement rate is a useful metric for analyzing the efficacy of brand campaigns. People who spend time interacting with videos, updates and blogs are more likely to convert into paying customers. Engagement rates also have a subset of measurements like “sharing metrics.” This highlights the impact of your word-of-mouth marketing.
Link clicks
The total number of times people clicked on a link in a Tweet.
Mentions
The total number of instances where a Twitter user that is talking to you, or about you, mentions you in their Tweet.
Followers
The number of Twitter users that subscribe to your updates at any given time.
Response rate
Percent of inbound messages you respond to that warrant a response.
Response time
The amount of time it takes your business to respond to inbound messages.
Profile visits
The number of users who visited your profile within a given timeframe.
Top Tweet
The Tweet that earned the most impressions during a given month.
Top mention
The mention that earned the greatest number of engagements during a given month.
Top follower
Your most popular new follower based on the number of followers they have.
Top media Tweet
Your media Tweet—one that has an image, video or gif—that earned the most impressions during a given month.
Retweets without comments
The number of people who Retweeted you without adding a comment.
Likes
The number of likes that your Tweets received during a specified timeframe. It's the small heart icon below every Tweet.
Replies
The number of replies that your Tweets received during a specified timeframe.
How to maximize Twitter analytics with Sprout Social
Twitter analytics give you a wealth of information to create better content and reach new audiences. Here’s how you can use Sprout Social to maximize the insights from your Twitter analytics and inform your social strategy.
1. Identify your best content
Look at all the Tweets you’ve sent and identify which content has performed best. Use those insights to create content that’s more likely to resonate with your audience.
Access this data from the Post Performance Report. This gives you an overview of post-level performance across all your profiles. You can filter the report to only show the Twitter profile you want to review.
You'll see metrics like impressions and potential reach. In this report, you'll also see the engagements and engagement rate per impression for each post.
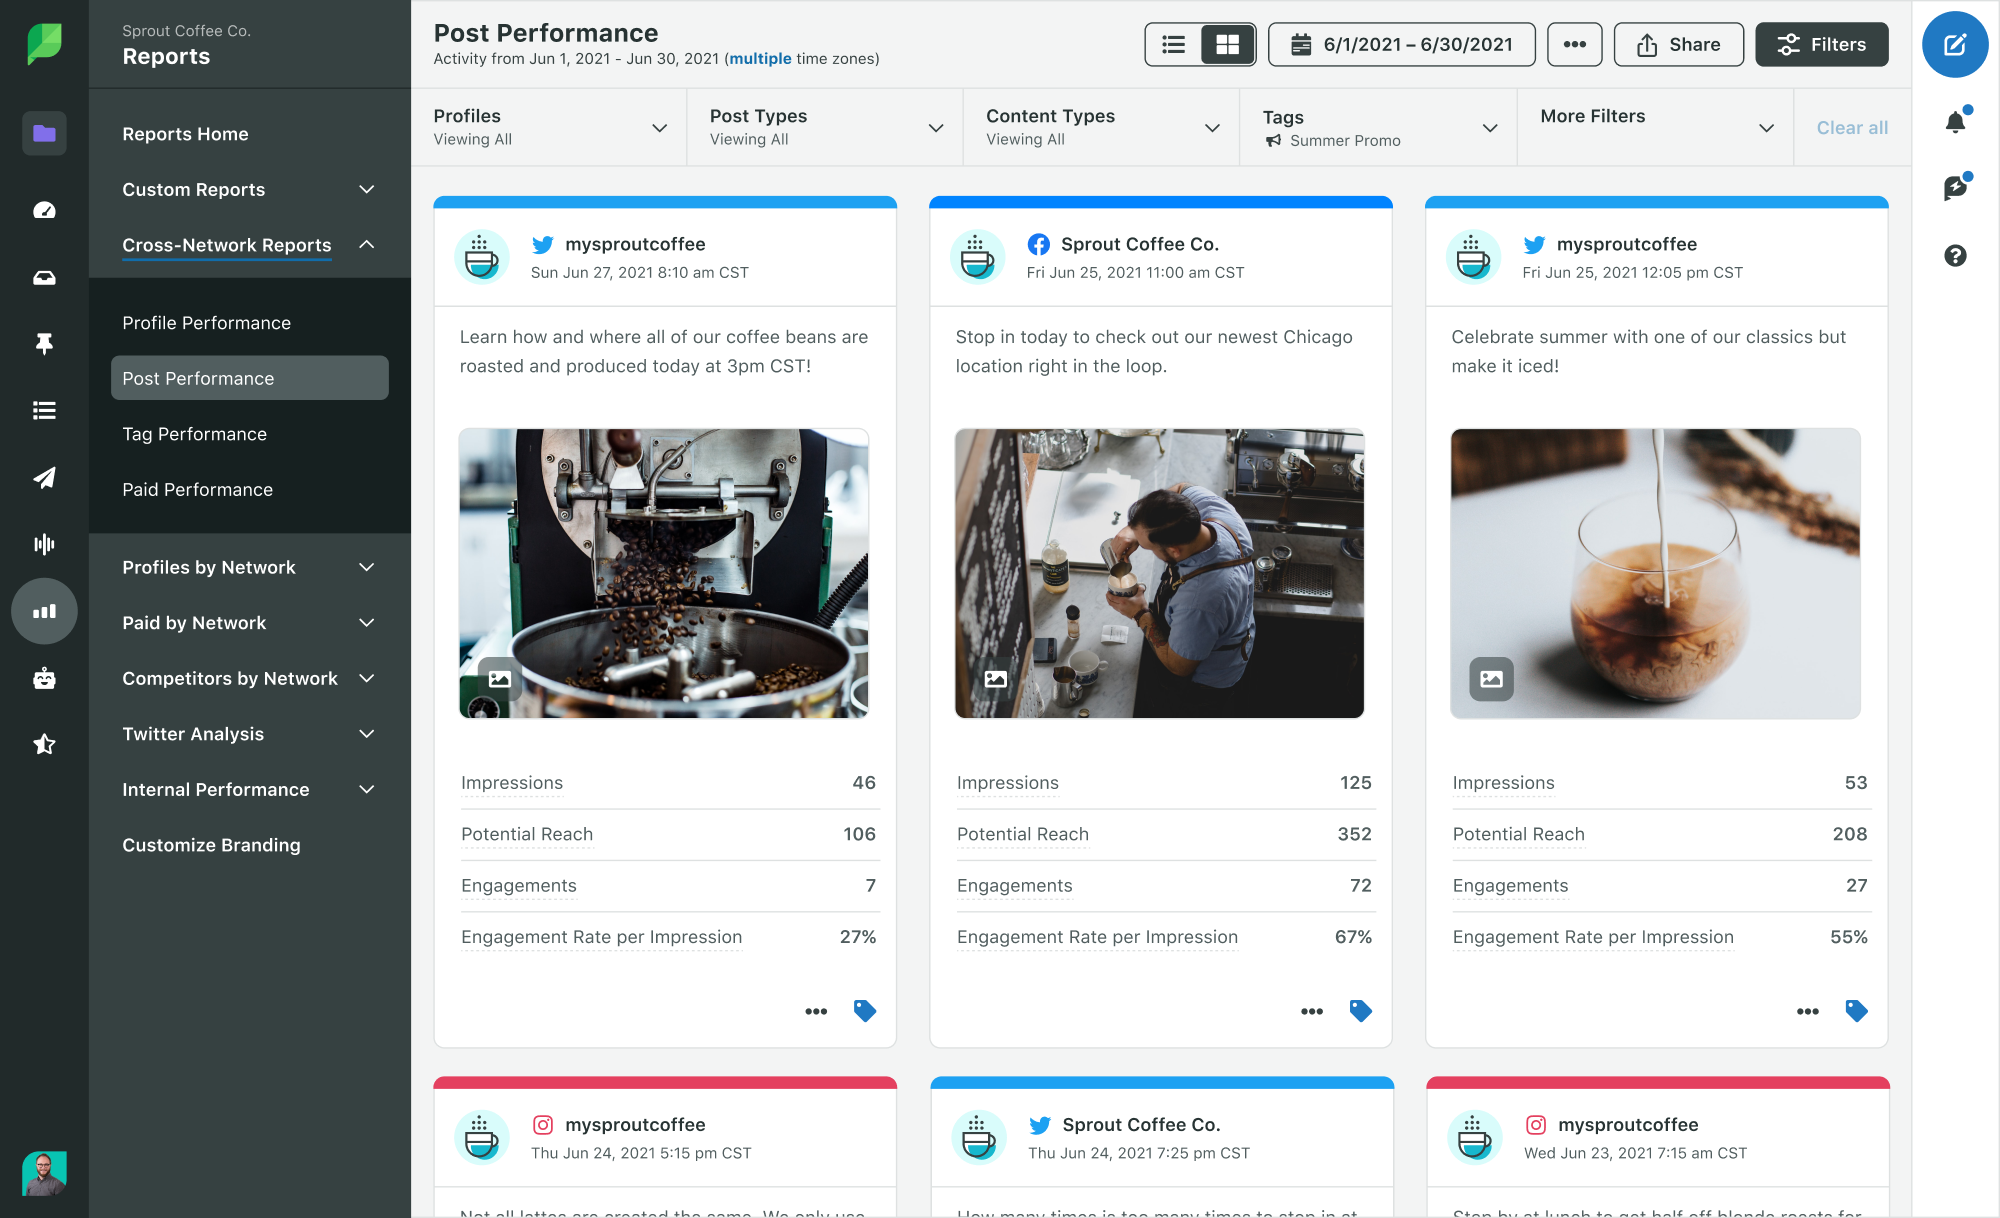
With this data, you can identify why these posts were so successful.
- Find common themes in those top Tweets. Did the Tweet contain a hashtag, mention or question? If so, think about including those in the future.
- Were there particular days or times that seem to work best with your audience? If so, schedule around those times in the future.
- Export your top Tweets and create a word cloud to more easily visualize messages that resonate.
2. Uncover trends in performance
Sprout lets you create different kinds of Twitter reports for a big-picture overview of your performance.
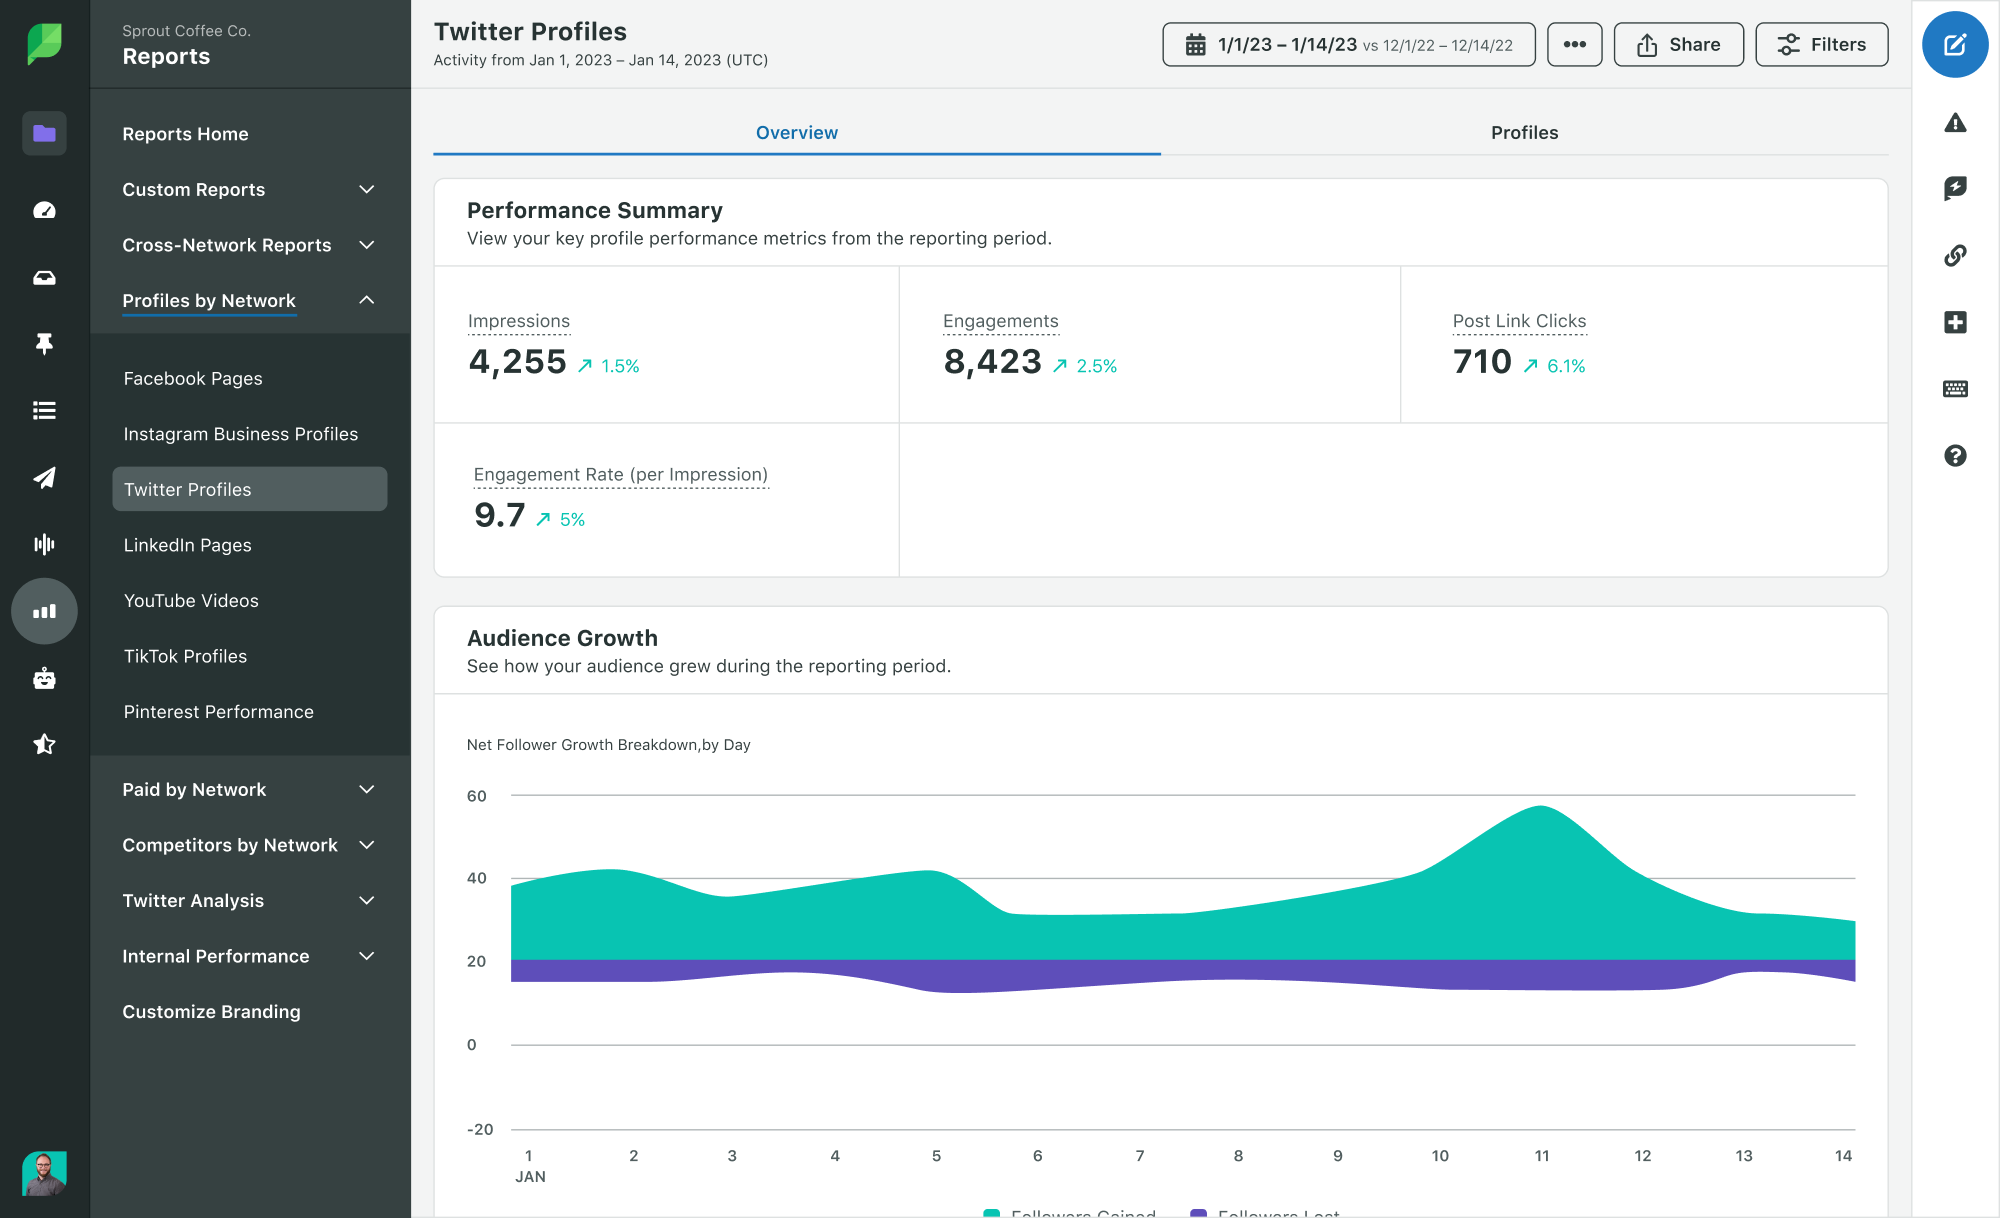
Your Twitter Profiles Report can reveal how your performance has changed over time. From your performance summary, you can track metrics such as:
- Engagements
- Replies
- Likes
- Retweets
- Other post clicks
- Post link clicks
Changes in these metrics indicate whether your strategy is working.
The Twitter Profiles Report includes a helpful graph of your audience growth during the reporting period. Use this to visualize how you gained or lost followers over time. Compare this against your strategy and activities to uncover patterns. For example, did you gain lots of followers after a Tweet went viral?
3. Analyze your competition
A social media competitive analysis is crucial to see how you stack up to the competition. The process helps you uncover what’s working for them and what strategies you can replicate. You can even identify any missed opportunities and weaknesses to capitalize on.
Sprout's Twitter Competitors Report makes it easy to compare key metrics against any Twitter profile. This gives you a comprehensive view of your competitors’ performance. You can then compare these metrics against your own profiles. You can even benchmark your performance against the industry average.
Use this report to visualize how your follower size and audience growth compare to that of your competition.
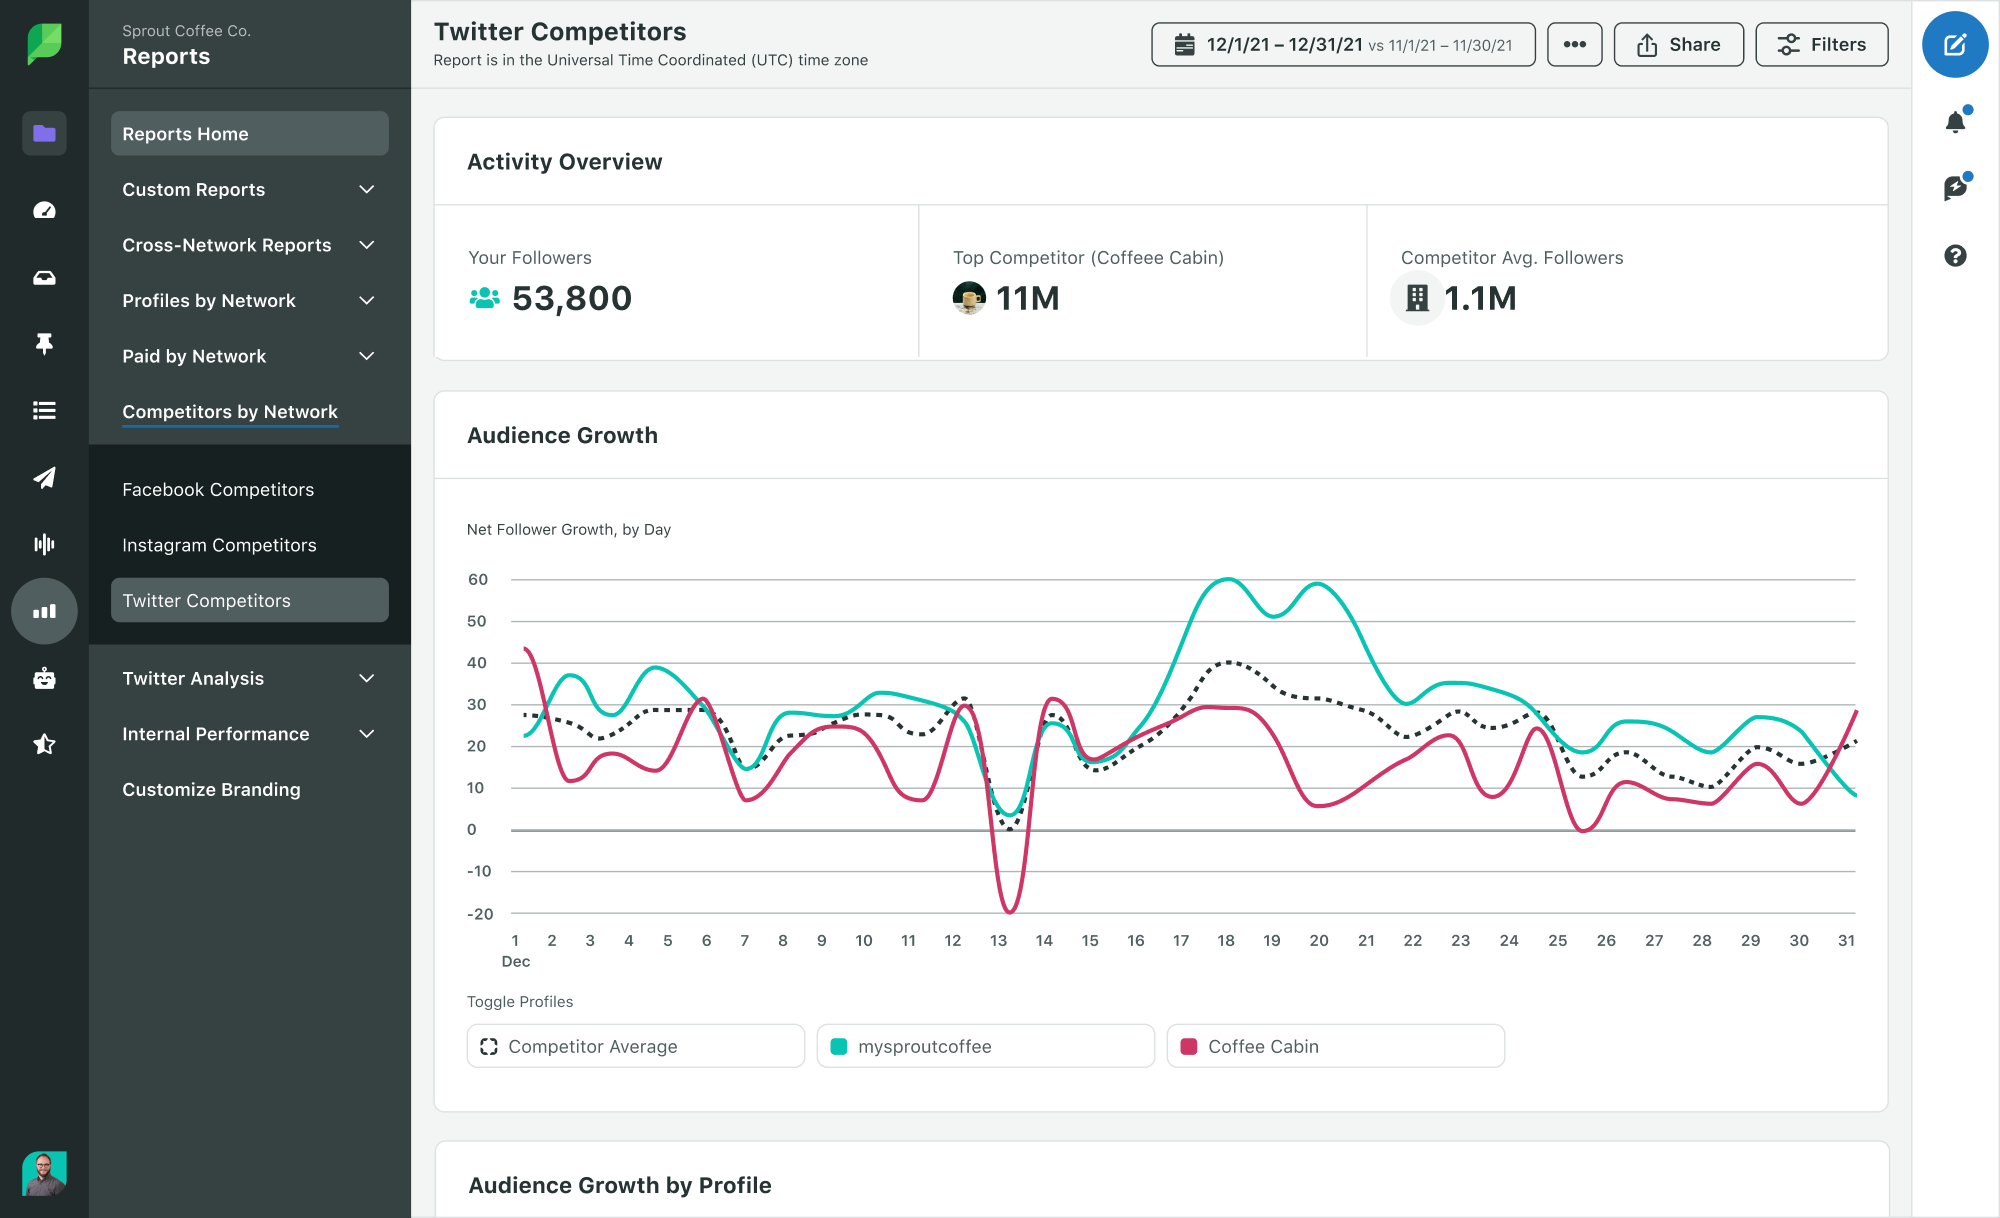
The Profiles tab in the Twitter Competitors Report gives you a side-by-side look at how you stack up to the competition. You’ll be able to compare important metrics such as:
- Impressions
- Engagements
- Engagement rate per impression
- Retweets
- Clicks
When you have enough data, analyze your competitors and think through how you can differentiate your presence. Ask questions like:
- Are they growing faster than you?
- When was the last time they posted?
- Are there long spans of time between each post?
- Do they respond to comments?
Get even more granular with your analysis by looking at the Competitor Posts dashboard. This gives you a breakdown of how each post from your competitor is performing. Use this to identify their top-performing posts and understand what resonates with the audience.

4. Report across multiple Twitter profiles
Looking at the performance of individual Twitter profiles is important. But you can even analyze multiple profiles at once if you have them. This provides additional data to guide your strategy.
Use the Overview in the Profile Performance Report to get a summary of your performance across your Twitter profiles. This will collectively calculate your impressions, engagements and link clicks across those profiles. The audience growth chart lets you compare how each of those profiles gained followers.
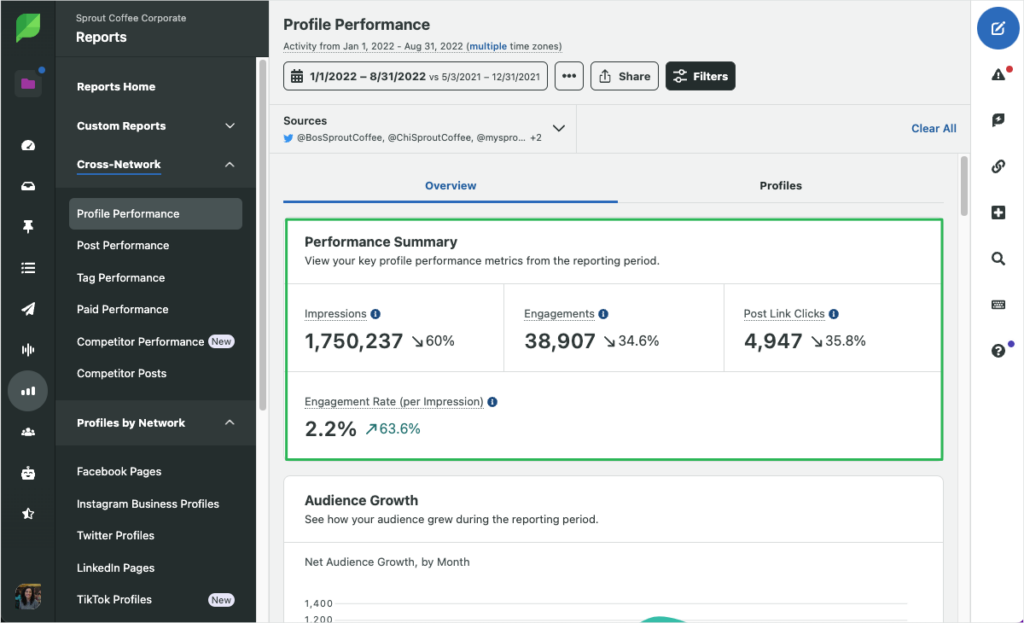
Additionally, you can use the Profiles tab to compare stats across your Twitter profiles.
Analyze all your Twitter efforts at a high level to get a better sense of your overall presence. Identify which profiles are outperforming and which need more love.
5. Understand your Twitter followers
The in-app Twitter analytics dashboard is helpful for analyzing your Twitter activity. But it no longer provides you with audience insights to analyze your Twitter followers.
Fortunately, Sprout offers a robust set of tools to get a better understanding of your followers on Twitter.
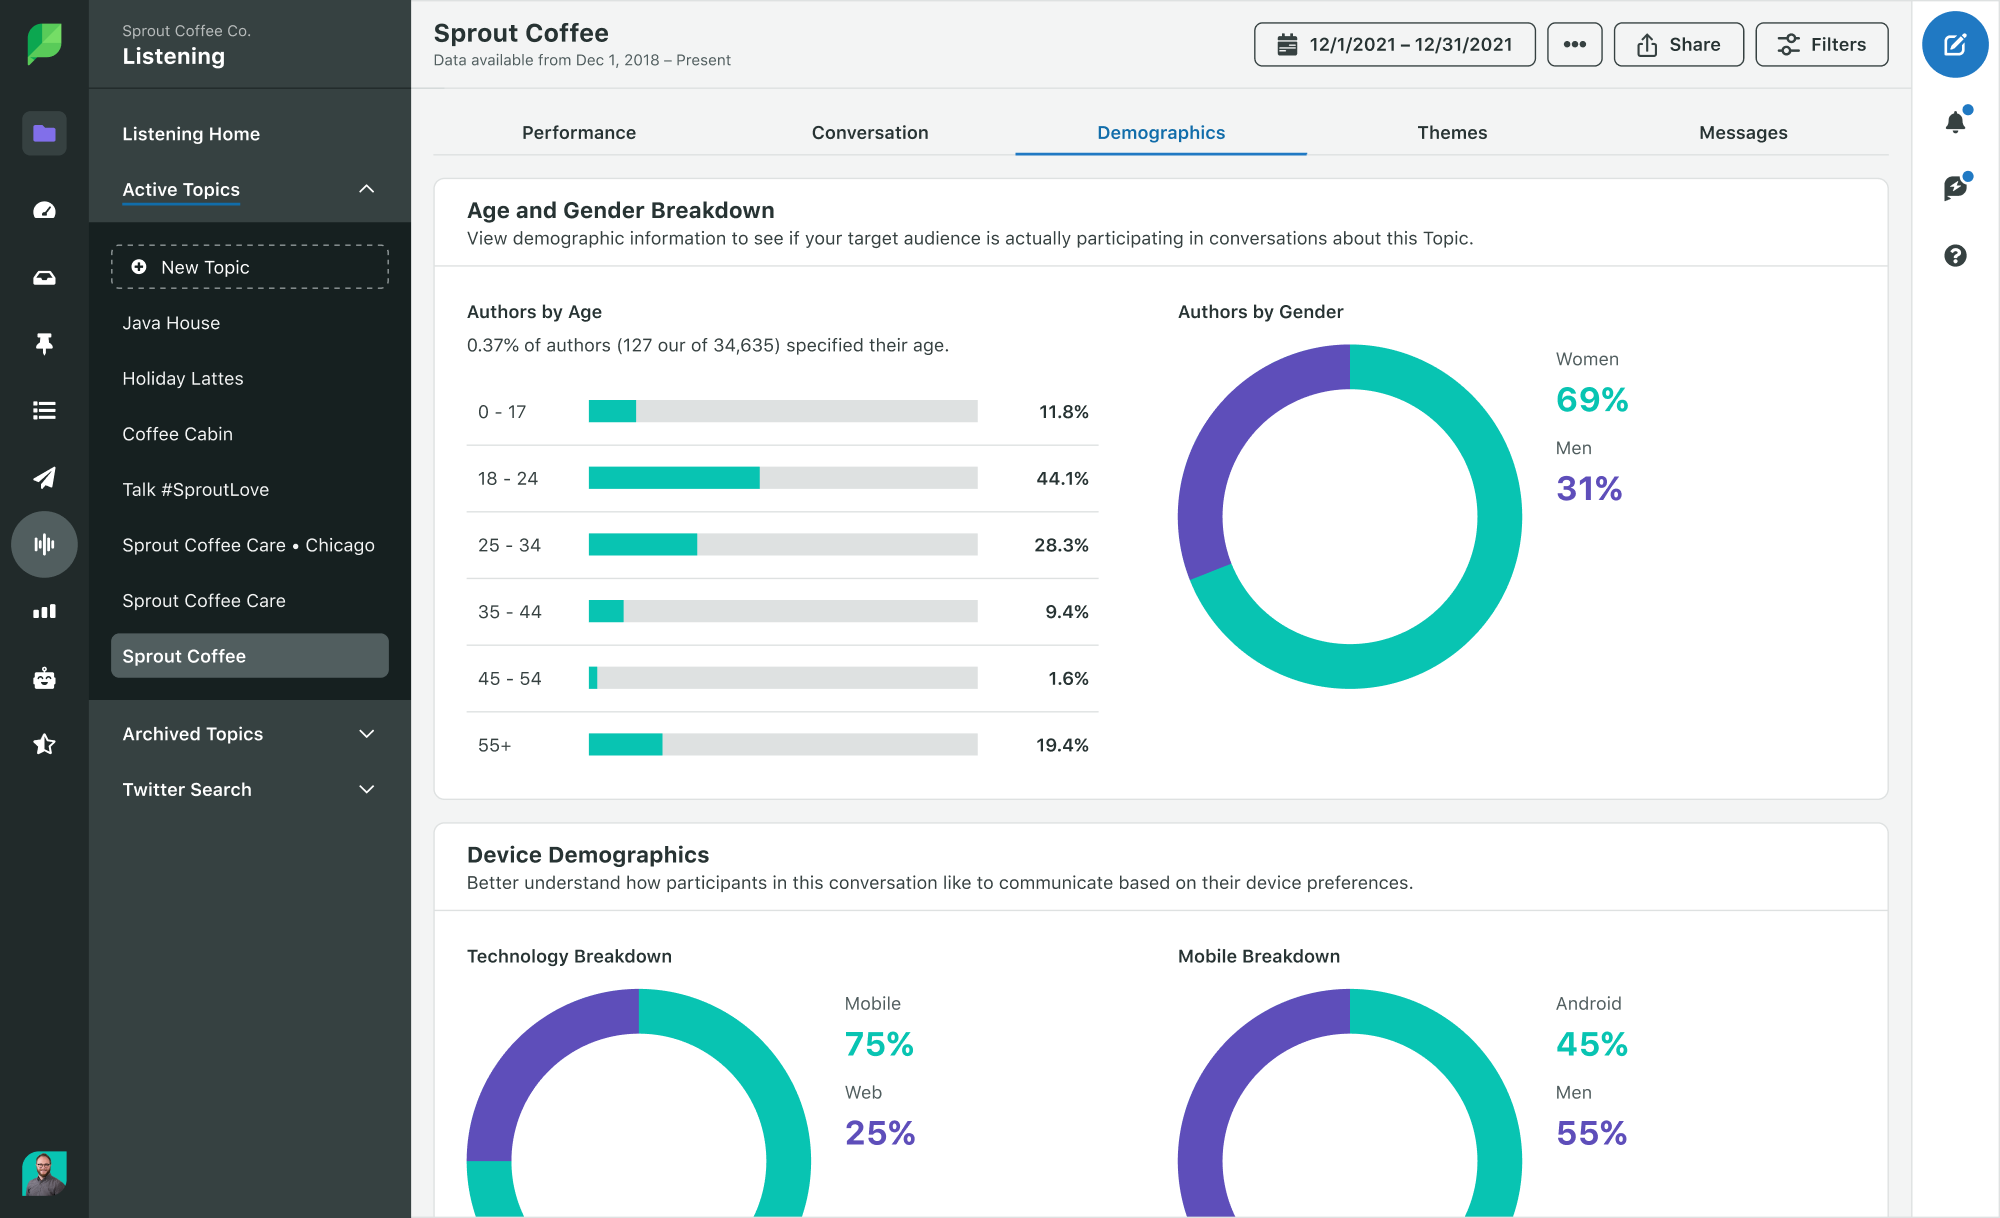
Listening Topic Insights gives you a detailed breakdown of people interacting with a specific topic. This helps you understand whether your target audience is participating in relevant conversations. The device demographics give you a sense of how people like to communicate when discussing a given topic.
6. Identify advocates and Twitter influencers
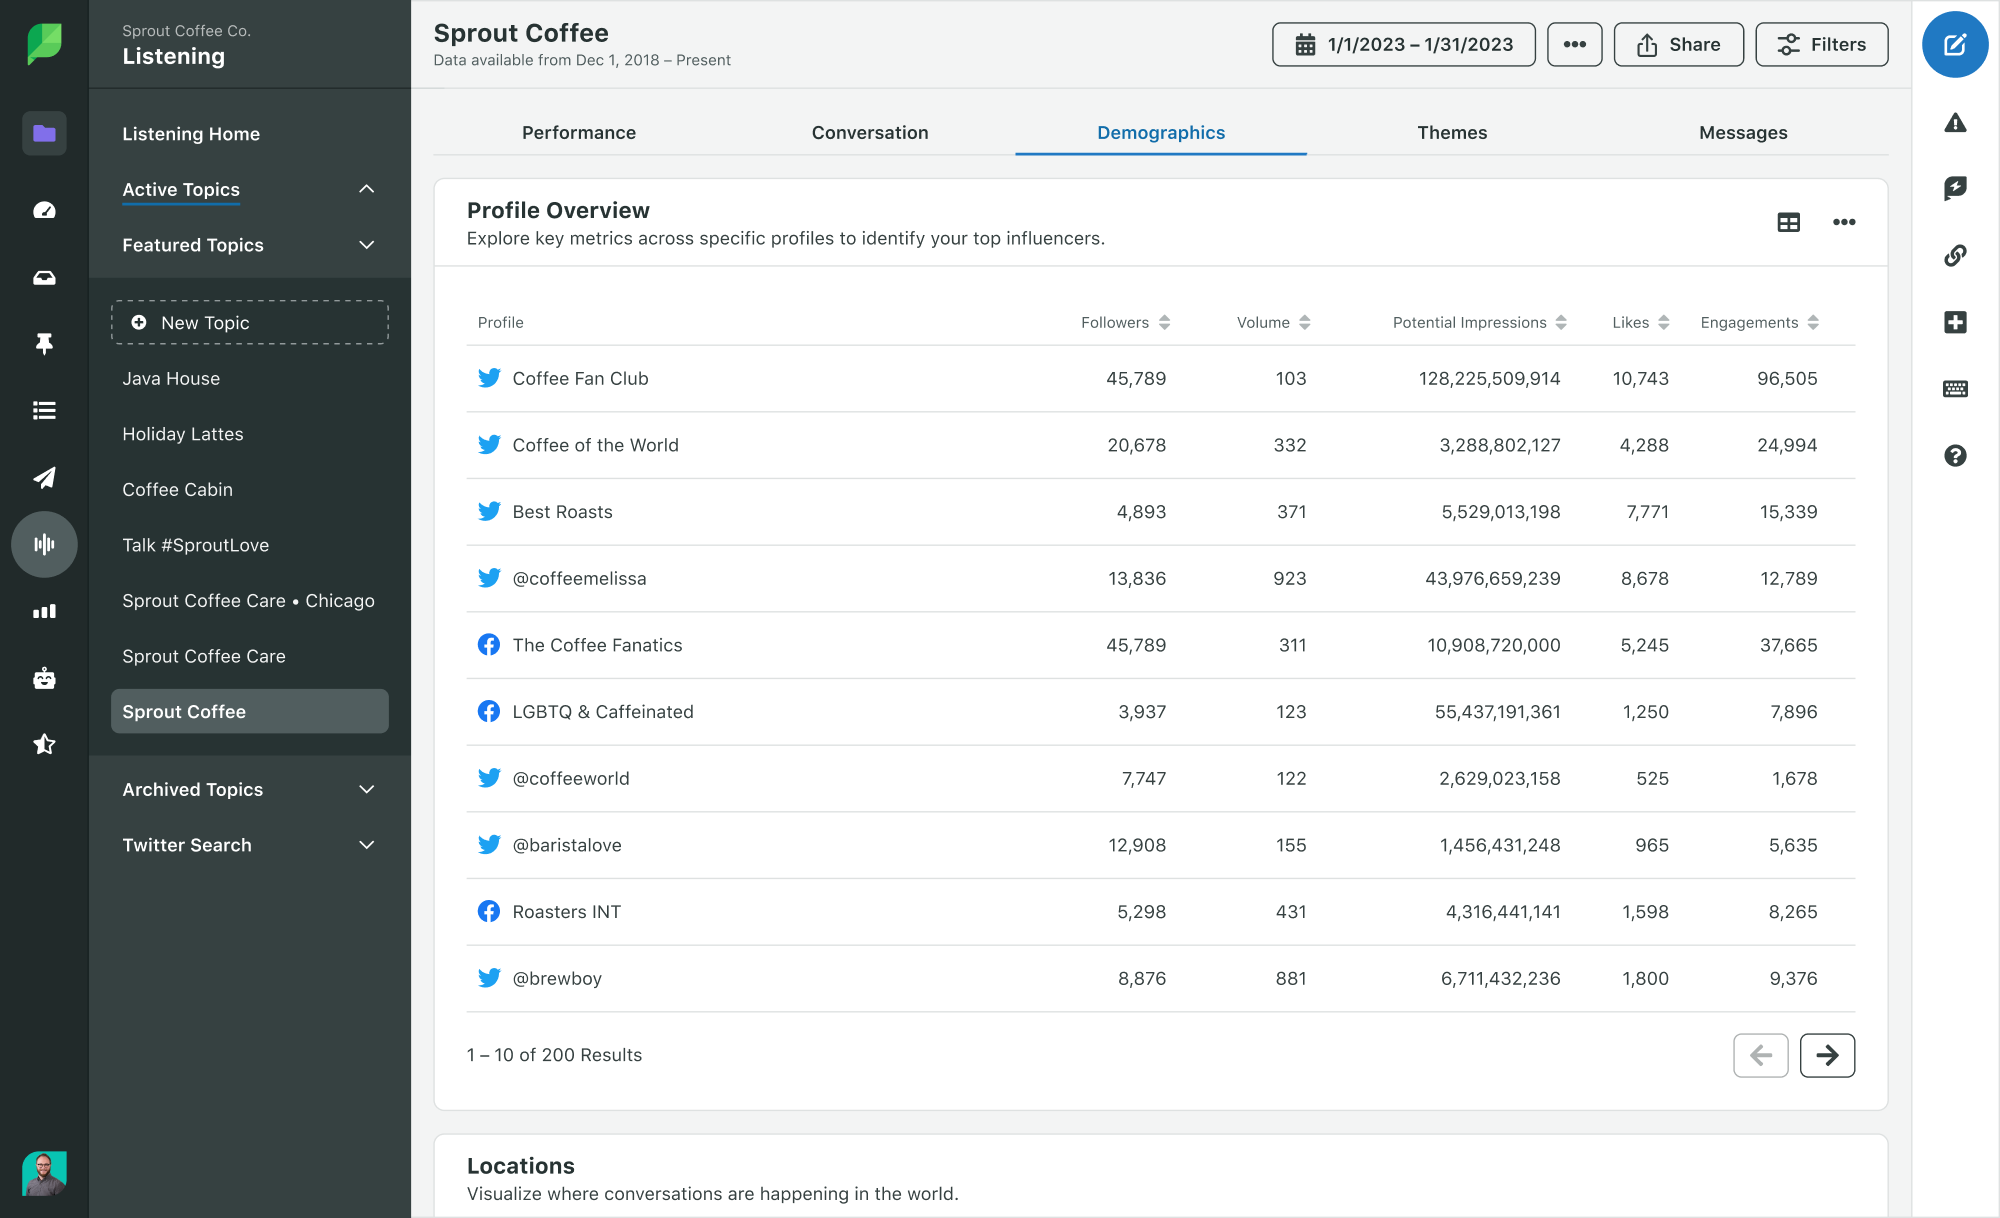
Using the Profile Overview chart in your Listening Demographics can help identify influencers. It shows you which profiles are engaging in conversations around a given topic. This will help you uncover key influencers and advocates on the topic.
From this breakdown, you can easily view the gender, age, volume and engagements for each profile. Sort the list by volume and engagements to see which profiles are dominating the conversation.
From there, you can easily start adding more names and faces to your influencer marketing strategy.
7. Discover hashtag and topic trends
Adding hashtags or jumping on hot topic trends can be a powerful way to bootstrap your posts. But it’s critical those hashtags and topics are relevant to your brand.
We have an all-in-one guide on hashtag analytics, including how to find and use them, but here is a quick summary.
Use the Twitter Trends Report to get a list of topics and hashtags popular with your audience. These are topics and hashtags frequently mentioned with your company's handle. Use this to inform your content and hashtag strategy for better visibility and engagement.

Let’s say most of the posts mentioning your business are asking about “hours.” In this case, you’d want to make that info more accessible through your profiles and business listings.
Or, maybe people are frequently mentioning your brand with the hashtag “#PerfectMorning.” Here, adding the same hashtag to your post could drive higher engagement and impressions.
8. Monitor hashtags and keywords over time
Not only can you surface the best topics and hashtags, but you can also track those keywords and hashtags over time.
Sprout’s Twitter Keyword Report gives you an in-depth analysis of keywords. You can use this to quantify total volume, average volume per day and growth. It even gives you a sampling of those Tweets and engagements.
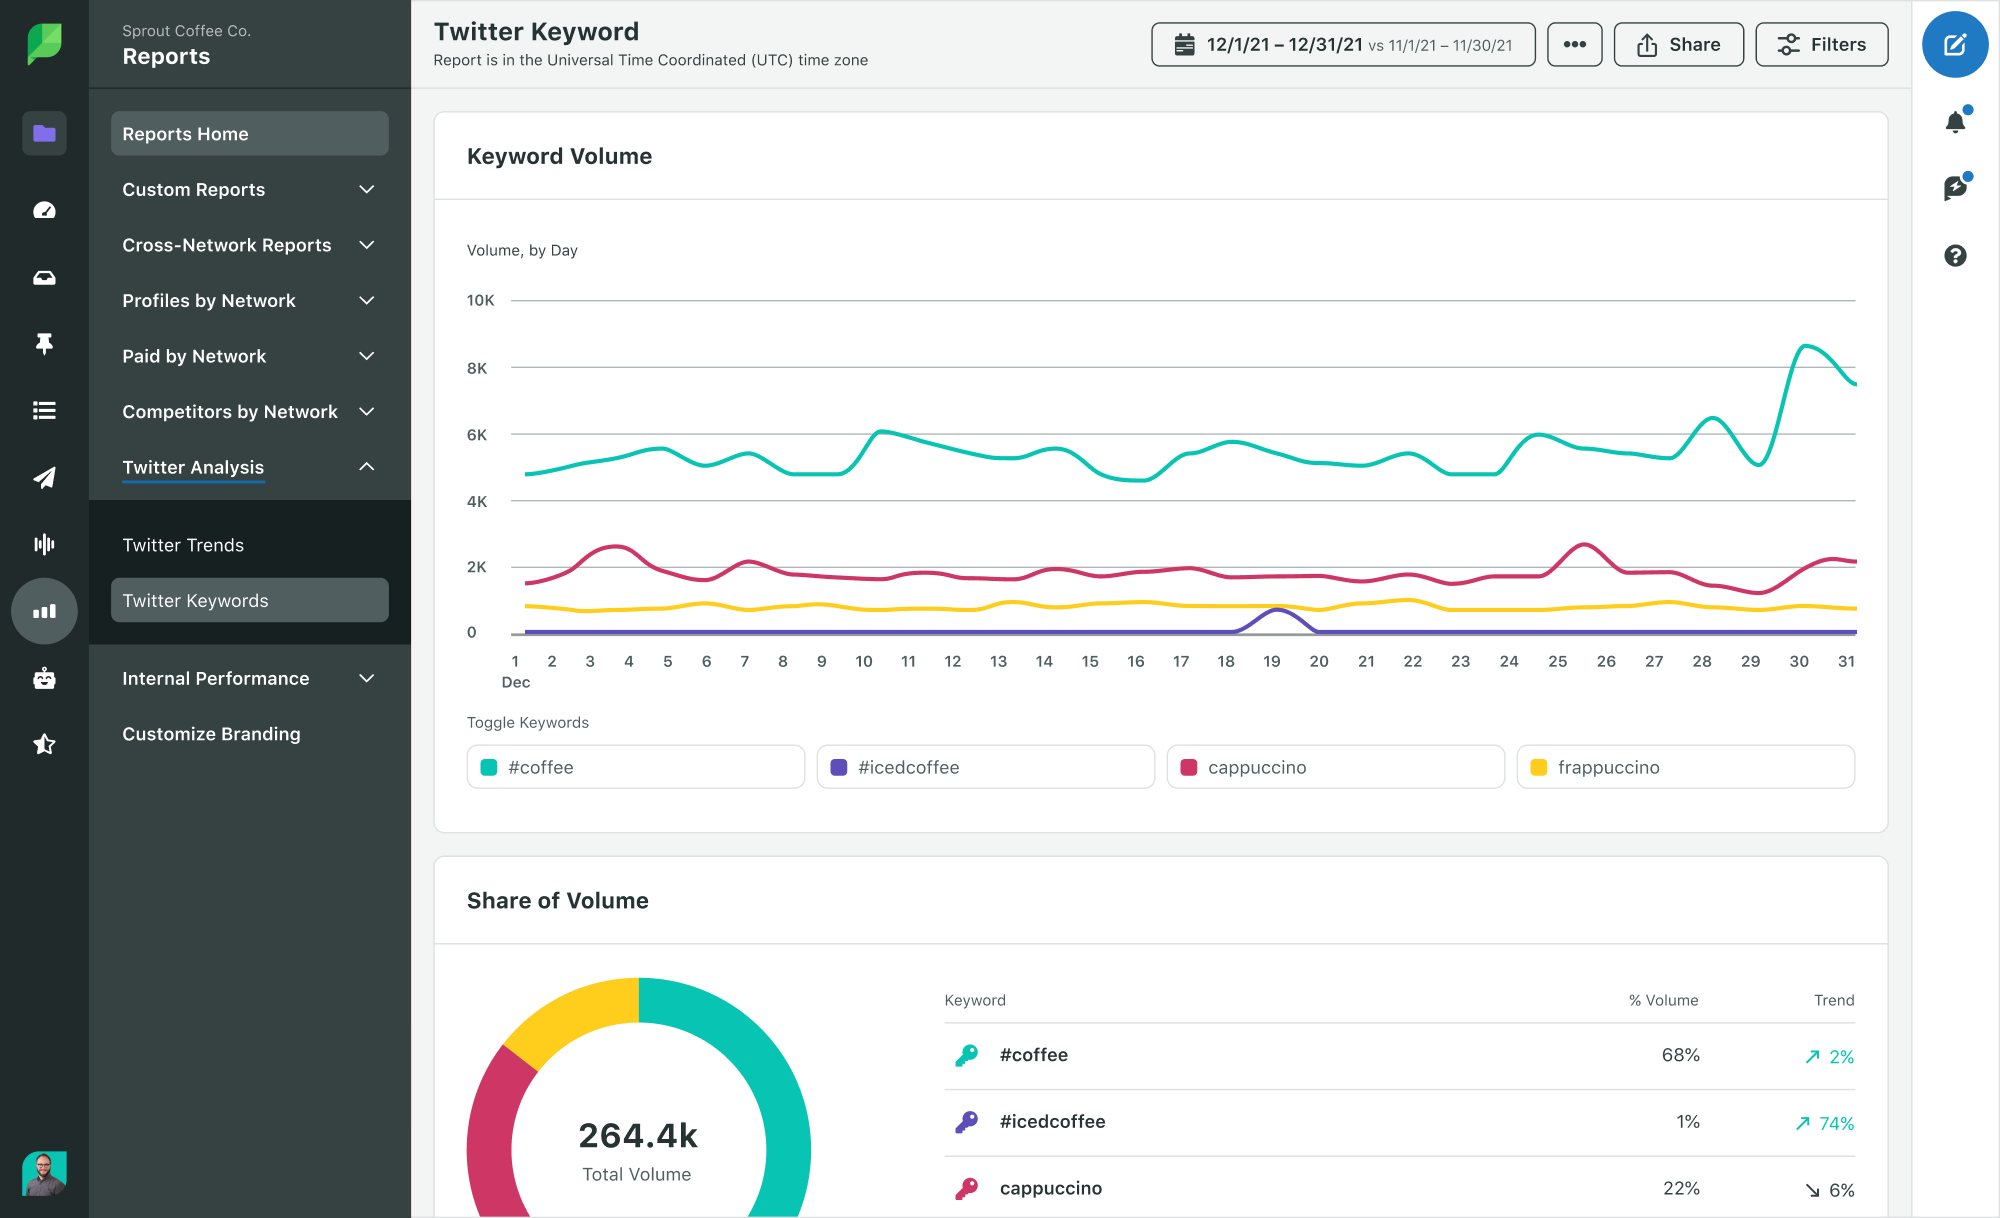
You’ll find information on the volume of each keyword, the top accounts that used those keywords and the drill-down of metrics on each keyword. These reports are not only useful for creating new campaigns but also for monitoring how well a campaign is performing.
9. Visualize Twitter campaigns
Are you and your team creating entire Twitter campaigns? Sprout lets you track both organic and paid campaigns on Twitter.
Tag each outbound or inbound social media message with dedicated campaign designations. See the following example for “Iced Coffee,” “Lemonade” and “Sunny Sale.”
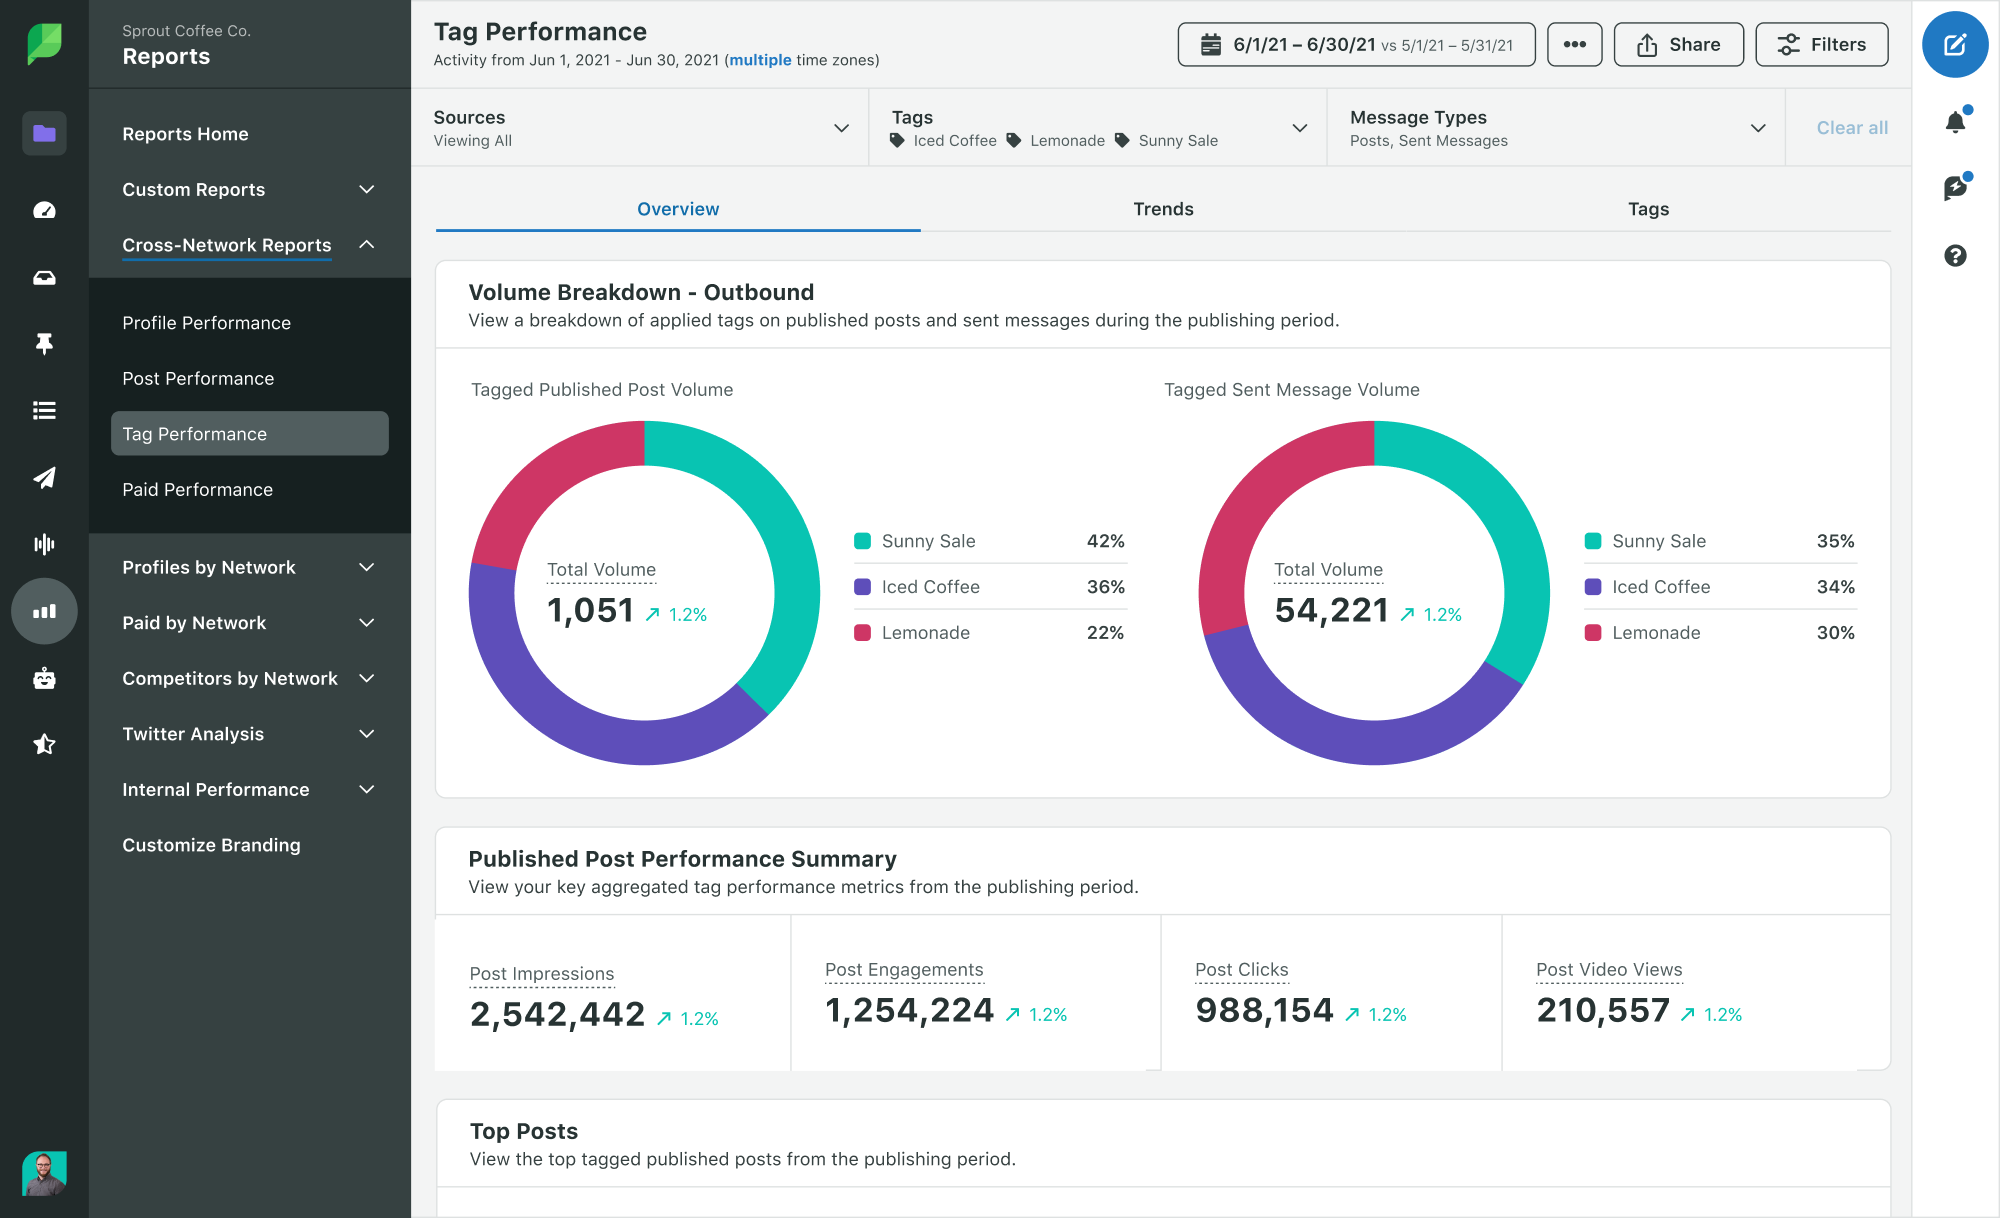
Then track the entire campaign's success within a single dashboard using metrics like:
- Impressions
- Engagements
- Clicks
- Average messages sent per day
- Total sent
- Average messages received per day
- Total received
- Growth trends
Use Twitter analytics confidently
Monitoring your social media analytics regularly enables you to find out what works and what doesn’t. This ultimately means you can make smarter business decisions. In a small business setting, being able to quickly pivot is always a plus.
Once you’ve aligned goals and determined which metrics are key for your business, it’s time to start tracking. Don’t let the numbers or the sea of data scare you. With proper preparation, the right tools and a few best practices, you’ll get the biggest bang for your buck when it comes to tackling Twitter.
Sign up for a personalized demo of Sprout Social to see how it aligns with your Twitter strategy.
Use of Twitter nomenclature across Sprout refers to newly rebranded X platform and related terminology.
Twitter Analytics FAQs
How do I check my Twitter analytics?
You can check your Twitter analytics directly from https://analytics.twitter.com. From your Twitter homepage, you can also go to More > Creator Studio > Analytics
What does Twitter analytics measure?
Twitter analytics measures your post and profile performance over time. It lets you track metrics such as impressions, engagements, profile visits, mentions and follower growth.
Why can’t I see my Tweet analytics?
To see your Tweet analytics, you need to be logged in and have analytics turned on. If you still can’t see your Tweet analytics after this, it’s likely because of the following reasons:
- You’re not primarily Tweeting in one of the supported languages.
- Your account is younger than 14 days.
- You’ve violated Twitter policy.
- Your account is deleted, restricted or suspended.
Additional resources for Twitter Analytics
Twitter analytics: How to analyze and improve your Twitter data

9 Twitter analytics tools to amplify your strategy

Twitter metrics: How & why you should track them

How to create Twitter reports with Sprout Social

How to analyze Twitter followers effectively

What to know about how the Twitter algorithm works

What are Twitter impressions & why are they so important to Twitter?

Twitter mentions: How to find, track & get more
How to View & Measure Your Tweet Activity